Massive GBP/USD Reversal Ahead? Head & Shoulders FormationGBP/USD is at a critical technical juncture following a sharp bullish impulse that pushed the pair above the 1.34 handle, printing a strong weekly bullish engulfing candle and breaking out of a multi-week consolidation zone. This move unfolded in a macro context where the U.S. Dollar Index (DXY) is showing clear signs of weakness, with Non-Commercial net long positions dropping drastically—from around 20,000 to less than 5,000 contracts. This shift points to a fading speculative appetite for the dollar, historically a leading indicator of upcoming corrective phases or broader declines in the DXY.
On the flip side, the Commitments of Traders (COT) report on the British Pound reveals that Non-Commercials (typically hedge funds and asset managers) remain net long on GBP, with a slight increase week-over-week. However, Commercials (generally institutions and hedgers) have aggressively built up a significant net short position—levels that in the past preceded major reversals on the pair. This divergence between speculators and institutional hedgers suggests short-term bullish potential, but with rising risk of exhaustion near current resistance levels.
Adding fuel to this outlook is the retail sentiment: approximately 63% of retail traders are currently short GBP/USD, with an average entry price around 1.3021. This kind of retail crowd positioning, typically inefficient from a historical perspective, adds contrarian support for further upside, as long as price holds above the 1.3340 structure.
From a seasonality perspective, June tends to be a mildly bullish-to-sideways month for GBP/USD, especially when looking at the 10- and 15-year seasonal averages. While the seasonal bias is not particularly strong, there’s also no statistical downward pressure this time of year, leaving room for technically-driven moves influenced by liquidity and sentiment rather than macro patterns alone.
On the technical front, the daily chart shows a steep rally capped by a large green candle on Monday, breaking cleanly through the 1.34 resistance zone. The price is now hovering inside a key supply area between 1.3499 and 1.3550—a historically reactive zone that has triggered major rejections in previous months. How price reacts here will likely shape the next major swing. A confirmed breakout and consolidation above 1.3550 would open the door for an extension toward 1.37–1.3750. Conversely, a sharp rejection followed by a break below 1.3412—and especially under 1.3340—would set the stage for a deeper correction toward 1.3170.
The RSI is currently showing early signs of momentum loss, although no strong bearish divergence has emerged yet. This implies that the pair could still fuel another push higher before running out of steam—possibly forming the right shoulder of a head & shoulders pattern if the rejection scenario plays out.
GBPUSD trade ideas

GBPUSD stuck in a tight range - Waiting for the final moveGBPUSD stuck in a tight range - Waiting for the final move
On Thursday, GBPUSD tested 1.3590 again and briefly reached 1.3615, but the bullish attempt failed. The price dropped back below the resistance zone.
For almost two weeks, GBPUSD has been moving up and down in this area. No major economic events are expected this week.
However, US and China officials will meet in London on Monday, June 9. Optimism for a deal is high, and this could push GBPUSD lower from this zone.
Bearish targets: 1.3425, 1.3350, 1.3250, 1.3170.
⚠️ Watch out! This pair is heavily influenced by news.
You may find more details in the chart!
Thank you and Good Luck!
❤️PS: Ple ase support with a like or comment if you find this analysis useful for your trading day❤️
Disclosure: I am part of Trade Nation's Influencer program and receive a monthly fee for using their TradingView charts in my analysis.

GBP/USD💰Symbol: { GBP/USD }
🟩Price: { 1.35618 }
🟥Stop: { 1.36046 }
1️⃣profit: { 1.35092 }
2️⃣profit: { 1.34570 }
3️⃣profit: { 1.34000 }
📊Check your chart before entering.
🚨Check before use to make sure there is no important news.🚨

GBP/USD Robbery: Can You Grab the Cash Before the Cops Arrive?🚨 GBP/USD "The Cable" forex bank Heist Alert: The Bullish Breakout Robbery Plan (Swing & Scalp Strategy) 🚨
🌟 Hi! Hola! Ola! Bonjour! Hallo! Marhaba! 🌟
Attention Money Makers & Market Robbers! 🤑💰💸
Based on the 🔥Thief Trading Style🔥, here’s our master plan to loot the GBP/USD "The Cable" forex bank. Follow the strategy on the chart—focusing on LONG entries—and escape near the high-risk Red Zone. This area is overbought, consolidating, and a potential reversal trap where bears lurk. 🏆 Take profits fast—you’ve earned it! 💪
🎯 Heist Entries:
📈 Entry 1: "The Breakout Heist!" – Wait for Resistance (1.36200) to break, then strike! Bullish profits await.
📈 Entry 2: "Big Players’ Pullback!" – Jump in at 1.34000+ buy above at any price for a safer steal.
🔔 Pro Tip: Set a chart alert to catch the breakout instantly!
🛑 Stop Loss Rules:
*"Yo, listen! 🗣️ If you’re entering with a buy-stop, DON’T set your SL until AFTER the breakout. Place it at the nearest swing low (3H timeframe) or wherever your risk allows—but remember, rebels risk more! 🔥"*
🏴☠️ Target: 1.37500
🧲 Scalpers: Only play LONG! Use trailing SL to lock in profits. Big wallets? Go all in. Small stacks? Join the swing heist!
📊 Market Pulse:
The GBP/USD "The Cable" is neutral but primed for bullish momentum. Watch:
Fundamentals (COT, Macro, Geopolitics)
Sentiment & Intermarket Trends
Positioning & Future Targets & Overall score
📌 Check our bioo linkks for deep analysis! 🔗🌍
⚠️ Trading Alert:
News = Volatility! Protect your loot:
Avoid new trades during major news
Use trailing stops to secure profits
💥 Boost This Heist!
Hit 👍 & 🔄 to strengthen our robbery crew! Let’s dominate the market daily with the Thief Trading Style. 🚀💵
Stay tuned—another heist drops soon! 🎯🐱👤

Short till 1.34557Price has entered the sellside curve of the market maker sell model. This has warranted bearish momentum down to 1.34557.

GBPUSD Edges HigherGBPUSD Edges Higher
GBP/USD is attempting a fresh increase above the 1.3500 resistance.
Important Takeaways for GBP/USD Analysis Today
- The British Pound is attempting a fresh increase above 1.3515.
- There was a break above a key bearish trend line with resistance at 1.3535 on the hourly chart of GBP/USD at FXOpen.
GBP/USD Technical Analysis
On the hourly chart of GBP/USD at FXOpen, the pair declined after it failed to clear the 1.3615 resistance. The British Pound even traded below the 1.3575 support against the US Dollar.
Finally, the pair tested the 1.3500 zone and is currently attempting a fresh increase. The bulls were able to push the pair above the 50-hour simple moving average and 1.3540. There was a break above a key bearish trend line with resistance at 1.3535.
The pair tested the 50% Fib retracement level of the downward move from the 1.3616 swing high to the 1.3507 low. It is now showing positive signs above 1.3540.
On the upside, the GBP/USD chart indicates that the pair is facing resistance near 1.3575 and the 61.8% Fib retracement level of the downward move from the 1.3616 swing high to the 1.3507 low.
The next major resistance is near 1.3590. A close above the 1.3590 resistance zone could open the doors for a move toward 1.3615. Any more gains might send GBP/USD toward 1.3650.
On the downside, immediate support is near the 1.3515. If there is a downside break below 1.3515, the pair could accelerate lower. The first major support is near the 1.3500 level. The next key support is seen near 1.3450, below which the pair could test 1.3420. Any more losses could lead the pair toward the 1.3350 support.
This article represents the opinion of the Companies operating under the FXOpen brand only. It is not to be construed as an offer, solicitation, or recommendation with respect to products and services provided by the Companies operating under the FXOpen brand, nor is it to be considered financial advice.

GBP/USD Breakdown After Fake Resistance Break | Bearish Targets 📉 GBP/USD Breakdown After Fake Breakout Trap
Price action formed a fake breakout above the recent resistance near 1.35920, trapping late buyers. Shortly after, a clean breakdown below the ascending trendline confirmed a shift in structure. This move suggests smart money manipulation followed by trend continuation.
✅ Current Setup:
Fake Breakout above resistance
Trendline Breakdown + Retest
Short Bias Active
🎯 Bearish Targets:
Target 1: 1.33368
Target 2: 1.32571
🔎 Waiting for price to stay below trendline with lower highs forming on LTFs (lower timeframes) for extra confirmation.
🧠 Note: This analysis is for educational purposes only. Always use proper risk management and follow your own strategy before entering any trade.
#GBPUSD #Forex #SmartMoney #PriceAction #Breakdown #FXAnalysis #TechnicalAnalysis #TradingView

Analysis of Trades and Trading Tips for the GBP/USDThe test of the 1.3614level occurred when the RSI indicator had already risen significantly above the zero line, which limited the pair's upside potential. For this reason, I did not buy the GBP/USD.
There has been progress in the trade negotiations between China and the United States: yesterday, both sides stated that consensus had been reached on the main issues. This breakthrough, the result of several months of intense discussions, gives hope for the stabilization of global financial markets. Though not disclosed in detail, the agreements likely included key issues such as the export of rare earth materials from China to the U.S. to China. Nevertheless, despite the optimistic statements, analysts advise against excessive enthusiasm. Previous negotiation rounds also ended with promises that were later unfulfilled. The key to success will be boss sides' ability to honor their commitments and show willingness for further concessions. The impact of this progress on the global economy is hard to overestimate. Reducing trade tensions could stimulate the growth of international trade, ease inflationary pressures, and bolster consumer confidence. However, risks remain, and the agreement's long-term outcome will depend on both countries' subsequent actions.
Today, we should pay attention to the speech by Philip Lane, a British Central Bank representative, as there are no macroeconomic releases from the the eurozone. Markets will closely monitor his rhetoric for hints regarding the central bank's plans on interest rates. Investors hope to hear more clarity from Lane about how the ECB intends to proceed with rates and whether the regulator plans further cuts this summer. Overall, Philip Lane's speech will be the key event of the day for financial markets. His comments may influence currency movements in the first half of the day. Investors are advised to watch his remarks closely and consider them in decision-making

GBPUSD SELL after sweeping the daily swing high, we are shifting structure on the 4 hour. We have returned to 4 hour order block. 1 hour has created an order block, looking to enter off that block and target the lows. Take partials on the way down

GBPUSD looks ready for its next up-legGBPUSD broke above key levels, triggering a double top pattern with targets near 1.4778. In this video, we discuss risk-reward adjustments, why reducing your stop makes sense, and how to deal with sideways markets and small triangle setups. Learn why taking smaller profits can sometimes lead to better long-term results. Leave your thoughts in the comments.
This content is not directed to residents of the EU or UK. Any opinions, news, research, analyses, prices or other information contained on this website is provided as general market commentary and does not constitute investment advice. ThinkMarkets will not accept liability for any loss or damage including, without limitation, to any loss of profit which may arise directly or indirectly from use of or reliance on such information.

Analysis of Trades and Trading Tips for the British PoundThe price test at 1.3535 in the second half of the day occurred just as the RSI indicator was beginning to move downward from the zero line. This confirmed the correct entry point for selling the pound, resulting in a decline of more than 30 pips.
U.S economic indicators published on Friday sparked a wave of optimism across financial markets. Non-farm employment showed confident growth, surpassing economists' forecasts and reaching 139,000 new jobs, while market expectations hovered around 127,000. This factor immediately impacted currency rates. prompting the U.S. dollar to strengthen against major world currencies, particularly the British pound. The unemployment rate, remaining stable at 4.2%, also added to the positive sentiment. A low unemployment rate indicates the U.S. economy's healthy state and stable labor demand. This provides a favorable backdrop for continued economic growth and strengthens the dollar's position. The British pound's reaction to this news was expected - a decline against the U.S dollar. investors, assessing U.S. economic prospects as more favorable, redirected their capital, increasing demand for the dollar and decreasing demand for the pound sterling.
Today, there is no economic data from the UK, so it possible that after Friday's pullback, pound buyers may continue to act within the bullish market framework, betting on further growth in the GBP/USD pair. The absence of fresh economic data leaves room for speculation and allows traders to rely on already-established trends. However, existing risks should not be forgotten, Global economic uncertainty due to U.S. tariffs could exert pressure on the British currency at any moment.


GBPUSD COT and Liquidity AnalysisHey what up traders welcome to the COT data and Liquidity report. It's always good to go with those who move the market here is what I see in their cards. I share my COT - order flow views every weekend.
🎯 Non Commercials added significant longs and closed shorts at the same time. So for that reason I see the highs as a liquidity for their longs profits taking.
📍Please be aware that institutions report data to the SEC on Tuesdays and data are reported on Fridays - so again we as retail traders have disadvantage, but there is possibility to read between the lines. Remember in the report is what they want you to see, that's why mostly price reverse on Wednesday after the report so their cards are hidden as long as possible. However if the trend is running you can read it and use for your advantage.
💊 Tip
if the level has confluence with the high volume on COT it can be strong support / Resistance.
👍 Hit like if you find this analysis helpful, and don't hesitate to comment with your opinions, charts or any questions.
Analysis done on the Tradenation Charts
Disclosure: I am part of Trade Nation's Influencer program and receive a monthly fee for using their TradingView charts in my analysis.
"Adapt what is useful, reject what is useless, and add what is specifically your own."
— David Perk aka Dave FX Hunter ⚔️

GBPUSD| Bullish Structure HoldingGBPUSD continues to map out a bullish structure. While higher timeframe liquidity remains untouched, I’m anticipating a potential continuation on the lower timeframes.
Refined the 30-minute structure and confirmed bullish intent is intact. Now focused on price taking short-term liquidity and mitigating into the marked order block before considering any execution.
The setup is developing — staying patient and letting price come to me.
— Inducement King 👑
Bless Trading!

gbpusd Weekly forcast of NJ pair
We can see bearish Bias on 4hr tf
Always wait for confirmation/strong setup for open a trade.
Thank you and Good Luck!
Happy trading.

GBPUSD - Very InterestingWith NFP creating massive volatility on Friday this pair is a bit messy.
We have however created an internal structure shift on the 15min timeframe to the downside lower the HTF order flow still being bullish
This could be a case of get what we can to the downside until we hit the HTF demand and look to get long.
As you can see I am already trying to forecast ahead of what could potentially happen with this pair as when it gets to certain levels and there are reactions it will come as no surprise.
If I can be of assistance to anybody please don't hesitate to message.

GBP USD LONG ANALYSIS
long cable
trend bias: bullish
entry: clear body close above 1.35800 to target thursday high of 1.36200
approx 35 pips
risk to reward 1:2
sl 15 pips
tp 30 pips
expected date: tuesday 10 june 2025 ldn/ny session
hh

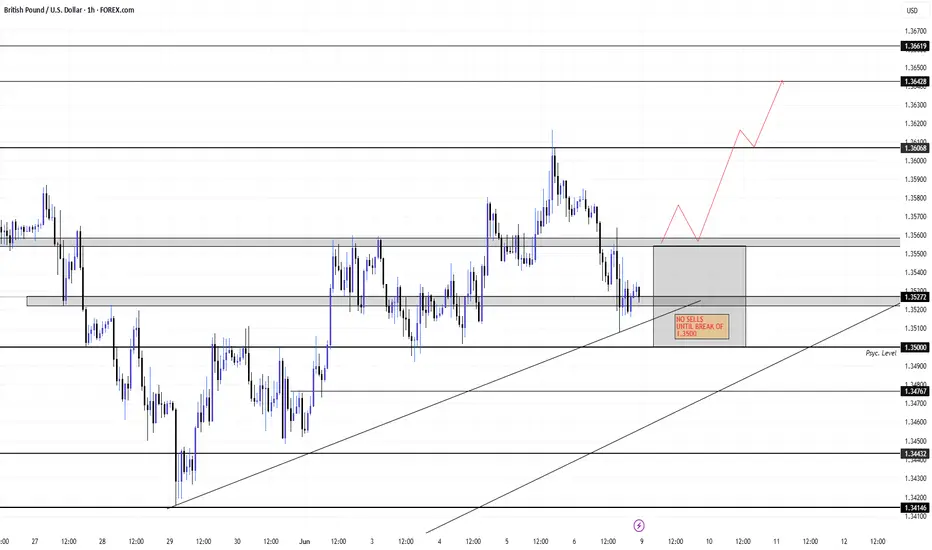
GBP/USD IS NEUTRAL
The pair reacted off a major daily resistance zone at 1.36000 last week. Overall on the big timeframes it remain bullish but I'd only consider buys above 1.35600 towards 1.36400 . The smaller timeframes have been printing LHs and LLs but there are NO SELLS for me until the break of 1.35000 psychological level.
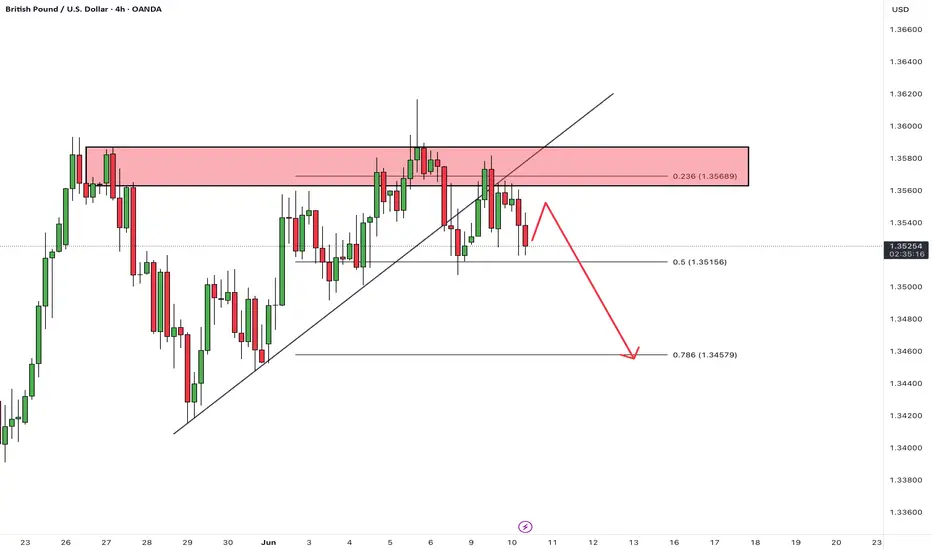
GBPUSDHello Traders! 👋
What are your thoughts on GBPUSD?
On the 4-hour timeframe, GBPUSD has broken below its ascending trendline and is now trading below a key resistance zone.
We expect the pair to consolidate briefly within this area, and then move lower toward the specified support level.
As long as the price remains below the resistance and the broken trendline, the bearish bias remains valid.
Don’t forget to like and share your thoughts in the comments! ❤️
GBPUSD Approaches Key Resistance: Watch for Bearish ReversalGBPUSD pair is trading within a clearly defined ascending channel on the 1-hour chart, showing a short-term bullish structure. However, this bullish move appears corrective within a broader consolidation range capped near the 1.3590 resistance zone.
🔍 Technical Breakdown:
Current Price: 1.35535
Immediate Resistance: 1.35885–1.35929 (previous highs and psychological level)
Support Levels:
Trendline support near 1.3530
Horizontal support: 1.34282, 1.34176
Structure:
Price has formed a bullish flag breakout and is now approaching key resistance.
A new higher high is anticipated toward 1.3590, but this level has repeatedly rejected price in the past.
The projected path indicates a potential liquidity grab above 1.3590 followed by a sell-off toward 1.3420–1.3410 area, aligning with a trendline break scenario.
Bearish Scenario:
A strong rejection from the 1.3590 zone, especially if accompanied by bearish divergence or a strong candle close, could trigger a shift back down to the 1.3417–1.3428 support zone.
This would confirm a short-term top and potential retracement toward lower liquidity zones.
📊 Fundamental Backdrop:
USD-side:
Recent U.S. labor market strength (e.g. ADP report and low jobless claims) supports a hawkish bias, favoring USD upside.
However, Fed policymakers remain cautious due to trade tensions and tariff uncertainty. This has injected short-term volatility into USD pairs.
GBP-side:
UK economic data has been mixed, with GDP growth forecasts under scrutiny.
BoE policymakers are dovish, emphasizing weak productivity and wage pressures, making the pound vulnerable to downside catalysts.
📌 Conclusion:
Watch for a potential bull trap near 1.3590, followed by a bearish reversal toward 1.3420–1.3410 if momentum weakens and sellers step in. This would complete the expected technical leg down and align with broader risk sentiment if dollar strength returns.

Bullish bounce off overlap support?GBP/USD is falling towards the support level which is an overlap support that aligns with the 38.2% Fibonacci retracement and could bounce from this level to our take profit.
Entry: 1.3543
Why we like it:
There is an overlap support level that aligns with the 38.2% Fibonacci re4tracement.
Stop loss: 1.3493
Why we like it:
There is a pullback support level that is slightly below the 61.8% Fibonacci retracement.
Take profit: 1.3601
Why we like it:
There is a pullback resistance level.
Enjoying your TradingView experience? Review us!
Please be advised that the information presented on TradingView is provided to Vantage (‘Vantage Global Limited’, ‘we’) by a third-party provider (‘Everest Fortune Group’). Please be reminded that you are solely responsible for the trading decisions on your account. There is a very high degree of risk involved in trading. Any information and/or content is intended entirely for research, educational and informational purposes only and does not constitute investment or consultation advice or investment strategy. The information is not tailored to the investment needs of any specific person and therefore does not involve a consideration of any of the investment objectives, financial situation or needs of any viewer that may receive it. Kindly also note that past performance is not a reliable indicator of future results. Actual results may differ materially from those anticipated in forward-looking or past performance statements. We assume no liability as to the accuracy or completeness of any of the information and/or content provided herein and the Company cannot be held responsible for any omission, mistake nor for any loss or damage including without limitation to any loss of profit which may arise from reliance on any information supplied by Everest Fortune Group.

GBPUSD Elliott Wave AnalysisHello friends
We are witnessing the formation of a complete Elliott wave pattern on the GBP USD chart. These waves from 1 to 5 are quite clear (of course, you can count them so that they become an ABC zigzag, isn't it interesting!) and you can even count their subwaves. Now wave 5 is completing and we are witnessing multiple divergences in wave 5. With the breakdown of the trend line drawn below and a pullback to it, we can expect the price to fall to the specified support. The first support is 1.305 and then 1.2800.
Good luck and be profitable.

GBPUSDHello traders,
With all news that happening in middle east since yesterday.
I hope ending the war with no humanity loss.
That will affect GBPUSD and GOLD, both of them looks like near the ups.
active now,
Good luck for me and you
