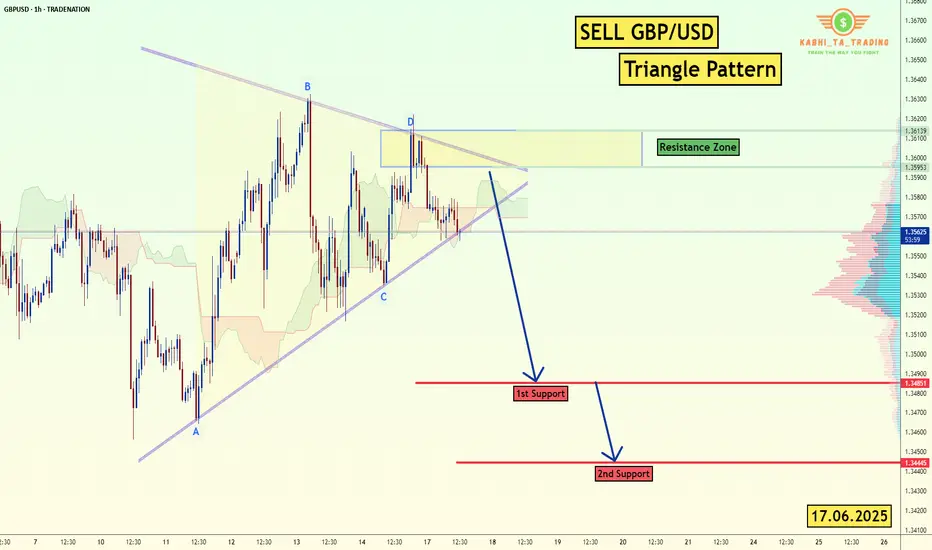
GBP/USD - H1-Triangle Breakout (17.06.2025)The GBP/USD Pair on the H1 timeframe presents a Potential Selling Opportunity due to a recent Formation of a Triangle Breakout Pattern. This suggests a shift in momentum towards the downside in the coming hours.
Possible Short Trade:
Entry: Consider Entering A Short Position around Trendline Of The Pattern.
Target Levels:
1st Support – 1.3485
2nd Support – 1.3444
🎁 Please hit the like button and
🎁 Leave a comment to support for My Post !
Your likes and comments are incredibly motivating and will encourage me to share more analysis with you.
Best Regards, KABHI_TA_TRADING
Thank you.
Disclosure: I am part of Trade Nation's Influencer program and receive a monthly fee for using their TradingView charts in my analysis.
GBPUSD trade ideas
GBP/USD - For FOMC & Fed Interest RateThe GBP/USD pair on the M30 timeframe presents a Potential Buying Opportunity due to a recent Formation of a Channel Pattern. This suggests a shift in momentum towards the upside and a higher likelihood of further advances in the coming hours.
Possible Long Trade:
Entry: Consider Entering A Long Position around Trendline Of The Pattern.
Target Levels:
1st Resistance – 1.3567
2nd Resistance – 1.3682
🎁 Please hit the like button and
🎁 Leave a comment to support for My Post !
Your likes and comments are incredibly motivating and will encourage me to share more analysis with you.
Best Regards, KABHI_TA_TRADING
Thank you.
Disclosure: I am part of Trade Nation's Influencer program and receive a monthly fee for using their TradingView charts in my analysis.

GBPUSD H1 compression BUY/HOLD TP1 +100 TP2 +200 pips low risk🏆 GBPUSD Market Update
📊 Technical Outlook
Short-term: BULLS active; resistance forming mid‑1.3600s, consolidation below 1.3600s
Mid-term: Neutral to slight bullish bias; bulls seek 1.3600–1.3700/1.3730 zone
Status: Narrow trading range (tight band) ahead of key UK CPI, Fed & BoE meetings
🔥 Latest Forex Updates
GBP/USD is consolidating in a narrow range around the mid‑1.3500s ahead of this week’s UK CPI and central bank meetings.
The pair holds defensive below 1.3600, with dovish BoE bets capping gains while the Fed is expected to stand pat.
GBP/USD sits near a 40‑month high (~1.3600), boosted by geopolitical risk tone, but lacking momentum to break much higher.
GBP/USD hit ~1.3600 after rebounding from 1.3515 amid renewed Middle East tensions and a weaker US dollar.
Live charts show a mild bullish tilt, awaiting central bank outcomes.
💡 Trade Recommendation
Buy GBPUSD at 1.3530 (recommended entry near 1.3530)
Take Profit at 1.3730 → +200 pips profit target
Stop Loss: 50 pips (around 1.3480)
This trade aligns with the current structure: shallow dip followed by rebound, positioning ahead of central bank catalysts. Momentum above resistance could propel GBP/USD toward 1.3730.
📌 Market Overview
Metric Details
Current Price ~1.3565–1.3600
24H Range 1.3515–1.3600
Central Event Risks UK CPI (Wed), US Retail Sales & Fed (Wed), BoE (Thu)
Geopolitical Middle East tension supports USD weakness, aiding GBP
📈 Forecast Highlights
Support Levels: ~1.3530 (100‑period SMA), ~1.3460, ~1.3425
Resistance Levels: 1.3600, 1.3630 static ceiling, followed by ~1.3700–1.3730 for bulls
🧭 Final Take
GBP/USD sits in a tight range, awaiting central bank clarity. The recommended long trade at 1.3530 aims to capitalize on upside momentum toward 1.3730, supported by technical confluence and a softer USD. Manage risk with a 50‑pip stop loss.

GBPUSD I Montly CLS I KL WOB I Model 1Hey, Market Warriors, here is another outlook on this instrument
If you’ve been following me, you already know every setup you see is built around a CLS Footprint, a Key Level, Liquidity and a specific execution model.
If you haven't followed me yet, start now.
My trading system is completely mechanical — designed to remove emotions, opinions, and impulsive decisions. No messy diagonal lines. No random drawings. Just clarity, structure, and execution.
🧩 What is CLS?
CLS is real smart money — the combined power of major investment banks and central banks moving over 6.5 trillion dollars a day. Understanding their operations is key to markets.
✅ Understanding the behavior of CLS allows you to position yourself with the giants during the market manipulations — leading to buying lows and selling highs - cleaner entries, clearer exits, and consistent profits.
📍 Model 1
is right after the manipulation of the CLS candle when CIOD occurs, and we are targeting 50% of the CLS range. H4 CLS ranges supported by HTF go straight to the opposing range.
"Adapt what is useful, reject what is useless, and add what is specifically your own."
— David Perk aka Dave FX Hunter ⚔️
👍 Hit like if you find this analysis helpful, and don't hesitate to comment with your opinions, charts or any questions.

#GBPUSD: A strong bullish move incoming, comment your views The price has shown a possible price divergence, which could lead to a long-term move to 1.37. We expect the US dollar to weaken, which will likely push the price of GBPUSD to our target. Key economic data will be released later today and tomorrow, which could shape the price pattern.
Good luck and trade safely!
Team Setupsfx_

GBPUSD Will FOMC and BOE Drive the Next Move?GBPUSD Will FOMC and BOE Drive the Next Move?
GBPUSD completed a bearish harmonic pattern near the end of May, signaling downside potential.
Despite multiple attempts to decline, rising geopolitical tensions in the Middle East and the FED’s reluctance to cut rates have kept price movements in check.
The pair repeatedly tested the 1.3600 resistance zone, but finally moved down by nearly 160 pips yesterday.
With the FOMC Interest Rate decision today and BOE’s rate announcement tomorrow, the market could see a rebound ahead of FOMC for a larger correction, potentially setting up for a decline tomorrow.
While this remains an assumption for now, as long as the harmonic pattern remains valid, further downside remains a possibility.
You may find more details in the chart!
Thank you and Good Luck!
❤️PS: Please support with a like or comment if you find this analysis useful for your trading day❤️
Disclosure: I am part of Trade Nation's Influencer program and receive a monthly fee for using their TradingView charts in my analysis.

GBPUSD may form a false break of supportGBPUSD has wasted the entire daily move (ATR) and is forming a false break of the mirror level support and trading range support. The price fell on the background of the dollar growth (which is trading on the background of the global downtrend)
Now, while the price is consolidating below the mirror level, sellers (physical persons) open deals. But, based on the situation and spent ATR when the price returns inside the range there will be a liquidation stage, which can provoke the price growth
The price fixing above 1.34437 may be the beginning of a pullback (trend growth).
Scenario: if the decline does not continue, and the price is able to consolidate above 1.3448, in this case we can expect a correction to 1.35, 1.353.

GBP/USD 3H CHART PATTERN.GBP/USD on the 3-hour timeframe, here’s the analysis and potential target zones derived from the chart:
📉 Current Trend:
The market has broken down from an ascending channel.
Price retested the support-turned-resistance zone around 1.35060, confirming bearish momentum.
Ichimoku Cloud is above price — supporting bearish bias.
---
🎯 Targets Based on the Chart:
1. First Target (1st Support Zone):
Level: Approximately 1.33449
This is your first major support zone marked on the chart — expect a possible reaction or consolidation here.
2. Second Target (2nd Support Zone):
Level: Approximately 1.32800
This is the second support zone — if price breaks below 1.33449, this becomes the next logical bearish target.
---
🔍 Summary:
Sell below: 1.3450
Target 1: 1.3345
Target 2: 1.3280
Stop-loss suggestion: Above the resistance zone ~1.3506
Let me know if you want SL/TP values based on pips, risk %, or a strategy adjustment.

Lingrid | GBPUSD potential Long from the Support ZoneThe price perfectly fulfilled my previous idea . FX:GBPUSD SPREADEX:GBP has bounced off confluence support near 1.3395 where the upward trendline and horizontal structure intersect. A minor range formed after the recent corrective drop, hinting at possible accumulation. A breakout above the range and reclaiming 1.3450 would shift momentum back toward the 1.3537 resistance.
📈 Key Levels
Buy zone: 1.3390–1.3410
Sell trigger: breakdown below 1.3390
Target: 1.35375
Buy trigger: bullish breakout from current consolidation
💡 Risks
Failure to hold above the rising trendline could shift the trend short-term bearish
GBP remains sensitive to macroeconomic news—any surprises could disrupt this setup
Range failure and low volume may delay the expected move upward
Traders, if you liked this idea or if you have your own opinion about it, write in the comments. I will be glad 👩💻

GBPUSD Making Its Prices HighGBP/USD now faces some renewed selling orders and slips back to the 1.3600 zone on Monday. Cable's decent gains come on the heels of rising pessimism about the US Dollar and encouraging geopolitical news.

GBPUSD| Bullish Structure HoldingGBPUSD continues to map out a bullish structure. While higher timeframe liquidity remains untouched, I’m anticipating a potential continuation on the lower timeframes.
Refined the 30-minute structure and confirmed bullish intent is intact. Now focused on price taking short-term liquidity and mitigating into the marked order block before considering any execution.
The setup is developing — staying patient and letting price come to me.
— Inducement King 👑
Bless Trading!

Potential GBP/USD Short Trade from Double Top ResistanceThis GBP/USD chart displays a bearish setup following a double top pattern near the upper trendline of an ascending channel. Price failed to break above resistance and has begun reversing, indicating potential downside momentum. The Ichimoku Cloud shows weakening bullish pressure as price starts to dip below the cloud. Key support levels have been highlighted where price may react. A break below the lower boundary of the channel and the cloud could confirm a bearish continuation. Volume and structure suggest sellers gaining control, making this setup favourable for a short position based on technical confluence and potential trend reversal.
Entry: 1.35850
Target 1: 1.35460
Target 2: 1.35030
If you found this analysis helpful, don’t forget to drop a like and comment. Your support keeps quality ideas flowing—let’s grow and win together! 💪📈

Short till 1.34557Price has entered the sellside curve of the market maker sell model. This has warranted bearish momentum down to 1.34557.

Analysis of Trades and Trading Tips for the GBP/USDThe test of the 1.3614level occurred when the RSI indicator had already risen significantly above the zero line, which limited the pair's upside potential. For this reason, I did not buy the GBP/USD.
There has been progress in the trade negotiations between China and the United States: yesterday, both sides stated that consensus had been reached on the main issues. This breakthrough, the result of several months of intense discussions, gives hope for the stabilization of global financial markets. Though not disclosed in detail, the agreements likely included key issues such as the export of rare earth materials from China to the U.S. to China. Nevertheless, despite the optimistic statements, analysts advise against excessive enthusiasm. Previous negotiation rounds also ended with promises that were later unfulfilled. The key to success will be boss sides' ability to honor their commitments and show willingness for further concessions. The impact of this progress on the global economy is hard to overestimate. Reducing trade tensions could stimulate the growth of international trade, ease inflationary pressures, and bolster consumer confidence. However, risks remain, and the agreement's long-term outcome will depend on both countries' subsequent actions.
Today, we should pay attention to the speech by Philip Lane, a British Central Bank representative, as there are no macroeconomic releases from the the eurozone. Markets will closely monitor his rhetoric for hints regarding the central bank's plans on interest rates. Investors hope to hear more clarity from Lane about how the ECB intends to proceed with rates and whether the regulator plans further cuts this summer. Overall, Philip Lane's speech will be the key event of the day for financial markets. His comments may influence currency movements in the first half of the day. Investors are advised to watch his remarks closely and consider them in decision-making

GBPUSD ScalpAs we see, here we have strong and beautiful resistance level.
The price will go down and test previous levels. TP: 1.35659 (30-33pips).

GBPUSD Analysis Today: Technical and Order Flow !In this video I will be sharing my GBPUSD analysis today, by providing my complete technical and order flow analysis, so you can watch it to possibly improve your forex trading skillset. The video is structured in 3 parts, first I will be performing my complete technical analysis, then I will be moving to the COT data analysis, so how the big payers in market are moving their orders, and to do this I will be using my customized proprietary software and then I will be putting together these two different types of analysis.

gbpusd Weekly forcast of NJ pair
We can see bearish Bias on 4hr tf
Always wait for confirmation/strong setup for open a trade.
Thank you and Good Luck!
Happy trading.

Massive GBP/USD Reversal Ahead? Head & Shoulders FormationGBP/USD is at a critical technical juncture following a sharp bullish impulse that pushed the pair above the 1.34 handle, printing a strong weekly bullish engulfing candle and breaking out of a multi-week consolidation zone. This move unfolded in a macro context where the U.S. Dollar Index (DXY) is showing clear signs of weakness, with Non-Commercial net long positions dropping drastically—from around 20,000 to less than 5,000 contracts. This shift points to a fading speculative appetite for the dollar, historically a leading indicator of upcoming corrective phases or broader declines in the DXY.
On the flip side, the Commitments of Traders (COT) report on the British Pound reveals that Non-Commercials (typically hedge funds and asset managers) remain net long on GBP, with a slight increase week-over-week. However, Commercials (generally institutions and hedgers) have aggressively built up a significant net short position—levels that in the past preceded major reversals on the pair. This divergence between speculators and institutional hedgers suggests short-term bullish potential, but with rising risk of exhaustion near current resistance levels.
Adding fuel to this outlook is the retail sentiment: approximately 63% of retail traders are currently short GBP/USD, with an average entry price around 1.3021. This kind of retail crowd positioning, typically inefficient from a historical perspective, adds contrarian support for further upside, as long as price holds above the 1.3340 structure.
From a seasonality perspective, June tends to be a mildly bullish-to-sideways month for GBP/USD, especially when looking at the 10- and 15-year seasonal averages. While the seasonal bias is not particularly strong, there’s also no statistical downward pressure this time of year, leaving room for technically-driven moves influenced by liquidity and sentiment rather than macro patterns alone.
On the technical front, the daily chart shows a steep rally capped by a large green candle on Monday, breaking cleanly through the 1.34 resistance zone. The price is now hovering inside a key supply area between 1.3499 and 1.3550—a historically reactive zone that has triggered major rejections in previous months. How price reacts here will likely shape the next major swing. A confirmed breakout and consolidation above 1.3550 would open the door for an extension toward 1.37–1.3750. Conversely, a sharp rejection followed by a break below 1.3412—and especially under 1.3340—would set the stage for a deeper correction toward 1.3170.
The RSI is currently showing early signs of momentum loss, although no strong bearish divergence has emerged yet. This implies that the pair could still fuel another push higher before running out of steam—possibly forming the right shoulder of a head & shoulders pattern if the rejection scenario plays out.

GBP/USD - SMT with EUR/USD, SHORTExcited to share my first idea with you guys !
To start with, my name is Soulayman and have started my trading journey in October 2024. It was very hard at first, but after hard work and dedication we all know we can make it happen. I basically studied ICT concepts, and was able to integrate those into a system that I have built myself ( this is what every trader should do in my opinion, it will make you understand better ).
And that is why I am here today on Trading View, sharing my first ever idea with you guys !
I'll make it very simple , no extravagant analysis or super complicated trendlines all over the place ... =D
This is what I see :
1 - GBP/USD potentially forming a SMT with EUR/USD after sweeping London High located inside a fair value gap (which makes this play stronger)
2- After the sweep occurs, I will be waiting on a 5 MINUTE break of structure (since 1 min break outs are manipulation most of the times so i prefer to stay safe). If this is followed by a fair value gap, it reinforces our idea showing the market has intent to push price lower.
3 - Now , let's talk about the HIGH TIME FRAME structure (4H) clearly shows the price wants to sell and that it is targeting Sellside liquidity Equal Lows. We could than anticipate a reversal from there.
We currently have price pulling back towards the HTF FVG, failed to close above the most recent high and having bearish reaction.
Since everything aligns with our BIAS, we will let it play out and wait on the sweep !
I will be posting updates during the day =D
Stay tuned ! Talk to you guys soon !

GBPUSD:Sharing of the Latest Trading StrategyAll the trading signals today have resulted in profits!!! Check it!!!👉👉👉
Fundamental Analysis:
The UK-India Free Trade Agreement provides long-term bullish support for GBP.
The IMF raised the UK's 2025 growth forecast from 1.1% to 1.2%, boosting market confidence in the pound.
Global trade tensions indirectly underpin GBP.
Technical Analysis :
GBP is in a rebound uptrend. Short-term 5/10-day moving averages are converging, and Bollinger Bands show slight narrowing, indicating a neutral bias.
MACD death cross with shrinking red momentum (bearish).
RSI edges up near 65 with limited upside (neutral).
KD golden cross diverging upward from near oversold (bullish).
Trading Strategy:
Enter light longs at 1.3400 if supported.
buy@1.3400–1.3410
TP:1.3500-1.3550
Share accurate trading signals daily—transform your life starting now!
👇 👇 👇 Obtain signals👉👉👉

GBPUSD COT and Liquidity AnalysisHey what up traders welcome to the COT data and Liquidity report. It's always good to go with those who move the market here is what I see in their cards. I share my COT - order flow views every weekend.
🎯 Non Commercials added significant longs and closed shorts at the same time. So for that reason I see the highs as a liquidity for their longs profits taking.
📍Please be aware that institutions report data to the SEC on Tuesdays and data are reported on Fridays - so again we as retail traders have disadvantage, but there is possibility to read between the lines. Remember in the report is what they want you to see, that's why mostly price reverse on Wednesday after the report so their cards are hidden as long as possible. However if the trend is running you can read it and use for your advantage.
💊 Tip
if the level has confluence with the high volume on COT it can be strong support / Resistance.
👍 Hit like if you find this analysis helpful, and don't hesitate to comment with your opinions, charts or any questions.
Analysis done on the Tradenation Charts
Disclosure: I am part of Trade Nation's Influencer program and receive a monthly fee for using their TradingView charts in my analysis.
"Adapt what is useful, reject what is useless, and add what is specifically your own."
— David Perk aka Dave FX Hunter ⚔️

GBPUSD Trade IdeaSo basically why i am taking this trade is because Gu has been in a bearish trend for some days now and i got a nice break and retest zone right there that is backed up with the 4hours FVG

USDJPY recap + adding GBPUSD In watchlist Hello traders , here is the full multi time frame analysis for this pair, let me know in the comment section below if you have any questions , the entry will be taken only if all rules of the strategies will be satisfied. wait for more price action to develop before taking any position. I suggest you keep this pair on your watchlist and see if the rules of your strategy are satisfied.
🧠💡 Share your unique analysis, thoughts, and ideas in the comments section below. I'm excited to hear your perspective on this pair .
💭🔍 Don't hesitate to comment if you have any questions or queries regarding this analysis.
