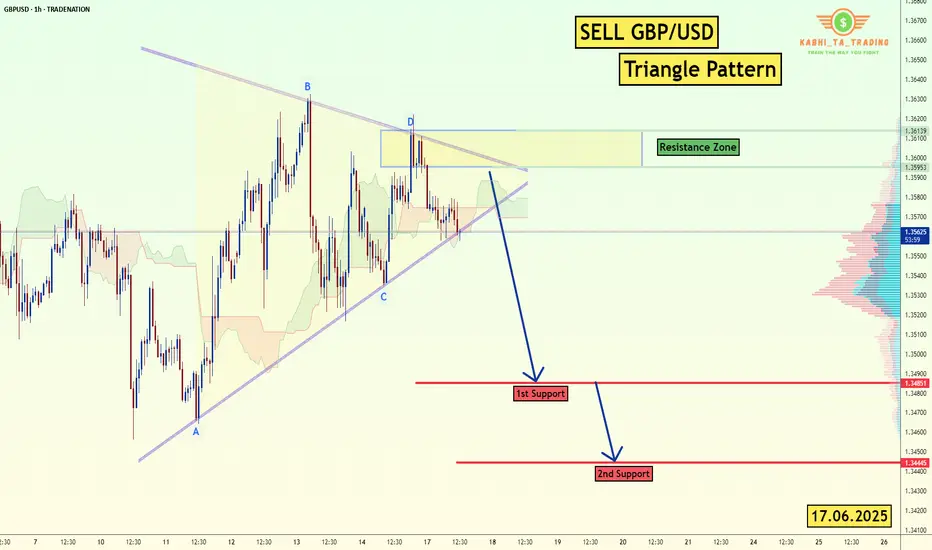
GBP/USD - H1-Triangle Breakout (17.06.2025)The GBP/USD Pair on the H1 timeframe presents a Potential Selling Opportunity due to a recent Formation of a Triangle Breakout Pattern. This suggests a shift in momentum towards the downside in the coming hours.
Possible Short Trade:
Entry: Consider Entering A Short Position around Trendline Of The Pattern.
Target Levels:
1st Support – 1.3485
2nd Support – 1.3444
🎁 Please hit the like button and
🎁 Leave a comment to support for My Post !
Your likes and comments are incredibly motivating and will encourage me to share more analysis with you.
Best Regards, KABHI_TA_TRADING
Thank you.
Disclosure: I am part of Trade Nation's Influencer program and receive a monthly fee for using their TradingView charts in my analysis.
GBPUSD trade ideas
GBP/USD - For FOMC & Fed Interest RateThe GBP/USD pair on the M30 timeframe presents a Potential Buying Opportunity due to a recent Formation of a Channel Pattern. This suggests a shift in momentum towards the upside and a higher likelihood of further advances in the coming hours.
Possible Long Trade:
Entry: Consider Entering A Long Position around Trendline Of The Pattern.
Target Levels:
1st Resistance – 1.3567
2nd Resistance – 1.3682
🎁 Please hit the like button and
🎁 Leave a comment to support for My Post !
Your likes and comments are incredibly motivating and will encourage me to share more analysis with you.
Best Regards, KABHI_TA_TRADING
Thank you.
Disclosure: I am part of Trade Nation's Influencer program and receive a monthly fee for using their TradingView charts in my analysis.

#GBPUSD: A strong bullish move incoming, comment your views The price has shown a possible price divergence, which could lead to a long-term move to 1.37. We expect the US dollar to weaken, which will likely push the price of GBPUSD to our target. Key economic data will be released later today and tomorrow, which could shape the price pattern.
Good luck and trade safely!
Team Setupsfx_

GBPUSD H1 compression BUY/HOLD TP1 +100 TP2 +200 pips low risk🏆 GBPUSD Market Update
📊 Technical Outlook
Short-term: BULLS active; resistance forming mid‑1.3600s, consolidation below 1.3600s
Mid-term: Neutral to slight bullish bias; bulls seek 1.3600–1.3700/1.3730 zone
Status: Narrow trading range (tight band) ahead of key UK CPI, Fed & BoE meetings
🔥 Latest Forex Updates
GBP/USD is consolidating in a narrow range around the mid‑1.3500s ahead of this week’s UK CPI and central bank meetings.
The pair holds defensive below 1.3600, with dovish BoE bets capping gains while the Fed is expected to stand pat.
GBP/USD sits near a 40‑month high (~1.3600), boosted by geopolitical risk tone, but lacking momentum to break much higher.
GBP/USD hit ~1.3600 after rebounding from 1.3515 amid renewed Middle East tensions and a weaker US dollar.
Live charts show a mild bullish tilt, awaiting central bank outcomes.
💡 Trade Recommendation
Buy GBPUSD at 1.3530 (recommended entry near 1.3530)
Take Profit at 1.3730 → +200 pips profit target
Stop Loss: 50 pips (around 1.3480)
This trade aligns with the current structure: shallow dip followed by rebound, positioning ahead of central bank catalysts. Momentum above resistance could propel GBP/USD toward 1.3730.
📌 Market Overview
Metric Details
Current Price ~1.3565–1.3600
24H Range 1.3515–1.3600
Central Event Risks UK CPI (Wed), US Retail Sales & Fed (Wed), BoE (Thu)
Geopolitical Middle East tension supports USD weakness, aiding GBP
📈 Forecast Highlights
Support Levels: ~1.3530 (100‑period SMA), ~1.3460, ~1.3425
Resistance Levels: 1.3600, 1.3630 static ceiling, followed by ~1.3700–1.3730 for bulls
🧭 Final Take
GBP/USD sits in a tight range, awaiting central bank clarity. The recommended long trade at 1.3530 aims to capitalize on upside momentum toward 1.3730, supported by technical confluence and a softer USD. Manage risk with a 50‑pip stop loss.

GBPUSD I Montly CLS I KL WOB I Model 1Hey, Market Warriors, here is another outlook on this instrument
If you’ve been following me, you already know every setup you see is built around a CLS Footprint, a Key Level, Liquidity and a specific execution model.
If you haven't followed me yet, start now.
My trading system is completely mechanical — designed to remove emotions, opinions, and impulsive decisions. No messy diagonal lines. No random drawings. Just clarity, structure, and execution.
🧩 What is CLS?
CLS is real smart money — the combined power of major investment banks and central banks moving over 6.5 trillion dollars a day. Understanding their operations is key to markets.
✅ Understanding the behavior of CLS allows you to position yourself with the giants during the market manipulations — leading to buying lows and selling highs - cleaner entries, clearer exits, and consistent profits.
📍 Model 1
is right after the manipulation of the CLS candle when CIOD occurs, and we are targeting 50% of the CLS range. H4 CLS ranges supported by HTF go straight to the opposing range.
"Adapt what is useful, reject what is useless, and add what is specifically your own."
— David Perk aka Dave FX Hunter ⚔️
👍 Hit like if you find this analysis helpful, and don't hesitate to comment with your opinions, charts or any questions.

GBPUSD may form a false break of supportGBPUSD has wasted the entire daily move (ATR) and is forming a false break of the mirror level support and trading range support. The price fell on the background of the dollar growth (which is trading on the background of the global downtrend)
Now, while the price is consolidating below the mirror level, sellers (physical persons) open deals. But, based on the situation and spent ATR when the price returns inside the range there will be a liquidation stage, which can provoke the price growth
The price fixing above 1.34437 may be the beginning of a pullback (trend growth).
Scenario: if the decline does not continue, and the price is able to consolidate above 1.3448, in this case we can expect a correction to 1.35, 1.353.

GBPUSD Will FOMC and BOE Drive the Next Move?GBPUSD Will FOMC and BOE Drive the Next Move?
GBPUSD completed a bearish harmonic pattern near the end of May, signaling downside potential.
Despite multiple attempts to decline, rising geopolitical tensions in the Middle East and the FED’s reluctance to cut rates have kept price movements in check.
The pair repeatedly tested the 1.3600 resistance zone, but finally moved down by nearly 160 pips yesterday.
With the FOMC Interest Rate decision today and BOE’s rate announcement tomorrow, the market could see a rebound ahead of FOMC for a larger correction, potentially setting up for a decline tomorrow.
While this remains an assumption for now, as long as the harmonic pattern remains valid, further downside remains a possibility.
You may find more details in the chart!
Thank you and Good Luck!
❤️PS: Please support with a like or comment if you find this analysis useful for your trading day❤️
Disclosure: I am part of Trade Nation's Influencer program and receive a monthly fee for using their TradingView charts in my analysis.

Technical + Fundamental Alignment: GBPUSD Short in PlayGBPUSD ( FX:GBPUSD ) is moving near the Resistance zone($1.354-$1,350) and has managed to break the Support line .
In terms of Elliott Wave theory , it seems that GBPUSD has completed the Zigzag Correction(ABC/5-3-5) , we can expect the next five bearish waves .
--------------------------------------------------------
Fundamental Analysis
1-Weak UK Economic Data:
Recent reports including Retail Sales, Industrial Output, and PMIs have come in below expectations.
Labour market is softening, and wage growth is decelerating.
2-Dovish Expectations for BoE:
With inflation cooling down, the Bank of England is expected to hold or even cut rates soon, reducing support for the pound.
3-Stronger USD Outlook
Despite some weaker U.S. data, the Fed maintains a hawkish stance. U.S. retail sales and inflation still support the dollar overall.
4-UK Political Risk
Upcoming UK elections on July 4 are adding uncertainty and downside risk to GBP.
--------------------------------------------------------
I expect GBPUSD to attack at least the Support lines based on the above explanation.
Targets: 1.3
1)1.3353 USD =>Risk-To-Reward: 1.51
2)1.3315 USD =>Risk-To-Reward: 2.00
Note: Stop Loss(SL): 1.3549 USD
Please respect each other's ideas and express them politely if you agree or disagree.
British Pound / U.S Dollar Analyze (GBPUSD), 1-hour time frame.
Be sure to follow the updated ideas.
Do not forget to put a Stop loss for your positions (For every position you want to open).
Please follow your strategy and updates; this is just my Idea, and I will gladly see your ideas in this post.
Please do not forget the ✅' like '✅ button 🙏😊 & Share it with your friends; thanks, and Trade safe.

GBPUSD Analysis Today: Technical and Order Flow !In this video I will be sharing my GBPUSD analysis today, by providing my complete technical and order flow analysis, so you can watch it to possibly improve your forex trading skillset. The video is structured in 3 parts, first I will be performing my complete technical analysis, then I will be moving to the COT data analysis, so how the big payers in market are moving their orders, and to do this I will be using my customized proprietary software and then I will be putting together these two different types of analysis.

GBPUSD OVERVIEWPrice is currently coming from supply zones and looking for sells this coming week.On this chart i show zones that were left unmitigated expecting a bearish orderflow

Potential GBP/USD Short Trade from Double Top ResistanceThis GBP/USD chart displays a bearish setup following a double top pattern near the upper trendline of an ascending channel. Price failed to break above resistance and has begun reversing, indicating potential downside momentum. The Ichimoku Cloud shows weakening bullish pressure as price starts to dip below the cloud. Key support levels have been highlighted where price may react. A break below the lower boundary of the channel and the cloud could confirm a bearish continuation. Volume and structure suggest sellers gaining control, making this setup favourable for a short position based on technical confluence and potential trend reversal.
Entry: 1.35850
Target 1: 1.35460
Target 2: 1.35030
If you found this analysis helpful, don’t forget to drop a like and comment. Your support keeps quality ideas flowing—let’s grow and win together! 💪📈

Lingrid | GBPUSD potential Long from the Support ZoneThe price perfectly fulfilled my previous idea . FX:GBPUSD SPREADEX:GBP has bounced off confluence support near 1.3395 where the upward trendline and horizontal structure intersect. A minor range formed after the recent corrective drop, hinting at possible accumulation. A breakout above the range and reclaiming 1.3450 would shift momentum back toward the 1.3537 resistance.
📈 Key Levels
Buy zone: 1.3390–1.3410
Sell trigger: breakdown below 1.3390
Target: 1.35375
Buy trigger: bullish breakout from current consolidation
💡 Risks
Failure to hold above the rising trendline could shift the trend short-term bearish
GBP remains sensitive to macroeconomic news—any surprises could disrupt this setup
Range failure and low volume may delay the expected move upward
Traders, if you liked this idea or if you have your own opinion about it, write in the comments. I will be glad 👩💻

GBP/USD 3H CHART PATTERN.GBP/USD on the 3-hour timeframe, here’s the analysis and potential target zones derived from the chart:
📉 Current Trend:
The market has broken down from an ascending channel.
Price retested the support-turned-resistance zone around 1.35060, confirming bearish momentum.
Ichimoku Cloud is above price — supporting bearish bias.
---
🎯 Targets Based on the Chart:
1. First Target (1st Support Zone):
Level: Approximately 1.33449
This is your first major support zone marked on the chart — expect a possible reaction or consolidation here.
2. Second Target (2nd Support Zone):
Level: Approximately 1.32800
This is the second support zone — if price breaks below 1.33449, this becomes the next logical bearish target.
---
🔍 Summary:
Sell below: 1.3450
Target 1: 1.3345
Target 2: 1.3280
Stop-loss suggestion: Above the resistance zone ~1.3506
Let me know if you want SL/TP values based on pips, risk %, or a strategy adjustment.

GBPUSD Making Its Prices HighGBP/USD now faces some renewed selling orders and slips back to the 1.3600 zone on Monday. Cable's decent gains come on the heels of rising pessimism about the US Dollar and encouraging geopolitical news.

GBPUSD is in the Selling DirectionHello Traders
In This Chart GBPUSD HOURLY Forex Forecast By FOREX PLANET
today GBPUSD analysis 👆
🟢This Chart includes_ (GBPUSD market update)
🟢What is The Next Opportunity on GBPUSD Market
🟢how to Enter to the Valid Entry With Assurance Profit
This CHART is For Trader's that Want to Improve Their Technical Analysis Skills and Their Trading By Understanding How To Analyze The Market Using Multiple Timeframes and Understanding The Bigger Picture on the Charts

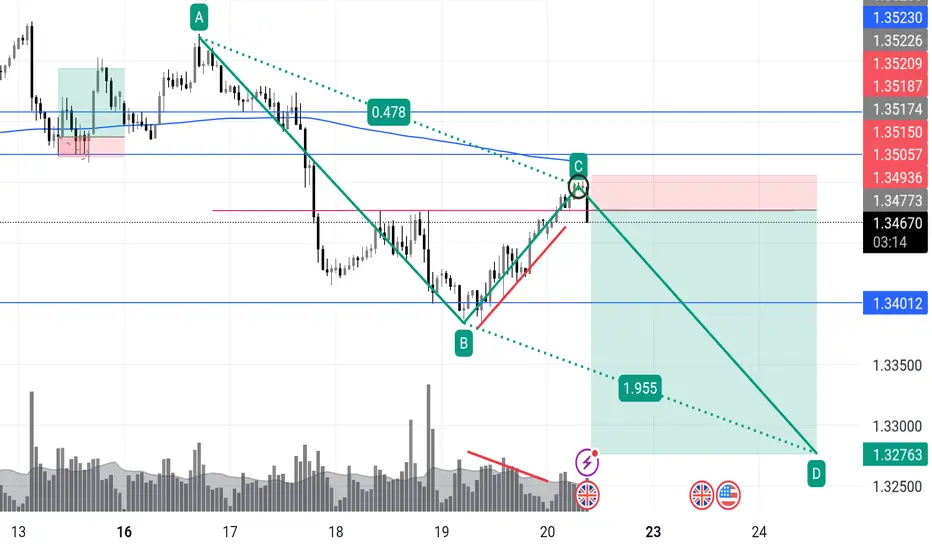
GBPUSD short!Classic Wyckoff upthrust, this is A+
We’ve got a clear AB=CD completion at C, tagging previous support-turned-resistance, while the volume on the climb is drying up (classic clue of passive buyers getting trapped). The channel top + Fibonacci confluence + previous swing zone adds weight.
🔻 Trade Idea:
Entry: 1.3477
Stop: 1.3521 (above wick highs and structure)
Target 1: 1.3401 (break structure)
Target 2: 1.3276 (full measured move / spring's origin)
Risk-Reward: ~3.5R
Volume divergence confirms exhaustion.
Ideal reaction would break through mid-line and sustain under 1.3401.
🔍 Watch For:
Bearish engulfing confirmation on 1h
Volume spike during breakdown = smart money selling
If price lingers above 1.3515, trap invalid

GBPUSD ScalpAs we see, here we have strong and beautiful resistance level.
The price will go down and test previous levels. TP: 1.35659 (30-33pips).

AUDUSD and GBPUSD Analysis todayHello traders, this is a complete multiple timeframe analysis of this pair. We see could find significant trading opportunities as per analysis upon price action confirmation we may take this trade. Smash the like button if you find value in this analysis and drop a comment if you have any questions or let me know which pair to cover in my next analysis.

GBPUSD Analysis Today: Technical and Order Flow !In this video I will be sharing my GBPUSD analysis today, by providing my complete technical and order flow analysis, so you can watch it to possibly improve your forex trading skillset. The video is structured in 3 parts, first I will be performing my complete technical analysis, then I will be moving to the COT data analysis, so how the big payers in market are moving their orders, and to do this I will be using my customized proprietary software and then I will be putting together these two different types of analysis.

GBP/USD - SMT with EUR/USD, SHORTExcited to share my first idea with you guys !
To start with, my name is Soulayman and have started my trading journey in October 2024. It was very hard at first, but after hard work and dedication we all know we can make it happen. I basically studied ICT concepts, and was able to integrate those into a system that I have built myself ( this is what every trader should do in my opinion, it will make you understand better ).
And that is why I am here today on Trading View, sharing my first ever idea with you guys !
I'll make it very simple , no extravagant analysis or super complicated trendlines all over the place ... =D
This is what I see :
1 - GBP/USD potentially forming a SMT with EUR/USD after sweeping London High located inside a fair value gap (which makes this play stronger)
2- After the sweep occurs, I will be waiting on a 5 MINUTE break of structure (since 1 min break outs are manipulation most of the times so i prefer to stay safe). If this is followed by a fair value gap, it reinforces our idea showing the market has intent to push price lower.
3 - Now , let's talk about the HIGH TIME FRAME structure (4H) clearly shows the price wants to sell and that it is targeting Sellside liquidity Equal Lows. We could than anticipate a reversal from there.
We currently have price pulling back towards the HTF FVG, failed to close above the most recent high and having bearish reaction.
Since everything aligns with our BIAS, we will let it play out and wait on the sweep !
I will be posting updates during the day =D
Stay tuned ! Talk to you guys soon !

GBPUSD:Sharing of the Latest Trading StrategyAll the trading signals today have resulted in profits!!! Check it!!!👉👉👉
Fundamental Analysis:
The UK-India Free Trade Agreement provides long-term bullish support for GBP.
The IMF raised the UK's 2025 growth forecast from 1.1% to 1.2%, boosting market confidence in the pound.
Global trade tensions indirectly underpin GBP.
Technical Analysis :
GBP is in a rebound uptrend. Short-term 5/10-day moving averages are converging, and Bollinger Bands show slight narrowing, indicating a neutral bias.
MACD death cross with shrinking red momentum (bearish).
RSI edges up near 65 with limited upside (neutral).
KD golden cross diverging upward from near oversold (bullish).
Trading Strategy:
Enter light longs at 1.3400 if supported.
buy@1.3400–1.3410
TP:1.3500-1.3550
Share accurate trading signals daily—transform your life starting now!
👇 👇 👇 Obtain signals👉👉👉

GBP/USD Trade idea for the week. Price seems bullish, but it has to retest the previous low and then continue above. To continue the trend. if it breaks below and does not show a bullish engulfing candle, then this trade idea is null.
