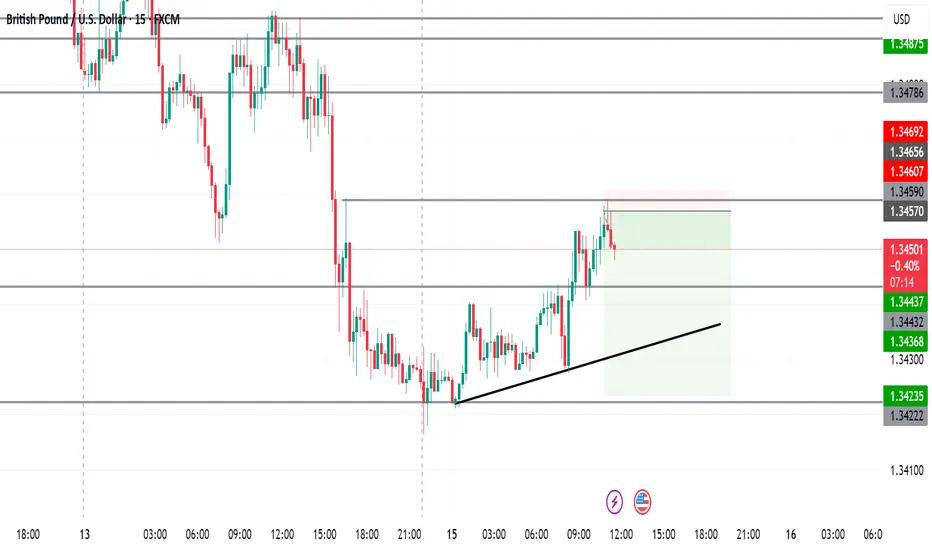
GBPUSD I Weekly CLS to be completed I Target Key LevelYo Market Warriors ⚔️
GBPUSD is going to complete WCLS, in to the key level. In COT data we see shorts being added which is taking net positions down. Intraday shorts model 0 are possible, Its early to long.
if you’ve been riding with me, you already know:
🎯My system is 100% mechanical. No emotions. No trend lines. No subjective guessing. Just precision, structure, and sniper entries.
🧠 What’s CLS?
It’s the real smart money. The invisible hand behind $7T/day — banks, algos, central players.
📍Model 1:
HTF bias based on the daily and weekly candles closes,
Wait for CLS candle to be created and manipulated. Switch to correct LTF and spot CIOD. Enter and target 50% of the CLS candle.
For high probability include Dealing Ranges, Weekly Profiles and CLS Timing.
Analysis done on the Tradenation Charts
Disclosure: I am part of Trade Nation's Influencer program and receive a monthly fee for using their TradingView charts in my analysis.
Trading is like a sport. If you consistently practice you can learn it.
“Adapt what is useful. Reject whats useless and add whats is specifically yours.”
David Perk aka Dave FX Hunter
💬 Don't hesitate to ask any questions or share your opinions
GBPUSD trade ideas

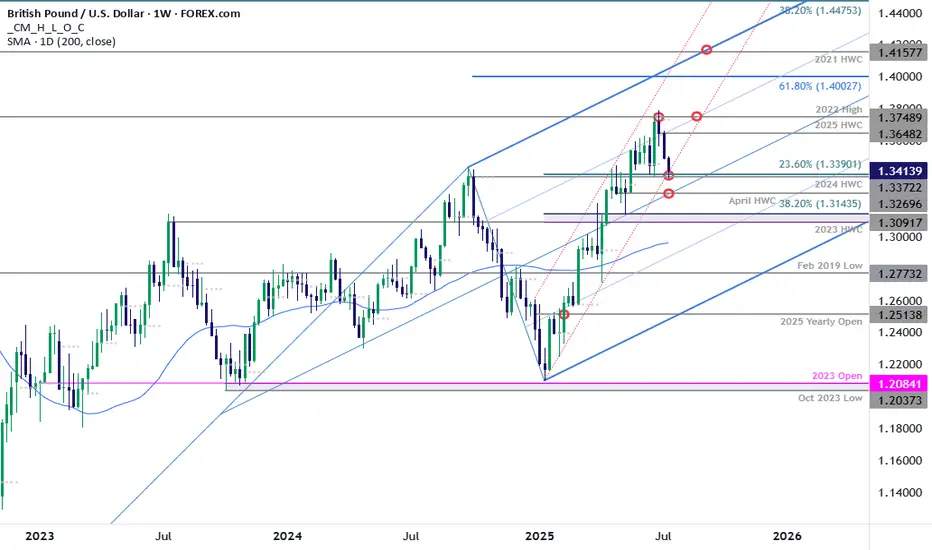
GBP/USD Plunges to Make-or-Break SupportSterling is poised to mark a third consecutive weekly decline after turning from resistance at multi-year highs. The decline takes price into critical support at the yearly trendline- this is a make-or-break level for the bulls.
GBP/USD is testing confluent support today at 1.3372/90- a region defined by the 2024 high-week close (HWC) and the 23.6% retracement of the yearly range. Looking for a reaction off this mark with a weekly close below the April HWC / median-line at 1.3270 ultimately needed to suggest a more significant high is in place / invalidate the yearly uptrend. Subsequent support rests with the 2023 HWC / 38.2% retracement at 1.3091-1.3143 and the 52-week moving average, currently near ~1.2980.
Weekly resistance now eyed at the yearly high-week reversal close at 1.3648 with a breach / close above the 2022 high at 1.3749 still needed to mark resumption of the broader Sterling up trend. Subsequent resistance objectives eyed at the 61.8% extension of the 2022 advance at 1.4003 and the 2021 HWC at 1.4158.
Bottom line: Sterling is attempting to break below the yearly uptrend and the focus is on the weekly close with respect to 1.3372/90- risk for price inflection here. From a trading standpoint, a good zone to reduce portions of short-exposure / lower protective stops- rallies should be limited to 1.3648 IF price is heading lower on this stretch with a close below 1.3270 needed to suggest a reversal is underway.
-MB
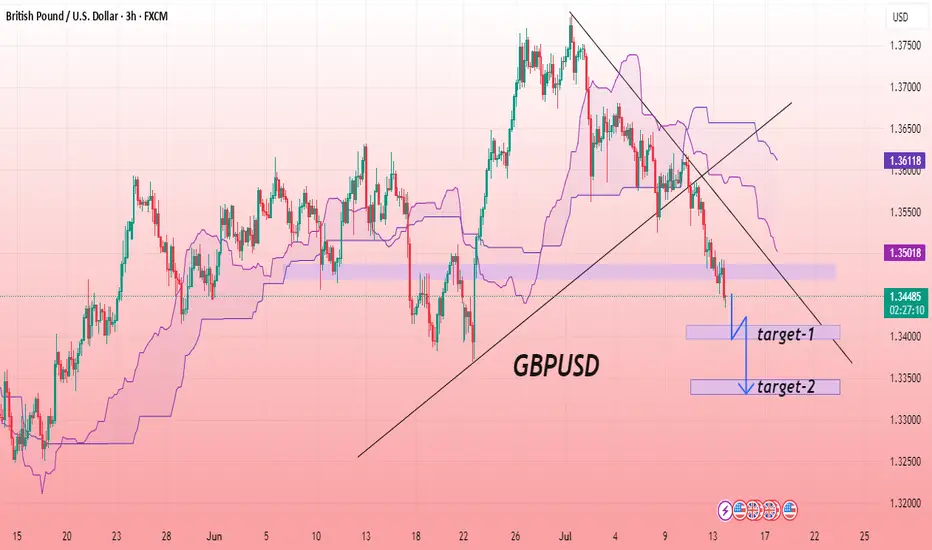
GBP/USD BEARISH SETUPThe chart shows the GBP/USD currency pair on a 3-hour timeframe, indicating a bearish trend. Price action has broken below the trendline support and is trading beneath the Ichimoku cloud, suggesting downward momentum. A key support zone has been breached, and the price is currently retesting this zone as resistance. The overall structure suggests a continuation to the downside. The chart highlights a descending channel and marks two projected levels as potential targets. The analysis aligns with bearish sentiment, reinforced by consistent lower highs and lower lows. Traders may consider further confirmation before initiating positions based on trend continuation setups.
Entry: 1.34500
Target First: 1.33960
Target Second: 1.33313
Stop Loss: 1.35000
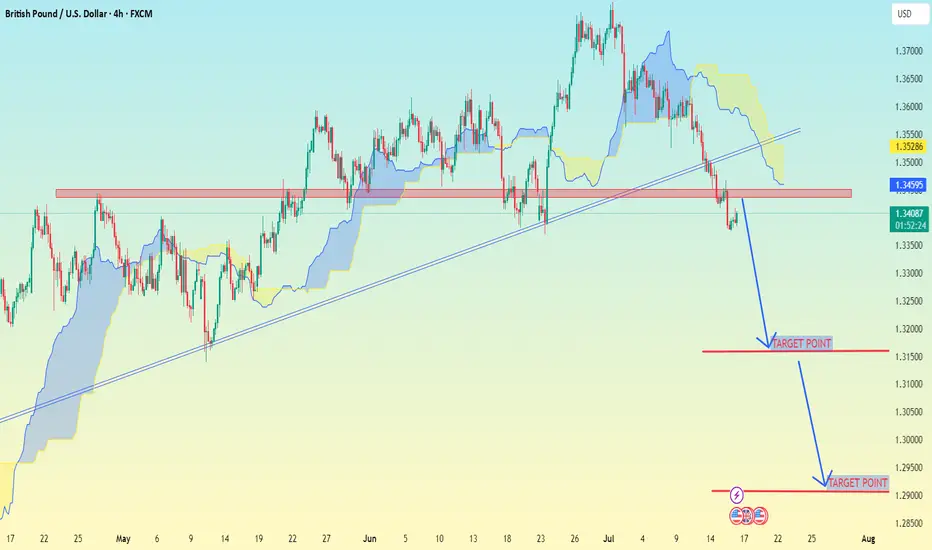
GBP/USD (4H time frame).GBP/USD (4H time frame)
---
📉 GBP/USD Trade Setup – 4H Analysis
Price has broken below a key trendline and horizontal support zone. Current structure shows bearish momentum with clean downside targets.
---
🔻 Sell Opportunity
Entry: 1.34000 (below broken support retest)
Target 1: 1.32000
Target 2: 1.29000
Stop Loss: 1.35200 (above resistance zone and cloud)
---
📌 Analysis Notes:
Price is trading below both the trendline and Ichimoku cloud – strong bearish confirmation.
Retest of broken support/resistance zone has already occurred.
#GBPUSD:We dropped a bit further down than we expected! GBPUSD dropped further down our area, currently dropping as well. This happened as DXY started gaining strength and becoming bullish. We believe this is temporary and the price will soon start dropping. Due to this, we have bought a position at an area where we think the price is likely to reverse. Please do your own analysis and use this as a secondary bias only.
Team Setupsfx_
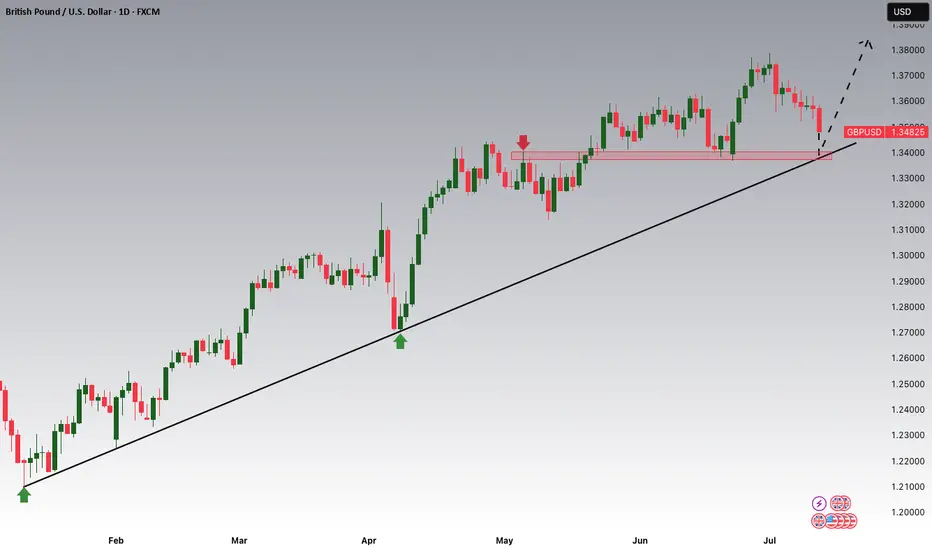
GBPUSD: A Bearish Outlook on the Daily ChartGBPUSD: A Bearish Outlook on the Daily Chart
On the daily chart, GBPUSD looks like it is preparing to start a downtrend.
I don’t expect GBPUSD to fall that easily. It is likely to wait for the FOMC meeting at the end of the month before starting a bearish wave.
At this point, GBPUSD could be in a correction before taking a turn.
Key target areas: 1.3190; 1.3000 and 1.2750
You may find more details in the chart!
Thank you and Good Luck!
PS: Please support with a like or comment if you find this analysis useful for your trading day
Disclosure: I am part of Trade Nation's Influencer program and receive a monthly fee for using their TradingView charts in my analysis.

Lingrid | GBPUSD buying Opportunity from the Demand ZoneFX:GBPUSD is rebounding from the 1.3390 support level after completing a triangle breakdown and retesting the lower support zone. A potential double-bottom pattern is forming near the key support area, signaling a short-term bullish reversal. If bulls reclaim the descending blue trendline, momentum could drive price back toward the 1.3550 resistance level. This retracement would mark a corrective phase within the larger structure, offering an upside opportunity.
📉 Key Levels
Buy trigger: bullish rejection from 1.3390 with recovery above 1.3440
Buy zone: 1.3390–1.3440 (demand and bounce structure)
Target: 1.3550
Invalidation: 4H candle close below 1.3390 support breaks bullish setup
💡 Risks
Failure to break above trendline could result in further consolidation
Macroeconomic news may override technical rebound
Downtrend pressure remains unless higher lows are confirmed
If this idea resonates with you or you have your own opinion, traders, hit the comments. I’m excited to read your thoughts!

GBPUSD → Hunting for liquidity before the fallFX:GBPUSD is forming a countertrend correction towards the liquidity zone amid a correction in the dollar. Are there any chances for a trend break?
The currency pair is taking advantage of the opportunity to test the trend resistance and consolidation amid the dollar correction. Focus on the nearest resistance level of 1.3467, behind which lies a pool of liquidity relative to the local trend.
Based on the overall market sentiment (bearish), a breakout of the 1.3467 resistance could trigger a downward pullback.
Resistance levels: 1.3467
Support levels: 1.3370
If, during the retest of the specified liquidity zone, the market is unable to continue its upward movement and the price returns below the level, we will have a chance to catch a decline within the current trend.
Best regards, R. Linda!

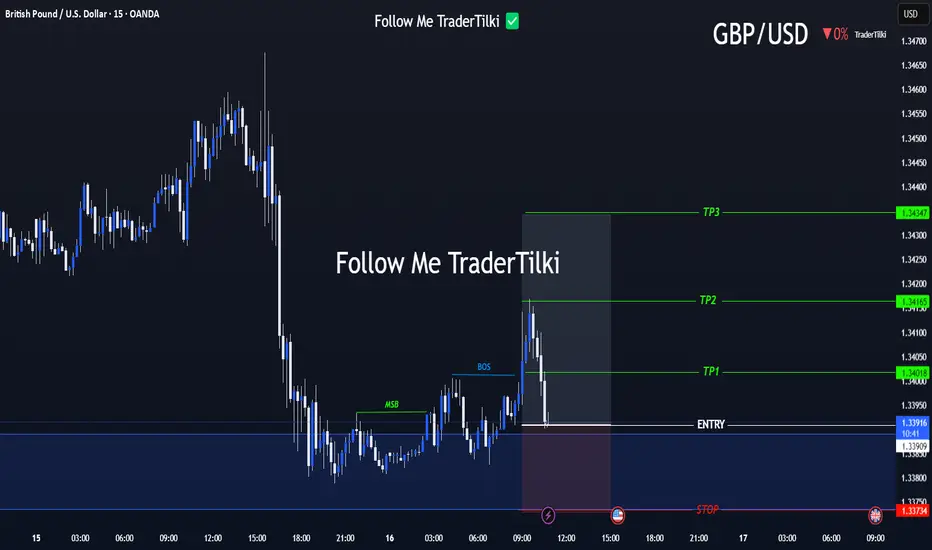
Strategic Entry, Clear Targets: The GBPUSD Game Plan Is Set📢 Hello Guys,
I've prepared a fresh GBPUSD signal for you:
🟢 Entry Level: 1.33918
🔴 Stop Loss: 1.33734
🎯 TP1: 1.34018
🎯 TP2: 1.34165
🎯 TP3: 1.34347
📈 Risk/Reward Ratio: 2,40
------
Your likes and support are what keep me motivated to share these analyses consistently.
Huge thanks to everyone who shows love and appreciation! 🙏
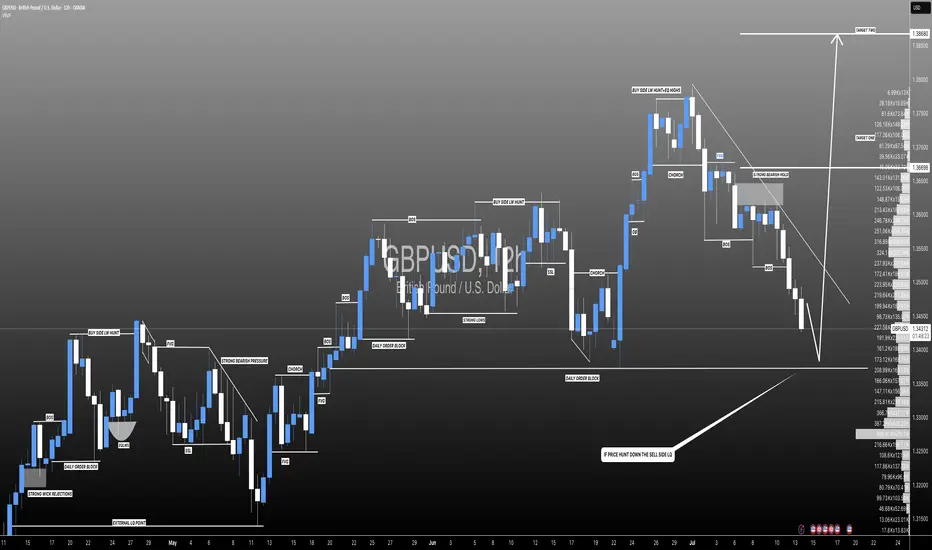
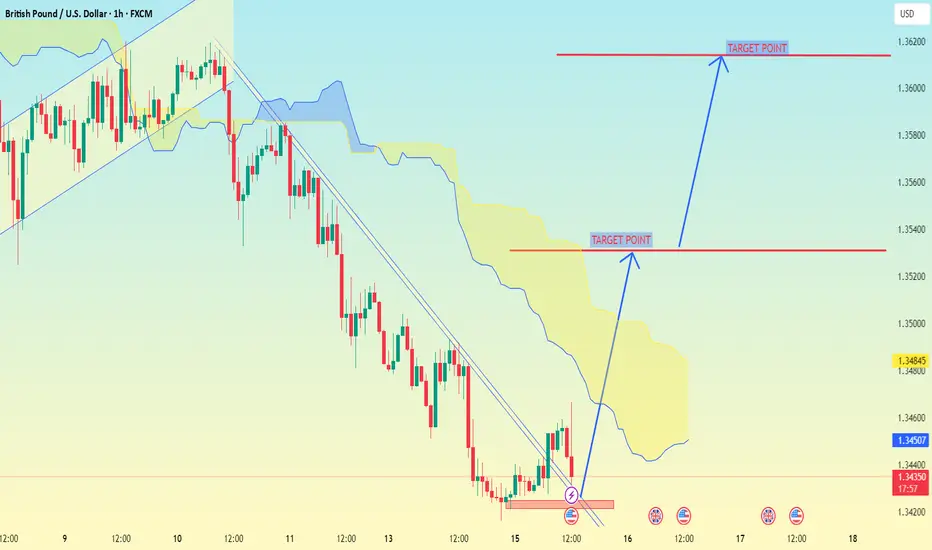
GBP/USD on the 1-hour timeframeGBP/USD on the 1-hour timeframe, here’s a breakdown of the target points indicated:
---
📍 Target Points (as marked on the chart):
1. First Target Point: Around 1.35200
2. Second Target Point: Around 1.36200
---
🧠 Analysis Notes (based on My setup):
Im used Ichimoku Cloud and a trendline breakout, which suggests a bullish reversal.
The price has broken out above a descending trendline and is possibly targeting the top of the cloud and further if momentum sustains.
The two target points represent:
First resistance level (likely top of the Ichimoku cloud).
Second resistance level (recent high before the downtrend began).
---
📌 Summary:
Immediate target: 1.35200
Next potential target: 1.36200
Let me know if you want stop-loss suggestions or a risk-reward analysis.
GBPUSD I Its ready for the deeper pullback - COT OverviewHey what up traders welcome to the COT data and Liquidity report. It's always good to go with those who move the market here is what I see in their cards. I share my COT - order flow views every weekend.
🎯 Non Commercials added significant longs and closed shorts at the same time. So for that reason I see the highs as a liquidity for their longs profits taking.
📍Please be aware that institutions report data to the SEC on Tuesdays and data are reported on Fridays - so again we as retail traders have disadvantage, but there is possibility to read between the lines. Remember in the report is what they want you to see, that's why mostly price reverse on Wednesday after the report so their cards are hidden as long as possible. However if the trend is running you can read it and use for your advantage.
💊 Tip
if the level has confluence with the high volume on COT it can be strong support / Resistance.
👍 Hit like if you find this analysis helpful, and don't hesitate to comment with your opinions, charts or any questions.
Analysis done on the Tradenation Charts
Disclosure: I am part of Trade Nation's Influencer program and receive a monthly fee for using their TradingView charts in my analysis.
"Adapt what is useful, reject what is useless, and add what is specifically your own."
— David Perk aka Dave FX Hunter ⚔️

GBPUSD Potential UpsidesHey Traders, in today's trading session we are monitoring GBPUSD for a buying opportunity around 1.33900 zone, GBPUSD is trading in an uptrend and currently is in a correction phase in which it is approaching the trend at 1.33900 support and resistance area.
Trade safe, Joe.

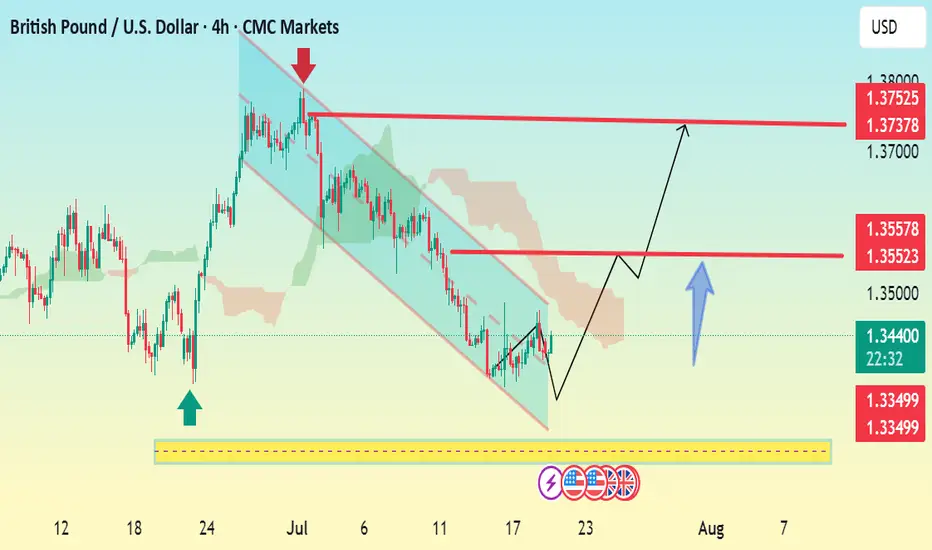
GBP/USD 4H Bullish Reversal Setup Analysis:The chart shows GBP/USD breaking out of a descending channel, signaling a potential bullish reversal.
Price has bounced from a strong support zone (highlighted in yellow), with bullish momentum building.
The breakout is backed by a higher low structure, which often precedes an uptrend continuation.
Key Levels:
Support: 1.3349
First Resistance / TP1: 1.3552–1.3557
Final Target / TP2: 1.3737–1.3752
Outlook:
If price holds above 1.3439 and breaks 1.3552 with volume, the next leg toward 1.3750 is likely.
Watch for retests of the breakout level for confirmation before entering long.
📈 Bias: Bullish above 1.3439
🕐 Timeframe: 4H chart
Let me know if you want SL (stop loss) and entry suggestions too.
GBPUSD Trading The Gap # Revised GBP/USD London Session Bullish Setup
---
Market Context
- Price gapped up into the **breaker zone at 1.34160–1.34190, now acting as support.
- The Asian session rallied into the 0.25 **quadrant of the 4-hour wick** (not the daily range) before stalling and retracing.
- A buy-side imbalance (sell-side inefficiency) sits beneath that breaker, meaning liquidity is resting below the zone.
These factors set the stage for a **bullish reaction** once London session liquidity arrives.
-Trade Plan
1. Timeframes
- Entry: 15-minute chart
- Bias and structure: 1-hour and 4-hour charts
2. Reference Levels
- Breaker/imbalance zone: 1.34160–1.34190
- 4-hour wick high: ~1.34400
- Psychological level: 1.34500
3. Entry
- Wait for a pullback into 1.34180–1.34190.
- Confirm with a bullish price-action signal
4. Stop Loss
- Below the low of the imbalance zone.
5. Profit Targets
- T1: 4-hour wick high / Asian high at 1.34400
- T2: Psychological level at 1.34500
Execution Checklist
- Ensure London open shows bullish momentum (first 15-min close above zone).
- Check correlation: weak USD (DXY down) or EUR/USD strength adds confidence.
Ongoing Management
- Move stop to breakeven once T1 is hit.
- Scale out 25% at T1, let the remainder run to T2.
- If price closes below 1.34160 on a 15-minute chart, exit early to protect capital.

22.07.25 Morning ForecastPairs on Watch -
FX:GBPJPY
FX:AUDUSD
OANDA:XAUUSD
FX:GBPUSD
A short overview of the instruments I am looking at for today, multi-timeframe analysis down to what I will be looking at for an entry. Enjoy!

GBPUSD is Nearing the Daily Trend!!!Hey Traders, in tomorrow's trading session we are monitoring GBPUSD for a buying opportunity around 1.34100 zone, GBPUSD is trading in an uptrend and currently is in a correction phase in which it is approaching the trend at 1.34100 support and resistance area.
Trade safe, Joe.
GBPUSD Pauses After Hitting First Target Amid USD-Driven TurbuleGBPUSD Pauses After Hitting First Target Amid USD-Driven Turbulence
Following our previous analysis, GBPUSD reached its first downside target and is currently experiencing a brief pause.
The U.S. has begun sending letters to multiple trading partners, stirring market uncertainty. This diplomatic disruption is strengthening the USD, giving it a tactical edge.
Should GBPUSD correct back toward 1.3600, there's potential for renewed downside movement in the coming days—particularly if market clarity improves.
🎯 Next key targets:
1.3435
1.3330
You may find more details in the chart!
Thank you and Good Luck!
PS: Please support with a like or comment if you find this analysis useful for your trading day
Disclosure: I am part of Trade Nation's Influencer program and receive a monthly fee for using their TradingView charts in my analysis.

GBPUSD h4 big downhe resistance at 1.36554 may be weak due to:
Multiple taps already
Reduced seller interest
A breakout above this zone could trigger short covering → sharp rally
✅ 2. Higher Low Structure
Recent low at 1.35475 held strong
Current consolidation appears like a bullish flag or accumulation range
Could indicate continuation, not rejection
GBPUSD SELL IDEA Fakeout Reversal Setup
If price dips into the support at 1.35475 again, it might:
Trap breakout traders
Reverse and form a new impulse leg upward
Target = 1.3700–1.3750 zone
Disruption Path: Bullish Breakout
Minor dip or tight range around current price
Break and hold above 1.3655
Acceleration toward 1.3700–1.3750
Disruption Invalidation
A strong close below 1.3540 with volume

GBPUSD London PlayWhat I see and what I am in, already 1:3RR and will keep an eye for news in 2 hours as well as the lower levels marked
GBPUSD → Correction amid a global bullish trend...FX:GBPUSD is testing the 1.345 - 1.35 area as part of a correction. The price is closing the imbalance zone and testing support, which may trigger a reaction. Further developments will largely depend on the dollar, which is testing resistance.
The daily market structure is quite strong. The correction against the backdrop of a strong trend is within acceptable limits, and bulls should fight to keep the price away from risk zones. GBPUSD, as part of the correction, closes the imbalance zone of 1.34 - 1.35 (0.7 - 0.79f) and forms a false breakdown of the intermediate support level of 1.3476. If buyers hold their ground in the 1.347-1.35 zone, the currency pair will be able to return to the global trend.
Support levels: 1.3476, 1.345, 1.3382
Resistance levels: 1.3511, 1.359, 1.375
Price consolidation above 1.349 - 1.350 will confirm the market's intentions. In this case, we can expect growth to 1.36 - 1.374.
Best regards, R. Linda!

Sell idea!Hello all. price enter a very special but difficult to recognize level and it can push the price lower. be happy. put your SL a little above my level. it is so tight.(wink)

GBP/USD UPTRENDHave price back on support with the overall trend still bullish. On H1 we have a classic QM setup with price coming back to reclaim a block that it once violated. Price has potential to go up if the support level holds

UK employment,wage growth falls, US retail sales shineThe British pound showing limited movement on Thursday. In the North American session, GBP/USD is trading at 1.3406, down 0.09% on the day.
Today's UK employment report pointed to a cooling in the UK labor market. The number of employees on company payrolls dropped by 41 thousand in June after a decline of 25 thousand in May. Still, the May decline was downwardly revised from 109 thousand, easing concerns of a significant deterioration in the labor market.
Wage growth (excluding bonuses) dropped to 5.0% from a revised 5.3%, above the market estimate of 4.9%. The unemployment rate ticked up to 4.7%, up from 4.6% and above the market estimate of 4.6%. This is the highest jobless level since the three months to July 2021.
The latest job data will ease the pressure on the Bank of England to lower rates, as the sharp revision to the May payroll employees means the labor market has not deteriorated as much as had been feared. Still, the employment picture remains weak and the markets are expecting an August rate cut, even though UK inflation was hotter than expected in June.
US retail sales bounced back in June after back-to-back declines. Consumers reacted with a thumbs-down to President Trump's tariffs, which took effect in April and made imported goods more expensive.
The markets had anticipated a marginal gain of just 0.1% m/m in June but retail sales came in at an impressive 0.6%, with most sub-categories recording stronger activity in June. This follows a sharp 0.9% decline in May.
The US tariffs seem to have had a significant impact on retail sales, as consumers continue to time their purchases to minimize the effect of tariffs.
Consumers increased spending before the tariffs took effect and cut back once the tariffs were in place. With a truce in place between the US and China which has slashed tariff rates, consumers have opened their wallets and are spending more on big-ticket items such as motor vehicles, which jumped 1.2% in June.
