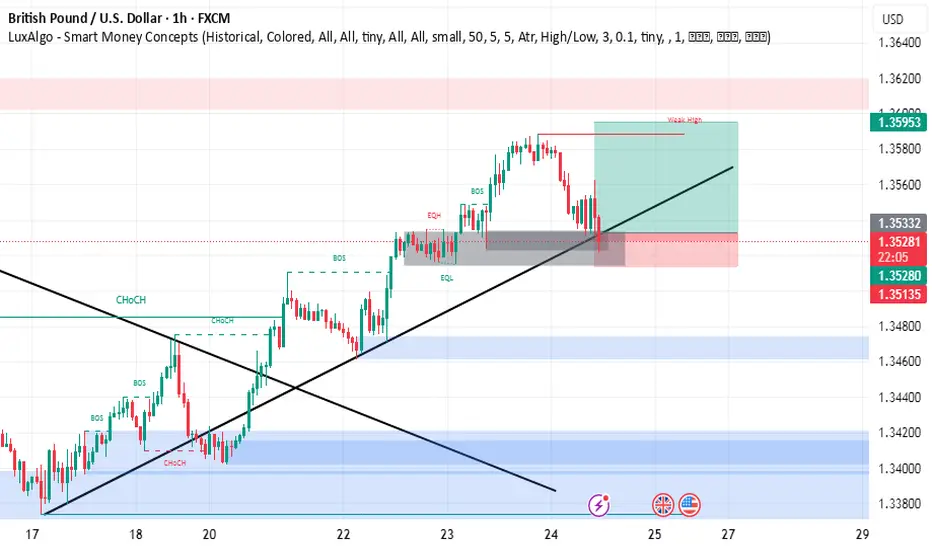
GBPUSD ENTRY CHARTOn this Pair, We are bullish, as the Dollar is still weak and the POUNDS DOLLAR is still in an UPTREND, on the HTF and the MID-TERM-TF, also on the Hourly, we got a Zone with additional confluences that are in align with the Trend, then on our Entry TF, We got a Sweep of LIQ, BOS and IND close to our POI, so we are IN, and if this matches with your TRADE IDEA, i advise you add a good risk management to manage your Trade, THANK YOU.
GBPUSD trade ideas

GBPUSD Support & Resistance Levels🚀 Here are some key zones I've identified on the H1/M15/M5 timeframe.
These zones are based on real-time data analysis performed by a custom software I personally developed.
The tool is designed to scan the market continuously and highlight potential areas of interest based on price action behavior and volume dynamics.
Your feedback is welcome!

GBPUSD → Hunting for liquidity before the fallFX:GBPUSD is forming a countertrend correction towards the liquidity zone amid a correction in the dollar. Are there any chances for a trend break?
The currency pair is taking advantage of the opportunity to test the trend resistance and consolidation amid the dollar correction. Focus on the nearest resistance level of 1.3467, behind which lies a pool of liquidity relative to the local trend.
Based on the overall market sentiment (bearish), a breakout of the 1.3467 resistance could trigger a downward pullback.
Resistance levels: 1.3467
Support levels: 1.3370
If, during the retest of the specified liquidity zone, the market is unable to continue its upward movement and the price returns below the level, we will have a chance to catch a decline within the current trend.
Best regards, R. Linda!

GBPUSD Rebounds Strongly – Is the Uptrend Ready to Resume?Hello traders!
On the D1 chart, GBPUSD is showing a strong recovery after bouncing off the support zone around 1.33500–1.34500. This rebound happened right at the ascending trendline and the confluence with the EMA, reinforcing the strength of the bullish zone.
The overall bullish structure remains intact. As long as price stays above the trendline, I expect GBPUSD to continue its move toward the resistance area near the recent highs.
My strategy is to look for buying opportunities around the support zone or after a confirmation signal from price action following a minor pullback.
Good luck and happy trading!

GBPUSD buy setupsimply
this is 6 deals after 5 CONSECUTIVE WINNING traders
we have demand
uptrend
the price can't make lower low
and make more candle in the area with more rejection
so the price will go up
be careful on your risk money management
BEST WISHES
24.07.25 Morning ForecastPairs on Watch -
FX:GBPCAD
FX:GBPUSD
FX:AUDNZD
A short overview of the instruments I am looking at for today, multi-timeframe analysis down to what I will be looking at for an entry. Enjoy!


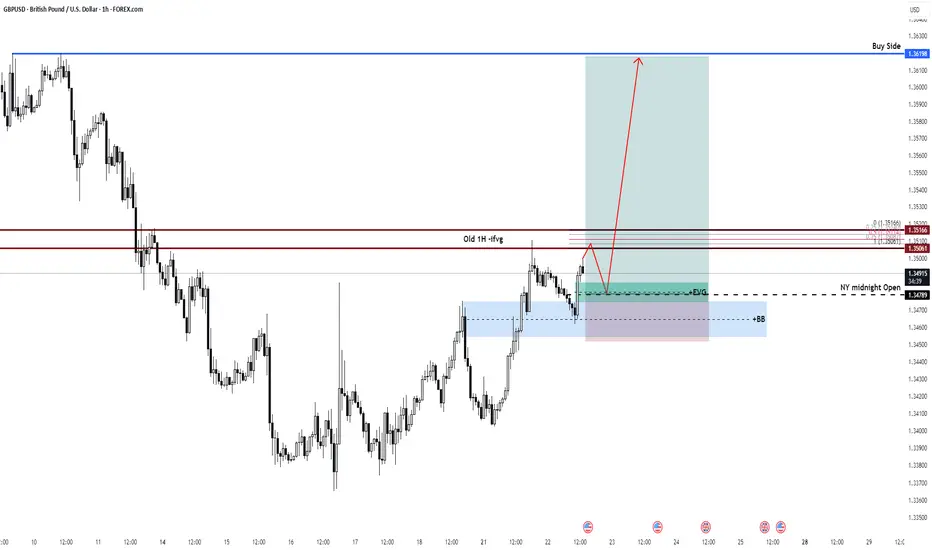
GBPUSD Long Setup – Liquidity Sweep & FVG ReclaimPair: GBP/USD
Timeframe: 1H
Bias: Long
Entry Type: Reclaim + Inducement Play
Target: Buy-side Liquidity at 1.36198
🧠 Thesis:
We’re looking to long cable after a classic setup has presented itself:
- Market structure shift has occurred to the upside.
- Price retraced into a Bullish Breaker Block aligned with a 1H Fair Value Gap (FVG) and NY Midnight Open.
- Liquidity inducement just above the NY Midnight Open should provide the fuel.
🧱 Key Confluences:
✅ 1H FVG in alignment with BB (Breaker Block)
✅ NY Midnight Open (1.34789) – acts as draw on liquidity
✅ Inducement above short-term highs before deeper retrace
✅ Buy-side liquidity resting at 1.36198
GBPUSD - market structureGBPUSD - market structure , easy and clean chart, of course this is no analysis, use risk and trade managment
GBP/USD Pair Technical Overview!The GBP/USD pair is trading in a general upward trend after seeing some pullbacks due to the renewed strength of the US dollar. However, it failed to close below the 1.33649 level on both the 4-hour and daily timeframes, thus maintaining a positive outlook.
The next target for this pair is at the 1.3690 level. The bullish scenario will remain valid unless the price breaks below the 1.33649 level and creates a daily candle close beneath it.

GBPUSD CONTINUE?Please be advice what I am writing or making ideas is base only on my understanding on market, were all not the same ideology on how market works. so I am sharing only what I know.
On trading with capital trade only what you can afford to loss.
THis is my view on this pair, I think we see a continuation on the upside to redistribute at higher timeframe.
1.39 for new high. but it would redistribute after this high?
what's your thoughts on this?
THis is not a financial advice.
Trade only at your own understanding.
FOllow for more.
ciaoooooo

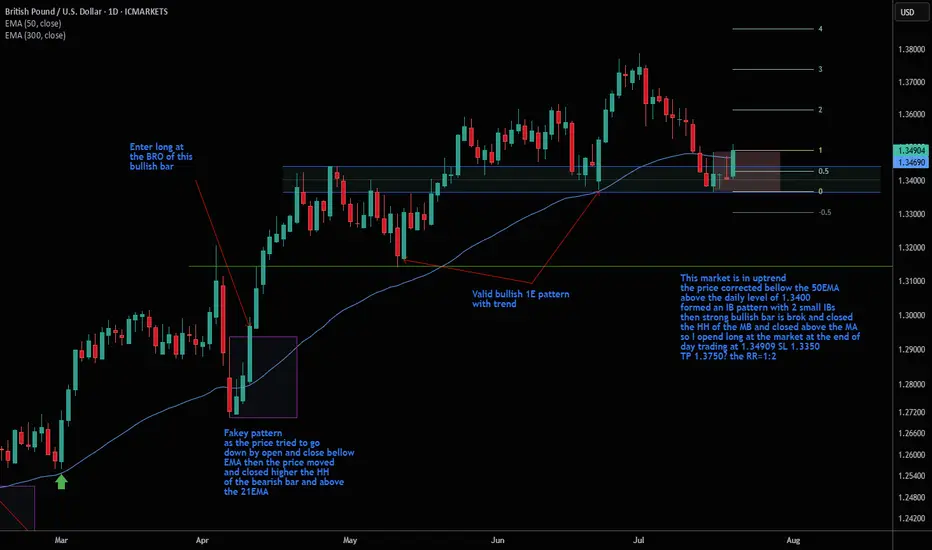
IB pattern after correction bellow the 50EMAThis market is in uptrend
it has been in a correction phase
it reached bellow the 50EMA and near the strong
daily support zone of 1.34000
then it formed a nice IB pattern
which is triggered after the breakout and close the
HH of the MB and above the 50EMA
so I opend at the end of day a buy order at the market
at 1.34909
SL 1.33500
TP 1.37500
so the RR=1:2
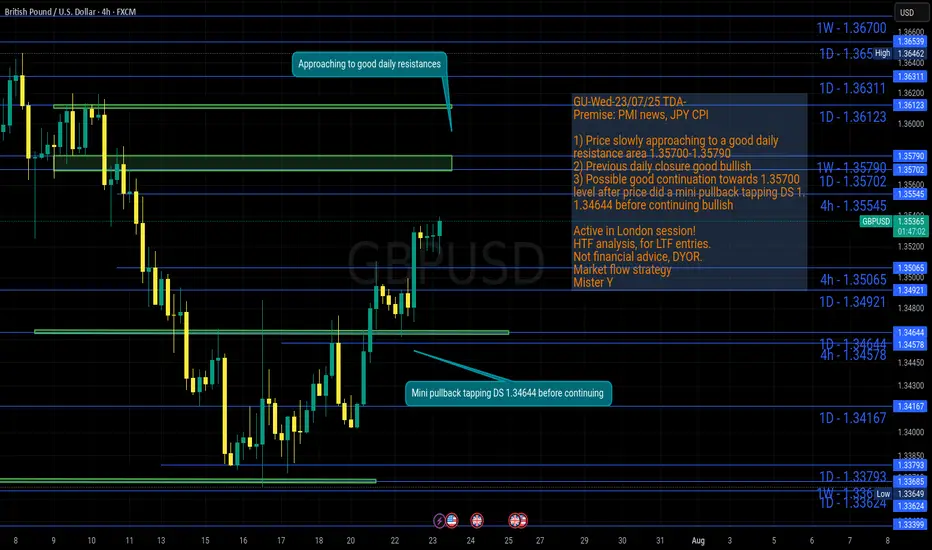
GU-Wed-23/07/25 TDA-GU approaching to a good resistance zoneAnalysis done directly on the chart!
Premise:
A simple idea plan (like Tradingview public posts) won't describe everything.
No one can predict how market will move, it's always good to react to how it moves.
It gives an idea of how price might move, but no one come from FUTURE.
So I always encourage people to openly and actively discuss in real time.
I don't give signals blindly, people should learn
and understand the skill.
Following blindly signals you won't know how to
manage the trade, where precisely put sl and tp,
lot size and replicate the move over time.
That's why you need active real time discussions.
Trading is not get rich quick scheme!
Active in London session!
Not financial advice, DYOR.
Market Flow Strategy
Mister Y

Fundamental Market Analysis for July 23, 2025 GBPUSDSterling is struggling to hold above 1.35 as fundamentals tilt against it. US CPI has accelerated to 2.7 % y/y, reinforcing expectations that the Fed will delay its easing cycle, whereas in the UK subdued GDP growth and a cooling labour market have revived talk of a Bank of England rate cut as early as August.
Political noise adds to the pressure: London must balance the US’s hard‑line trade stance with the need to mend ties with the EU, heightening uncertainty for businesses. Meanwhile, capital is flowing toward higher‑yielding US Treasuries, sapping demand for UK assets.
The situation is compounded by Britain’s persistent current‑account deficit, which—amid a stronger dollar—requires ever‑higher risk premia to finance. All told, short positions in cable with a tight stop above 1.35750 look attractive in the short run.
Trade recommendation: SELL 1.35250, SL 1.35750, TP 1.34750

EUROUSD NEW OUTLOOKEurousd market is running on both sides
now market looking in bulish trande wait for good opportunity market will touch support zone then ypu can buy from support zone its best for you
TRADE AT YOUR OWN RISK
REGARD ALBERT

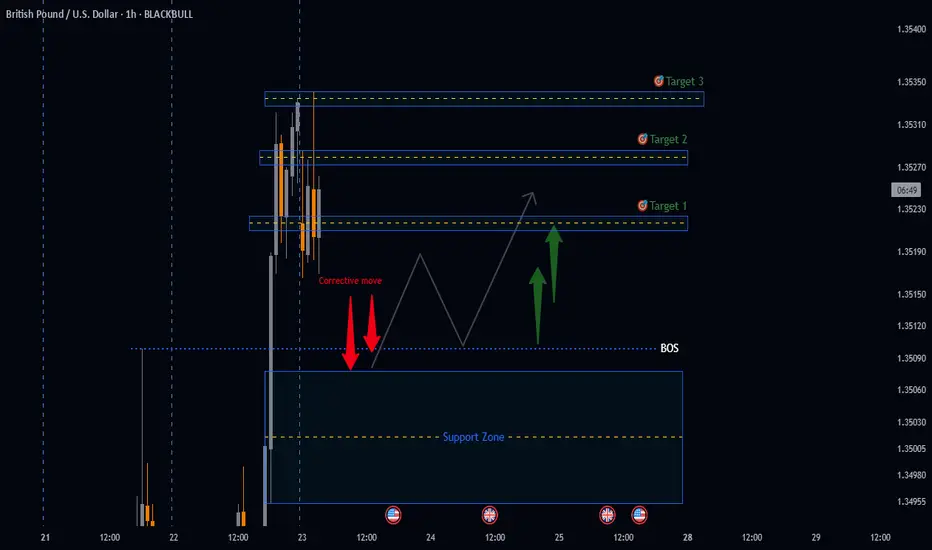
GBPUSD potential BULLISH Setup🚀 GBPUSD UPDATE: BULLISH Setup
Summary:
Analysing price action from yesterday, breakout from the Daily timeframe accumulation zone has materialized with strong conviction.
TRADE SETUP Metrics:
- Entry: ✅
- Stop loss - Below Support Zone
- Target 1: (R:R 1:2)🎯
- Target 2: (R:R 1:3)🎯
- Target 3: (R:R 1:4)🎯
Technical Anticipations:
- Price action to show a Bullish follow-through
- Support zone to hold
Position Management:
- partial profits secured at Target 1
- Stop loss adjusted to breakeven upon reaching Targets
- Final Target 3
LIKE or COMMENT if this idea sparks your interest, or share your thoughts below!
FOLLOW to keep up with fresh ideas.
Tidypips: "Keep It Clean, Trade Mean!"
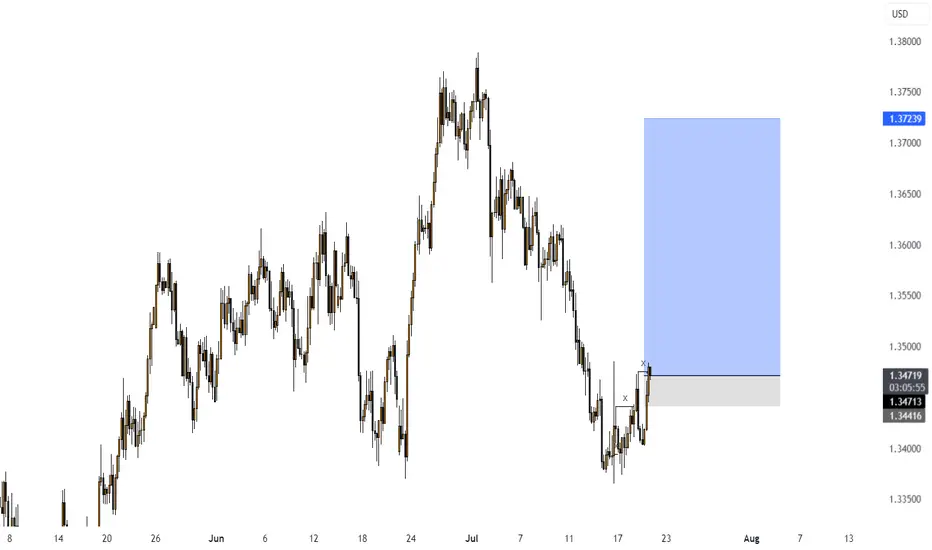
GBPUSD Week 30 Swing Zone/LevelsPEPPERSTONE:GBPUSD is expected to trend upward from the 1.34032 level towards the resistance zone. Whether it breaks through or reverses downward will ultimately depend on market players.
This projection is based on a forward-looking metric analysis, which explains why the zones are not derived from historical price action on the left side of the chart, as is common in traditional technical analysis. However, the daily candles from previous weeks still contribute meaningfully to this outlook.

GBPUSD Short tradeCable is actually on the way to sink on the current week. I have my target at the key level 1.340.

GBPUSD: Mid-Term Analysis💷
Everyone wants to catch the move, but the real edge comes from patience.
🛡️ The Situation:
GBPUSD has shown strength, but chasing here isn’t my game.
📍 The Plan:
According to orderflow, the next buying point is in the blue box I’ve marked.
That’s where I let the market come to me.
🔎 What I need to see there:
✅ Footprint absorption (clear buyers stepping in)
✅ CDV support or divergence
✅ Structure reclaim for clean confirmation
💡 Why it matters:
Anyone can hit buy, but buying at the right place with confirmation is how you stay in the game.
🎯 What’s next:
If price returns to the blue box and confirms, I will execute with clear risk.
If not, I’ll stay patient and let the market prove itself.
✅ Summary:
Let price come to your level, confirm, and then act decisively.
No chasing. No fear. Just clear, disciplined execution.

GBPUSD Forming a Fall CorrectionGBPUSD is forming a counter-trend correction and pushing towards a liquidity zone, supported by recent USD weakness.
If price continues to rise amid USD softness, GBPUSD may test the resistance at 1.35500. A rejection or bearish price action from this resistance could trigger a pullback or continuation of the broader downtrend. The downside target remains near 1.32200, aligned with previous demand and potential liquidity zones.
You may find more details in the Chart.
Ps; Support with like and comments for more better analysis.

GBPUSD Buy at current market priceGBPUSD closed with strong bullish daily candles showing the buyers are stepping in.
Let's ride the wave with current market price.
calculate your own risk & reward.
Good luck

GBPUSD BULLISH Technically:
GBPUSD printed HH
GBPUSD retrace at golden zone
At entry point which is previous support most likely became resistance
