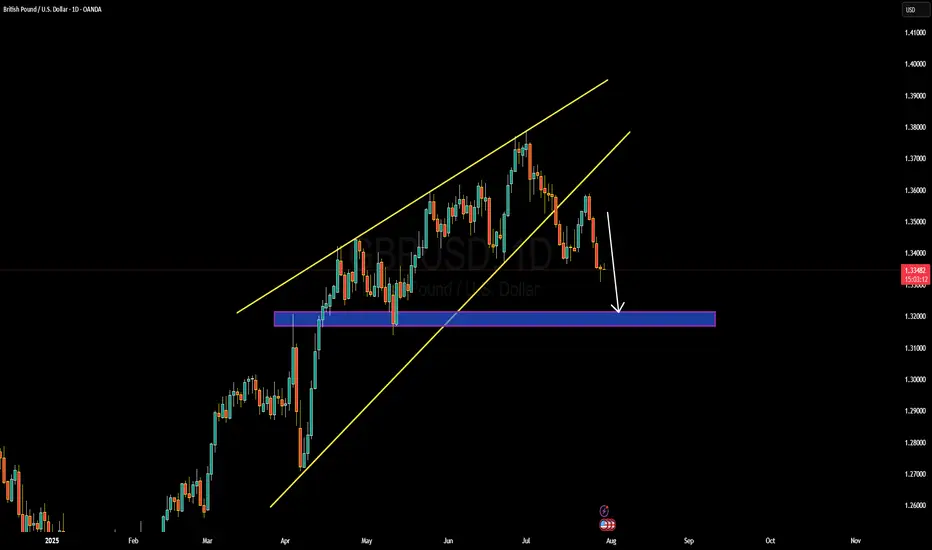
Bullish reversal off overlap support?The Cable (GBP/USD) is falling towards the pivot and could bounce to the 1st resistance, which is a pullback resistance that is slightly below the 38.2% Fibonacci retracement.
Pivot: 1.3159
1st Support: 1.3049
1st Resistance: 1.3321
Risk Warning:
Trading Forex and CFDs carries a high level of risk to your capital and you should only trade with money you can afford to lose. Trading Forex and CFDs may not be suitable for all investors, so please ensure that you fully understand the risks involved and seek independent advice if necessary.
Disclaimer:
The above opinions given constitute general market commentary, and do not constitute the opinion or advice of IC Markets or any form of personal or investment advice.
Any opinions, news, research, analyses, prices, other information, or links to third-party sites contained on this website are provided on an "as-is" basis, are intended only to be informative, is not an advice nor a recommendation, nor research, or a record of our trading prices, or an offer of, or solicitation for a transaction in any financial instrument and thus should not be treated as such. The information provided does not involve any specific investment objectives, financial situation and needs of any specific person who may receive it. Please be aware, that past performance is not a reliable indicator of future performance and/or results. Past Performance or Forward-looking scenarios based upon the reasonable beliefs of the third-party provider are not a guarantee of future performance. Actual results may differ materially from those anticipated in forward-looking or past performance statements. IC Markets makes no representation or warranty and assumes no liability as to the accuracy or completeness of the information provided, nor any loss arising from any investment based on a recommendation, forecast or any information supplied by any third-party.
GBPUSD trade ideas

GBPUSD IDEA The key is patience- from all the ideas, well wait for the clearest ones that give us confirmation... and then we jump in. lets goooooo

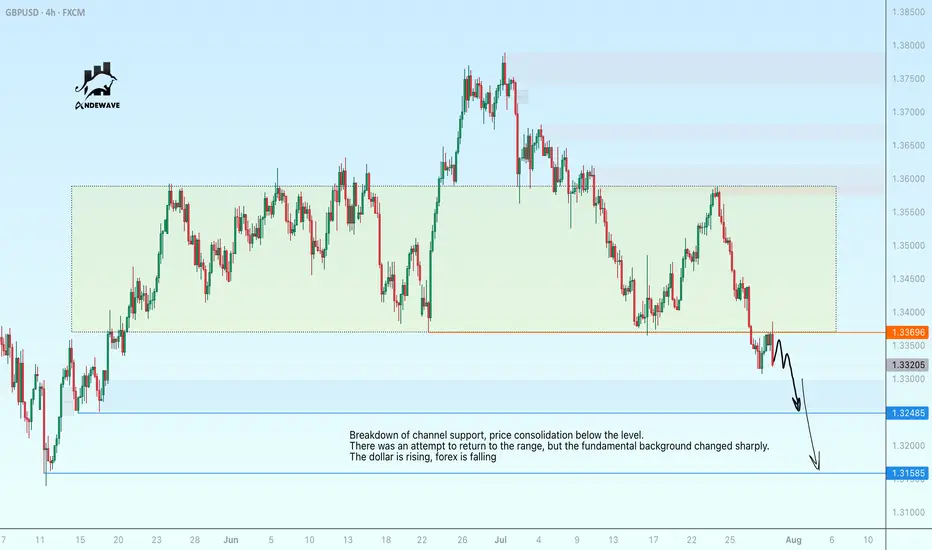
GBPUSD has consolidated in the selling zoneBreakdown of channel support, price consolidation below the level. There was an attempt to return to the range, but the fundamental background changed sharply. The dollar is rising, forex is falling.
GBPUSD may continue its local decline to 1.3158.
GBPUSD Sell analysis/ideaThis trade/analysis is based on the daily and 4-hour timeframes and executed using reversal trading and trend formation. Complete explanation in the video!


GBPUSD – DAILY FORECAST Q3 | W31 | D30 | Y25📊 GBPUSD – DAILY FORECAST
Q3 | W31 | D30 | Y25
Daily Forecast 🔍📅
Here’s a short diagnosis of the current chart setup 🧠📈
Higher time frame order blocks have been identified — these are our patient points of interest 🎯🧭.
It’s crucial to wait for a confirmed break of structure 🧱✅ before forming a directional bias.
This keeps us disciplined and aligned with what price action is truly telling us.
📈 Risk Management Protocols
🔑 Core principles:
Max 1% risk per trade
Only execute at pre-identified levels
Use alerts, not emotion
Stick to your RR plan — minimum 1:2
🧠 You’re not paid for how many trades you take, you’re paid for how well you manage risk.
🧠 Weekly FRGNT Insight
"Trade what the market gives, not what your ego wants."
Stay mechanical. Stay focused. Let the probabilities work.
FX:GBPUSD

GBP/USD Professional Analysis – “Trap Trigger at Support”GBP/USD Professional Analysis – “Trap Trigger at Support”
📈 Market Overview:
• Pair: GBP/USD
• Timeframe: Likely 1H or 2H based on candle spacing
• Date: July 28, 2025
• Current Price: 1.33529
⸻
🔍 Technical Breakdown
🔴 Resistance Zone: 1.35800 – 1.36200
• Strong supply area where the last bullish impulse failed.
• Price got rejected hard, initiating a new downtrend.
• Sell-side pressure was confirmed with Supertrend turning red.
🟤 Support Zone: 1.32860 – 1.33400
• Major demand area where price previously reversed sharply.
• Currently being tested again after a clean sweep into the Trap Trigger zone.
⚠ Trap Trigger Zone (Liquidity Sweep Area):
• Price wicked just below support, tapping into a low-volume/high-liquidity area.
• This wick likely cleared sell-side liquidity and trapped breakout sellers.
• Followed by a bullish rejection wick, implying smart money accumulation.
⸻
🛠 Indicators & Tools:
• Supertrend (10,3): Currently red, indicating short-term bearish momentum.
• However, if price closes above 1.34032 (Supertrend level), it could flip bullish.
• Volume Profile (VRVP):
• Low-volume node under support suggests a quick “stop hunt” move, not genuine selling.
• High-volume acceptance area sits higher, near 1.34500–1.35000.
⸻
🎯 Forecast:
🔴 Bearish Invalidations:
• Price closing below 1.32860 with volume would invalidate this setup.
• That could signal continuation to deeper liquidity (1.32500 or below).
⸻
🧠 Smart Money Perspective:
• Liquidity engineered beneath support
• Trap Trigger activated — ideal for institutional reversal setups
• This is a classic “Stop Hunt → Reclaim → Expand” model

GBP/USD Under Pressure as Dollar Strength Builds and Technicals GBP/USD continues to weaken under the weight of renewed dollar strength. The pair has traded below its 50-day moving average for an extended period, and technical signals are aligning for further downside.
Last week’s bearish pinbar on the weekly chart highlighted rejection near key resistance, and now a potential bearish close on the monthly chart—marked by a large shadow candle—could reinforce the negative bias. If confirmed, this would suggest sustained pressure into August and beyond.
The U.S. dollar is gaining traction on the back of resilient economic data, stable inflation expectations, and rising Treasury yields. No changes are expected from the Federal Reserve in the near term, which removes uncertainty and supports the dollar through steady policy.
Meanwhile, the UK outlook remains fragile. Political uncertainty, weak economic momentum, and unclear forward guidance from the Bank of England are weighing on the Pound. Wage growth is slowing, inflation is cooling, and real yields remain under pressure.
If GBP/USD breaks below the recent support near 1.3205, it could open the door to deeper losses. As long as dollar strength persists and UK fundamentals remain soft, the pair may remain under bearish control. Watch for a confirmed monthly close to validate the setup.

GBPUSD OUTLOOKHey traders what’s your take on this ? If it breaks the that zone, expect a bearish continuation
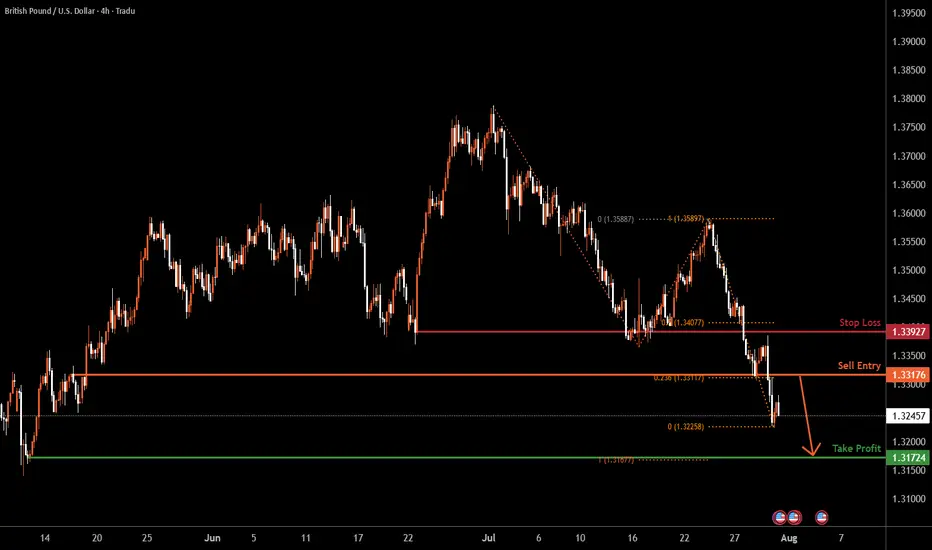
GBPUSD H4 | Bearish continuationThe Cable (GBP/USD) is rising towards the sell entry, which is a pullback resistance that aligns with the 23.6% Fibonacci retracement and could drop lower from this level.
Sell entry is at 1.3317, which is a pullback resistance that lines up with the 23.6% Fibonacci retracement.
Stop loss at 1.3392, which is a pullback resistance that is slightly below the 50% Fibonacci retracement.
Take profit is at 1.3172, which is a swing low support that aligns with the 100% Fibonacci projection.
High Risk Investment Warning
Trading Forex/CFDs on margin carries a high level of risk and may not be suitable for all investors. Leverage can work against you.
Stratos Markets Limited (tradu.com ):
CFDs are complex instruments and come with a high risk of losing money rapidly due to leverage. 65% of retail investor accounts lose money when trading CFDs with this provider. You should consider whether you understand how CFDs work and whether you can afford to take the high risk of losing your money.
Stratos Europe Ltd (tradu.com ):
CFDs are complex instruments and come with a high risk of losing money rapidly due to leverage. 66% of retail investor accounts lose money when trading CFDs with this provider. You should consider whether you understand how CFDs work and whether you can afford to take the high risk of losing your money.
Stratos Global LLC (tradu.com ):
Losses can exceed deposits.
Please be advised that the information presented on TradingView is provided to Tradu (‘Company’, ‘we’) by a third-party provider (‘TFA Global Pte Ltd’). Please be reminded that you are solely responsible for the trading decisions on your account. There is a very high degree of risk involved in trading. Any information and/or content is intended entirely for research, educational and informational purposes only and does not constitute investment or consultation advice or investment strategy. The information is not tailored to the investment needs of any specific person and therefore does not involve a consideration of any of the investment objectives, financial situation or needs of any viewer that may receive it. Kindly also note that past performance is not a reliable indicator of future results. Actual results may differ materially from those anticipated in forward-looking or past performance statements. We assume no liability as to the accuracy or completeness of any of the information and/or content provided herein and the Company cannot be held responsible for any omission, mistake nor for any loss or damage including without limitation to any loss of profit which may arise from reliance on any information supplied by TFA Global Pte Ltd.
The speaker(s) is neither an employee, agent nor representative of Tradu and is therefore acting independently. The opinions given are their own, constitute general market commentary, and do not constitute the opinion or advice of Tradu or any form of personal or investment advice. Tradu neither endorses nor guarantees offerings of third-party speakers, nor is Tradu responsible for the content, veracity or opinions of third-party speakers, presenters or participants.
The Fed aftermath. US dollar bulls enjoy the moment.The US dollar bulls went in hard after during and after the Fed's press conference. Can the momentum stay? Let's dig in.
MARKETSCOM:DOLLARINDEX
TVC:DXY
Let us know what you think in the comments below.
Thank you.
75.2% of retail investor accounts lose money when trading CFDs with this provider. You should consider whether you understand how CFDs work and whether you can afford to take the high risk of losing your money. Past performance is not necessarily indicative of future results. The value of investments may fall as well as rise and the investor may not get back the amount initially invested. This content is not intended for nor applicable to residents of the UK. Cryptocurrency CFDs and spread bets are restricted in the UK for all retail clients.

Fundamental Market Analysis for July 31, 2025 GBPUSDGBPUSD:
The pound remains under pressure as consumer spending and the labor market in the UK are weakening, reducing the likelihood of an aggressive response from the Bank of England. Core inflation has dropped to 3.3% y/y – the lowest in two years – allowing the regulator to keep rates steady for longer.
External factors are also unfavorable: demand for the defensive dollar is strengthening ahead of the FOMC meeting, and the yield spread between 10-year gilts and USTs has narrowed to 115 basis points – the lowest since March, stimulating flows into the dollar.
Additional negative dynamics come from the rise in the UK current account deficit to 3.9% of GDP, amid higher prices for imported energy and declining exports of services. Expectations of tighter fiscal consolidation are increasing fiscal risks and encouraging investors to reduce long GBP positions.
Risks to the bearish outlook are limited: these would be a surprise in the form of hawkish Bank of England comments or a sharp deterioration in US macro data that could weaken the dollar.
Trade recommendation: SELL 1.32700, SL 1.32900, TP 1.31700

GBP/USD Bearish Breakdown with Downside PotentialThe GBPUSD chart indicates a bearish trend, with price breaking below a key ascending support line. This breakdown suggests a shift in momentum, favoring sellers. The price is currently trading below the Ichimoku cloud, which reinforces the bearish bias. A pullback to the broken support zone may offer a retest before further decline. The structure points toward lower lows, and the chart outlines two potential support levels where price may react. Continued downside is expected if the current resistance zone holds. Bearish continuation appears likely as long as price remains below the recent high and beneath the cloud.
Entry Sell: 1.33360
First Target point: 1.32250
Second Target point: 1.30000
If you found this analysis helpful, don’t forget to drop a like and comment. Your support keeps quality ideas flowing—let’s grow and win together! 💪📈


Sell gbpusdOur last selling idea already running 500+ pips in sell
Now previous weak resistance also breaks
In my view its long term selling minimum 800 more pips can be sell
Monthly sell structure and overbought
Market now just on the way of bearing correction

GBPUSD will resume downtrendA healthy pullback observed during Asian & Europe session.
I'm expecting a down move during US session.
Bearish engulf candle already forming. Waiting price to break nearest support @1.33617 for bearish confirmation.
my intraday target will be round number 1.33000.
please calculate your own risk & reward.
Good Luck

GBPUSD SWING TRADE AUGUSTTaking support from last month's low and now swing trade opportunity forming.
follow for more swing analysis on indices, commodities and currecies.
Live market analysis.
test the accuracy by reviewing my previous analysis of trades i took and published.
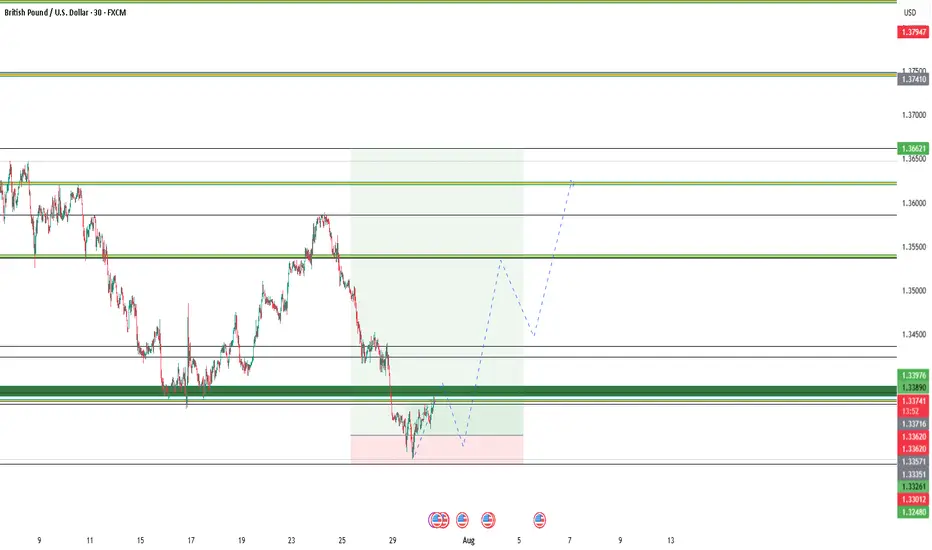
DeGRAM | GBPUSD reached the lower boundary of the channel📊 Technical Analysis
● GBPUSD has broken out of a falling wedge within a descending channel, reclaiming the lower boundary of the broader structure.
● Price is consolidating just above 1.33160 support and appears ready to retest the 1.34650 resistance, aided by a series of higher lows and a bullish break of short-term trendlines.
💡 Fundamental Analysis
● Weakening USD sentiment continues after Friday’s softer core PCE and downward revision of Michigan inflation expectations.
● UK economic sentiment improved after recent wage growth and mortgage approval data exceeded forecasts, bolstering GBP.
✨ Summary
Breakout from wedge confirms bullish bias. Support at 1.33160; target 1.34650 short-term. Watch for rally continuation while holding above 1.33625.
-------------------
Share your opinion in the comments and support the idea with a like. Thanks for your support!

Sells for the week
***Confluences-(Waiting for the restest)***
Head and Shoulders Broken at Higher Time Frame
Weekly, Daily, 4Hr all bearish
Broke a Key Weekly Level at 1.43000

GBPUSD Is Very Bullish! Buy!
Here is our detailed technical review for GBPUSD.
Time Frame: 1D
Current Trend: Bullish
Sentiment: Oversold (based on 7-period RSI)
Forecast: Bullish
The market is testing a major horizontal structure 1.334.
Taking into consideration the structure & trend analysis, I believe that the market will reach 1.358 level soon.
P.S
Overbought describes a period of time where there has been a significant and consistent upward move in price over a period of time without much pullback.
Disclosure: I am part of Trade Nation's Influencer program and receive a monthly fee for using their TradingView charts in my analysis.
Like and subscribe and comment my ideas if you enjoy them!

GBPUSD SELLAfter seeing the previous daily candle close bearish and the 4hr had a retrace back into the moving averages we could expect price to see further sell off into support

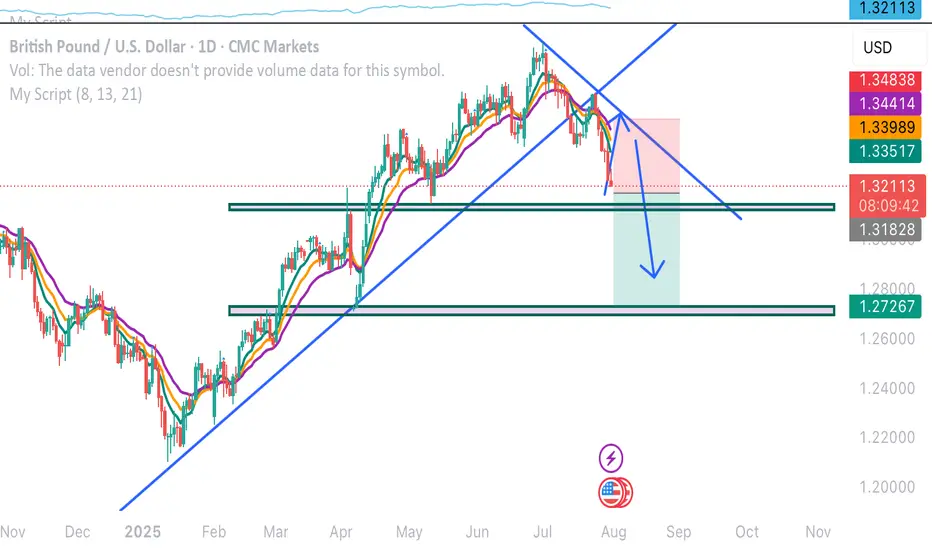
GBPUSD Forming Rising WedgeGBPUSD is currently showing a clear breakdown from a rising wedge pattern on the daily timeframe—a classic bearish signal. After a prolonged bullish channel, price has decisively broken below the lower trendline support, confirming a shift in momentum. The pair is now approaching a major demand zone around the 1.3100–1.3150 area, which previously acted as a strong support level. Based on price action structure, further downside movement is anticipated until price retests that zone for potential reaction.
From a fundamental perspective, the pound has come under pressure as UK economic data has started to show signs of softening. Slower retail sales, weakening PMI numbers, and sticky inflation are weighing on the British currency. Meanwhile, the US dollar remains firm, supported by a hawkish stance from the Federal Reserve and strong US GDP data. As markets continue to price in the possibility of another rate hike or a longer pause in rate cuts, dollar strength is expected to persist—adding bearish weight to GBPUSD.
Technically, the breakdown from the wedge pattern confirms a bearish reversal structure. The current bearish leg is aligned with increasing downside momentum, and if price sustains below 1.3360, the next key target sits around the 1.3200 zone. This area also aligns with previous consolidation and could serve as a temporary floor. However, a break below that zone may expose deeper targets toward 1.3050 in the medium term.
Overall, the bias for GBPUSD remains bearish unless there is a strong bullish reversal signal. For now, trend-following traders may look to sell the rallies, keeping an eye on key support levels for signs of exhaustion. The current setup offers a good risk-to-reward opportunity with confirmation from both technical breakdown and macroeconomic headwinds.
GBPUSD long Especially after some key economies announced higherCombined with the global market news sentiment, social platform dynamics and real-time capital flow situation, comprehensive judgment of the current foreign exchange market long and short pattern of positive changes. Especially after some key economies announced higher-than-market-expected GDP and inflation control results, the market's judgment on the future economic cycle tends to be positive.
The system monitored the rise of terms such as "return of growth", "confirmation of inflection point" and "confidence restoration" in social media and financial opinions, reflecting that market sentiment is shifting from wait-and-see to optimism. At the same time, the risk aversion mood edge down, risky asset allocation ratio rose, especially conducive to part of the high correlation between the performance of the currency pair repair.
Flow of funds data show that some large institutions since last week began to make up for the previous reduction in foreign exchange positions, the volume of transactions increased significantly, This is a positive reaction to the policy shift and improved economic data. Against this backdrop, the current formation of long momentum has a certain degree of sustainability.
