GBPUSD Wave Analysis – 28 July 2025
- GBPUSD broke support zone
- Likely fall to support level 1.3175
GBPUSD currency pair recently broke the support zone between the support level 1.3385 (which has been reversing the price from June) and the support trendline of the daily up channel from January.
The breakout of this support zone should accelerate the active intermediate impulse wave (1) from the start of July.
GBPUSD currency pair can be expected to fall to the next support level 1.3175 (former multi-month low from May, low of the earlier correction (4)).
GBPUSD trade ideas

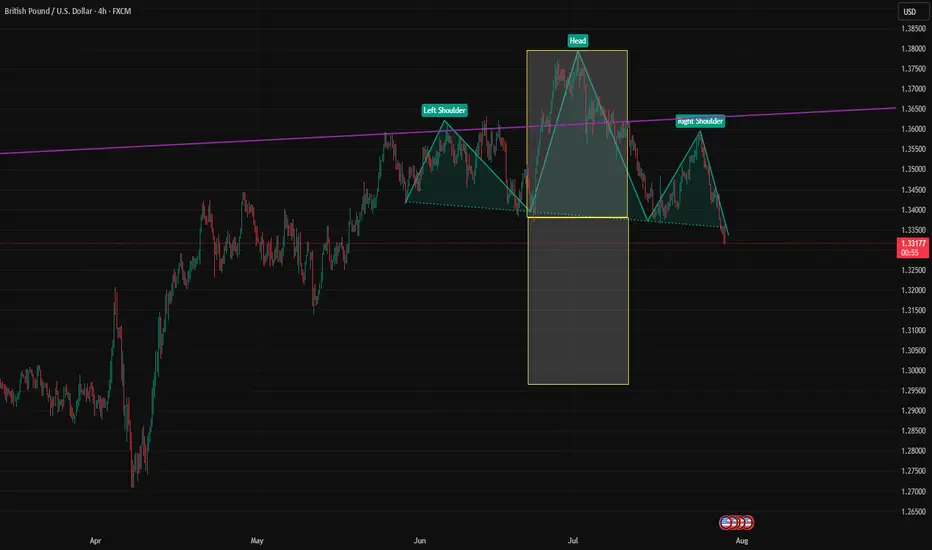
GBPUSD: Bearish Reversal Coming?!The 📉GBPUSD pair formed a significant head and shoulders pattern on the daily chart.
The neckline was violated yesterday, with a daily candle closing below it. I anticipate a downward movement.
With the next support level at 1.3170.

GBPUSD Will Explode! BUY!
My dear friends,
Please, find my technical outlook for GBPUSD below:
The instrument tests an important psychological level 1.3339
Bias - Bullish
Technical Indicators: Supper Trend gives a precise Bullish signal, while Pivot Point HL predicts price changes and potential reversals in the market.
Target - 1.3419
About Used Indicators:
Super-trend indicator is more useful in trending markets where there are clear uptrends and downtrends in price.
Disclosure: I am part of Trade Nation's Influencer program and receive a monthly fee for using their TradingView charts in my analysis.
———————————
WISH YOU ALL LUCK

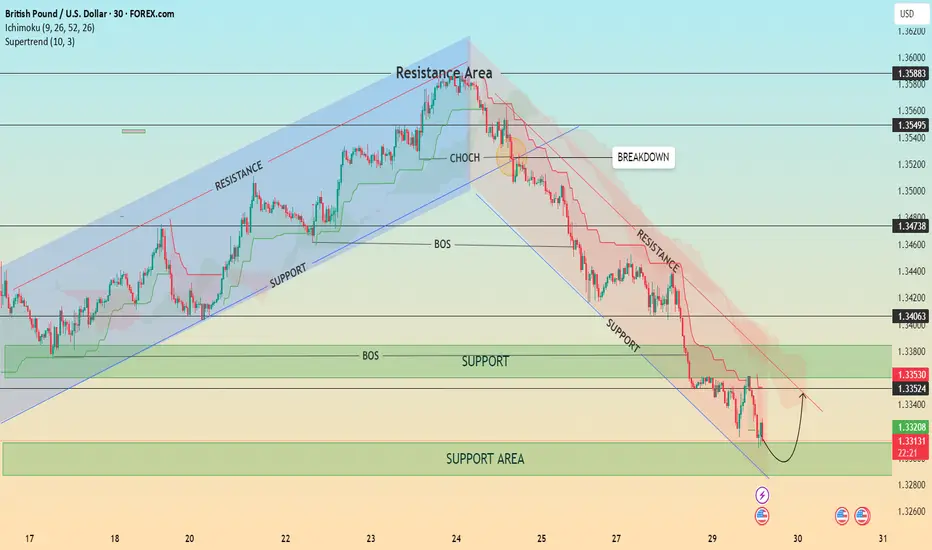
GBP/USD – Bearish Structure with Possible Short-Term Pullback📊 GBP/USD – Bearish Structure with Possible Short-Term Pullback
Timeframe: 30-Minute | Date: July 29, 2025
Price action recently broke down from a well-respected ascending channel, confirming a shift in market structure with a Change of Character (CHOCH) followed by a Break of Structure (BOS). Since then, GBP/USD has been respecting a descending trend channel, forming consistent lower highs and lower lows.
🔍 Current Setup:
Price is testing a major support area around 1.3300–1.3320.
A minor pullback is expected as indicated by the bullish wick rejections.
However, the overall bias remains bearish unless we break and hold above the 1.3353–1.3406 resistance zone and the descending trendline.
The Ichimoku Cloud and Supertrend both show bearish momentum.
📈 Potential Scenario:
Price may bounce from the support area and retest the upper boundary of the descending channel before resuming the bearish trend.
⚠️ Key Levels to Watch:
Resistance: 1.33530 / 1.34063 / 1.34738
Support: 1.33200 / 1.33000
💡 Structure Notes:
CHOCH = Trend Reversal Signal
BOS = Confirmation of Downtrend
Cloud = Dynamic Resistance
GBPUSD - 28/7/25 - Bearish continuationI do have a bullish trade open current from this zone, but will move the SL to breakeven or take a small loss.
The new idea if the equal low liquidity is swept is to take a bearish trade as shown.

Short GUHNS was formed in H4, coincidently it was formed after it rejected upper trendline. I am going to anticipate 1:1 formation size
Correction It is expected that the downtrend will continue to form until the specified support levels. Then there is a possibility of a trend change and the start of an uptrend. If the price breaks through the support area, the downtrend will continue to the next support area.

GBPUSD H4 I Bullish Rise toward the resistanceBased on the H4 chart analysis, we can see that the price is testing our buy entry at 1.3346, which is an overlap support.
Our take profit will be at 1.3402, which is a pullback resistance level.
The stop loss will be placed at 1.3288, a pullback support.
High Risk Investment Warning
Trading Forex/CFDs on margin carries a high level of risk and may not be suitable for all investors. Leverage can work against you.
Stratos Markets Limited (tradu.com ):
CFDs are complex instruments and come with a high risk of losing money rapidly due to leverage. 65% of retail investor accounts lose money when trading CFDs with this provider. You should consider whether you understand how CFDs work and whether you can afford to take the high risk of losing your money.
Stratos Europe Ltd (tradu.com ):
CFDs are complex instruments and come with a high risk of losing money rapidly due to leverage. 66% of retail investor accounts lose money when trading CFDs with this provider. You should consider whether you understand how CFDs work and whether you can afford to take the high risk of losing your money.
Stratos Global LLC (tradu.com ):
Losses can exceed deposits.
Please be advised that the information presented on TradingView is provided to Tradu (‘Company’, ‘we’) by a third-party provider (‘TFA Global Pte Ltd’). Please be reminded that you are solely responsible for the trading decisions on your account. There is a very high degree of risk involved in trading. Any information and/or content is intended entirely for research, educational and informational purposes only and does not constitute investment or consultation advice or investment strategy. The information is not tailored to the investment needs of any specific person and therefore does not involve a consideration of any of the investment objectives, financial situation or needs of any viewer that may receive it. Kindly also note that past performance is not a reliable indicator of future results. Actual results may differ materially from those anticipated in forward-looking or past performance statements. We assume no liability as to the accuracy or completeness of any of the information and/or content provided herein and the Company cannot be held responsible for any omission, mistake nor for any loss or damage including without limitation to any loss of profit which may arise from reliance on any information supplied by TFA Global Pte Ltd.
The speaker(s) is neither an employee, agent nor representative of Tradu and is therefore acting independently. The opinions given are their own, constitute general market commentary, and do not constitute the opinion or advice of Tradu or any form of personal or investment advice. Tradu neither endorses nor guarantees offerings of third-party speakers, nor is Tradu responsible for the content, veracity or opinions of third-party speakers, presenters or participants.

GBPUSD SELL After seeing the previous daily close below the low of the weekly bullish support we could expect this pair to continue its move down following the 4hr structure now at a low point we could see a retracement into the Fibonacci area

GBPUSD ShortGBP/USD Short Bias – Target 1.2697
GBP/USD failed to hold above 1.35 and is forming lower highs, signaling bearish momentum.
A break and close below 1.3350 could trigger further downside to 1.3249 → 1.30 → 1.2697 (major weekly support).
MACD: Bearish crossover, momentum fading.
RSI: 38, room to drop before oversold.
Fundamentals: Weak UK data + expected BoE rate cut, while USD strengthens on trade deal optimism.
Plan: Wait for a clean break below 1.3350 to enter short, invalidation above 1.3450.

GBPUSD H4 | Bullish bounce off overlap supportGBPP?USD is falling towards the buy entry which is an overlap support and could bounce from this level to the upside.
Buy entry is at 1.3381, which is an overlap support.
Stop loss is at 1.3282, which is a pullback support that lines up with the 61.8% Fibonacci retracement.
Take profit is at 1.3504, which is a pullback resistance that aligns with the 78.6% Fibonacci retracement.
High Risk Investment Warning
Trading Forex/CFDs on margin carries a high level of risk and may not be suitable for all investors. Leverage can work against you.
Stratos Markets Limited (tradu.com ):
CFDs are complex instruments and come with a high risk of losing money rapidly due to leverage. 65% of retail investor accounts lose money when trading CFDs with this provider. You should consider whether you understand how CFDs work and whether you can afford to take the high risk of losing your money.
Stratos Europe Ltd (tradu.com ):
CFDs are complex instruments and come with a high risk of losing money rapidly due to leverage. 66% of retail investor accounts lose money when trading CFDs with this provider. You should consider whether you understand how CFDs work and whether you can afford to take the high risk of losing your money.
Stratos Global LLC (tradu.com ):
Losses can exceed deposits.
Please be advised that the information presented on TradingView is provided to Tradu (‘Company’, ‘we’) by a third-party provider (‘TFA Global Pte Ltd’). Please be reminded that you are solely responsible for the trading decisions on your account. There is a very high degree of risk involved in trading. Any information and/or content is intended entirely for research, educational and informational purposes only and does not constitute investment or consultation advice or investment strategy. The information is not tailored to the investment needs of any specific person and therefore does not involve a consideration of any of the investment objectives, financial situation or needs of any viewer that may receive it. Kindly also note that past performance is not a reliable indicator of future results. Actual results may differ materially from those anticipated in forward-looking or past performance statements. We assume no liability as to the accuracy or completeness of any of the information and/or content provided herein and the Company cannot be held responsible for any omission, mistake nor for any loss or damage including without limitation to any loss of profit which may arise from reliance on any information supplied by TFA Global Pte Ltd.
The speaker(s) is neither an employee, agent nor representative of Tradu and is therefore acting independently. The opinions given are their own, constitute general market commentary, and do not constitute the opinion or advice of Tradu or any form of personal or investment advice. Tradu neither endorses nor guarantees offerings of third-party speakers, nor is Tradu responsible for the content, veracity or opinions of third-party speakers, presenters or participants.

GBP/USD Bearish correction.This move is working in the same direction of the EUR/USD trade, I like this correction on GBP/USD. It's setting up for more downside.

Cable & Fibre!So, generally I'm happy with the way the market is going. Though a little bit uncertain about how high it wants to go before it resumes its downward spiral, things are going good so far.
Looking at Cable, on an hourly chart, we see that between 06:00 am and 08:00 am (New York Time), there is FVG formed and to its left, there is a breaker. This a perfect setup for me, but I will wait to see if price actually wants to go above the 1.3477 level to reach for the 4H as well as 1H FVG.
I've put a sell limit on the fibre at 1.1635, but I will remove it for now, 'till I have confirmed whether price will go above 1.1698 level, to go into the 4H FVG, the mid-point thereof. I have a sell limit there with a stop loss at .1745.

GBPUSD Sell ideaGood evening from this end guys... its KriXtian again
GU traded into a daily OB and induced a 4H FVG , we see a QM structure formation confirming the sell
I want to price mitigate the 1H OB above ahead of CPI data release tomorrow.
Happy trading

GBP/USD – 15M | Bearish Setup from Swing High Price is approaching the Swing High and the P1D High after a prior Market Structure Shift (MSS).
If price respects this swing high and rejects, we could see continuation to the downside targeting P1D Low, Swing Low / Equal Low, and ultimately the Order Block (OB) below.
Bearish Roadmap:
1️⃣ Possible rejection at Swing High → entry opportunity.
2️⃣ Break of P1D Low (~1.34100) → continuation toward Swing Low (~1.34000).
3️⃣ Final target into OB (~1.33700) for potential reaction.
Key Levels:
Breaker Block from Left Side: ~1.34700
P1D High: ~1.34550
Swing High: ~1.34300
P1D Low: ~1.34100
Equal Low / Swing Low: ~1.34000
OB: ~1.33700
🎯 Watch for bearish confirmation at Swing High / P1D High zone to align with the overall downside structure.

GBP/USD – 1H | Bearish Continuation SetupPrice rejected from the Rejection Block near the Swing High and P1D High, followed by a Market Structure Shift (MSS) confirming bearish intent.
Currently retesting around the P1D Low — if this level fails to hold, expecting continuation toward the Swing Low and possibly the Equal Low below.
Bearish Roadmap:
1️⃣ MSS after rejection at Rejection Block.
2️⃣ Retest near P1D Low for potential short entries.
3️⃣ Drop toward Swing Low → Equal Low liquidity.
Key Levels:
Rejection Block / Swing High: ~1.34700 – 1.34800
P1D Low: ~1.34100
Swing Low: ~1.33800
Equal Low: ~1.32800
🎯 Watching for bearish confirmation on P1D Low retest for continuation to lower liquidity zones.

GBPUSD INTRADAY BIAS - BULLISH CONITINUATION 11TH AUGUST 2025.Following the bullish internal break of structure on Friday, 8th August 2025, our bias remains firmly on the buy side.
We anticipate a continuation from the key levels highlighted in the daily markup (see attached chart).
Stay sharp and active — opportunities can develop fast.
#TradeUpTeam 📈📉

GBP/USD Update - Potential TargetsDear Friends in Trading,
How I see it,
** CPI Release tomorrow - BE SAFE!
Keynote:
It's always tricky to share an idea Pre-CPI DATA.
I'm watching the 1.33000 psychological area...
I sincerely hope my point of view offers a valued insight
Thank you for taking the time study my analysis.

GBP/USD - PullbackGBP/USD - out of the three ideas posted Sunday night we thought it would continue bullish. Anyway.. Due to immediate bearish break of ORB this morning i guess direction was decided for the day. I will remain overall bullish until 4H bull trendline is broken. A good 30 pips with the break and retest method on ORB.

GBPUSD Directional BiasGBPUSD on monthly has broken a strong low which is marked BOS & MSS. It didn't grab or tag liquidity, it broke it significantly on monthly. There are two BSL marked, which price cab retrace to, but the untapped SSL is expected to be tagged first.
FX:GBPUSD should sell.
LTF next

GBPUSD SHORTDemand from last week’s bias still holding. On the 5m chart, price tapped into 4H demand but instead of pushing long, it formed liquidity — a clear reason for lower prices. Took the short, locked 3RR, and closed.

GBPUSDGBPUSD, if gives us correction here than the push up will be very strong.
Disclosure: We are part of Trade Nations Influencer program and receive a monthly fee for using their tradingview charts in our analysis.

The Day Ahead Data
Italy (June trade): Surplus €7.12 B, above forecast (€6.16 B).
Denmark (July CPI): +2.3% YoY, core +2.2% (up from 1.9% in June).
Norway (July CPI): +3.3% YoY, core (CPI-ATE) +3.1% (up from 3.0%).
Earnings
Barrick Mining: Q2 EPS expected ~$0.44–0.46, revenue ~$3.7–4.8 B. Mali gold output excluded from 2025 forecast due to legal dispute. Results due pre-market.
AST SpaceMobile: Q2 EPS expected –$0.12, revenue ~$6.4 M. Results due after market close.
This communication is for informational purposes only and should not be viewed as any form of recommendation as to a particular course of action or as investment advice. It is not intended as an offer or solicitation for the purchase or sale of any financial instrument or as an official confirmation of any transaction. Opinions, estimates and assumptions expressed herein are made as of the date of this communication and are subject to change without notice. This communication has been prepared based upon information, including market prices, data and other information, believed to be reliable; however, Trade Nation does not warrant its completeness or accuracy. All market prices and market data contained in or attached to this communication are indicative and subject to change without notice.
