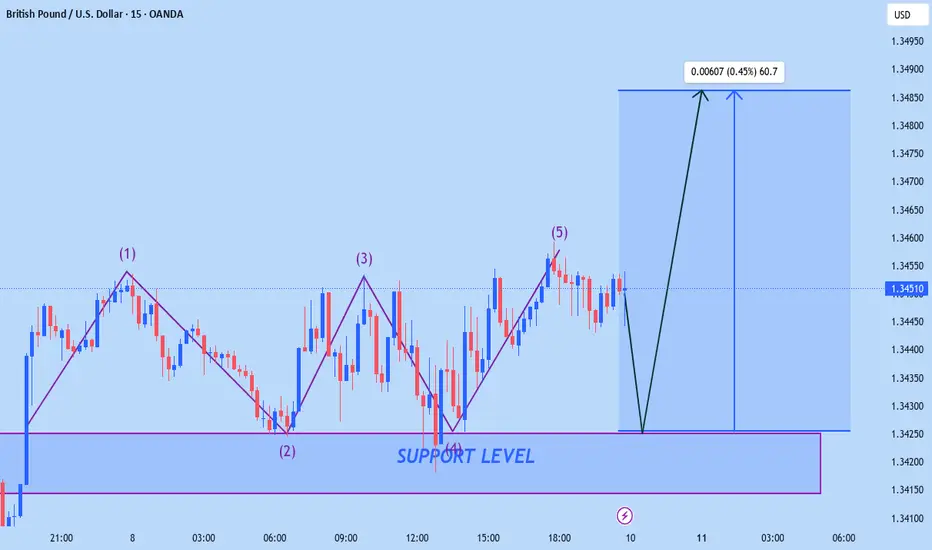
The idea AMD
An obvious Accumulation Manipulation Distribution we wait for a retracement to ride the trend
GBPUSD trade ideas

GBPUSD 11.08.2025~+ BoE Hawkish cut; upward revisions, concerns about Infl., not in a hurry to cut
~+ More Fed members turn dovish; temporary Fed head (Miran) is dovish; expectations that the new appointee is more politically aligned with Trump (dovish)

GBPUSD DAILY TIMEFRAME ANALYSIS, POSSIBLE LIQUIDITIES,STOP HUNTSLooking at the GBPUSD daily chart, here’s the detailed breakdown with possible liquidity zones and stop hunts areas
---
1. Trend Analysis
Macro Structure:
Price has been making lower highs and lower lows since peaking around mid-June 2025 (~1.3790 area), indicating a medium-term bearish trend.
Recent Move:
After bottoming near 1.3150 in late July 2025, price is currently in a corrective bullish retracement towards prior supply zones.
Overall Bias:
Still bearish until price can break and close convincingly above the 1.3550–1.3600 supply area.
---
2. Key Liquidity Zones & Stop Hunt Areas
I’ve identified potential liquidity pools where traders’ stop-loss orders are likely resting:
Above Price (Buy-side Liquidity / Stops above highs)
1.3440 – 1.3460:
Cluster of prior swing highs and your sell limit entries — attractive for stop hunts before a drop.
1.3550 – 1.3600:
Significant supply zone and swing high area from early July. Break above this will likely sweep buy stops before a possible reversal.
1.3790:
The macro swing high from mid-June — a major liquidity target if bulls dominate.
Below Price (Sell-side Liquidity / Stops below lows)
1.3320 – 1.3300:
Previous short-term low — resting sell stops likely here.
1.3150 – 1.3130:
July’s lowest point — a key liquidity pool if price resumes bearish momentum.
1.3000 psychological level:
Strong round number, deeper liquidity magnet.
Red zones (above) → Buy-side liquidity targets at 1.3440–1.3460 and 1.3550–1.3600.
Blue zones (below) → Sell-side liquidity targets at 1.3320–1.3300 and 1.3150–1.3130.
3. Possible Stop Hunt Scenarios
Bullish Trap Scenario (Most probable short-term):
Price could spike above 1.3440–1.3460 to take out stops and fill sell orders before heading back down.
Bearish Trap Scenario:
A sudden drop below 1.3320 could trigger stops, only for price to reverse higher into the 1.3550 zone.
---
4. Summary
Trend: Medium-term bearish, short-term bullish retracement.
Current Zone: Price is testing sell-side patience near a liquidity cluster around 1.3440.
GBPUSD D1 chart marked with the key liquidity pools and potential stop hunt zones:
Red zones (above) → Buy-side liquidity targets at 1.3440–1.3460 and 1.3550–1.3600.
Blue zones (below) → Sell-side liquidity targets at 1.3320–1.3300 and 1.3150–1.3130.
Next Key Reaction Zones:
Upside: 1.3460, 1.3550–1.3600.
Downside: 1.3320, 1.3150.

GBPUSD PRE CPI AND INFLATIONWith inflation numbers due to be released later today I would like to sit on my hands but these are the levels I'm watching to trade.
Daily Chart
Which way do you think this pair would go?


GBPUSD Sell ideaGood evening from this end guys... its KriXtian again
GU traded into a daily OB and induced a 4H FVG , we see a QM structure formation confirming the sell
I want to price mitigate the 1H OB above ahead of CPI data release tomorrow.
Happy trading

GBP/USD – 15M | Bearish Setup from Swing High Price is approaching the Swing High and the P1D High after a prior Market Structure Shift (MSS).
If price respects this swing high and rejects, we could see continuation to the downside targeting P1D Low, Swing Low / Equal Low, and ultimately the Order Block (OB) below.
Bearish Roadmap:
1️⃣ Possible rejection at Swing High → entry opportunity.
2️⃣ Break of P1D Low (~1.34100) → continuation toward Swing Low (~1.34000).
3️⃣ Final target into OB (~1.33700) for potential reaction.
Key Levels:
Breaker Block from Left Side: ~1.34700
P1D High: ~1.34550
Swing High: ~1.34300
P1D Low: ~1.34100
Equal Low / Swing Low: ~1.34000
OB: ~1.33700
🎯 Watch for bearish confirmation at Swing High / P1D High zone to align with the overall downside structure.

GBPUSD INTRADAY BIAS - BULLISH CONITINUATION 11TH AUGUST 2025.Following the bullish internal break of structure on Friday, 8th August 2025, our bias remains firmly on the buy side.
We anticipate a continuation from the key levels highlighted in the daily markup (see attached chart).
Stay sharp and active — opportunities can develop fast.
#TradeUpTeam 📈📉

GBP/USD Update - Potential TargetsDear Friends in Trading,
How I see it,
** CPI Release tomorrow - BE SAFE!
Keynote:
It's always tricky to share an idea Pre-CPI DATA.
I'm watching the 1.33000 psychological area...
I sincerely hope my point of view offers a valued insight
Thank you for taking the time study my analysis.

GBP/USD - PullbackGBP/USD - out of the three ideas posted Sunday night we thought it would continue bullish. Anyway.. Due to immediate bearish break of ORB this morning i guess direction was decided for the day. I will remain overall bullish until 4H bull trendline is broken. A good 30 pips with the break and retest method on ORB.

GBPUSD Directional BiasGBPUSD on monthly has broken a strong low which is marked BOS & MSS. It didn't grab or tag liquidity, it broke it significantly on monthly. There are two BSL marked, which price cab retrace to, but the untapped SSL is expected to be tagged first.
FX:GBPUSD should sell.
LTF next

GBPUSD SHORTDemand from last week’s bias still holding. On the 5m chart, price tapped into 4H demand but instead of pushing long, it formed liquidity — a clear reason for lower prices. Took the short, locked 3RR, and closed.

GBPUSDGBPUSD, if gives us correction here than the push up will be very strong.
Disclosure: We are part of Trade Nations Influencer program and receive a monthly fee for using their tradingview charts in our analysis.

The Day Ahead Data
Italy (June trade): Surplus €7.12 B, above forecast (€6.16 B).
Denmark (July CPI): +2.3% YoY, core +2.2% (up from 1.9% in June).
Norway (July CPI): +3.3% YoY, core (CPI-ATE) +3.1% (up from 3.0%).
Earnings
Barrick Mining: Q2 EPS expected ~$0.44–0.46, revenue ~$3.7–4.8 B. Mali gold output excluded from 2025 forecast due to legal dispute. Results due pre-market.
AST SpaceMobile: Q2 EPS expected –$0.12, revenue ~$6.4 M. Results due after market close.
This communication is for informational purposes only and should not be viewed as any form of recommendation as to a particular course of action or as investment advice. It is not intended as an offer or solicitation for the purchase or sale of any financial instrument or as an official confirmation of any transaction. Opinions, estimates and assumptions expressed herein are made as of the date of this communication and are subject to change without notice. This communication has been prepared based upon information, including market prices, data and other information, believed to be reliable; however, Trade Nation does not warrant its completeness or accuracy. All market prices and market data contained in or attached to this communication are indicative and subject to change without notice.

GBPUSD MIGHT BE DUE FOR CORRECTIONI am waiting for a correction on GBPUSD as we have a flag patten confirmation and divergence on the one hour. It might be due for technical correction. I will hold my hands for long entry.
What is your thought?

GBPUSD Buying Trading Zone: 1.34679-1.34579GBPUSD Buying Trading Zone: 1.34679-1.34579
Stop Loss: 1.34285
Take Profit: 1.35170
Take Profit: 1.35870
*Note: Use 1% of your account balance with proper risk management.


GBP/USD - Weekly Outlook 11.08.25GBP/USD Weekly Outlook: 3 Paths, 1 Plan 📊💷
This week, the market could go in three possible directions — I’m breaking them all down so you’re prepared for whatever the charts deliver. Whether it’s a bullish breakout, a bearish slide, or sideways consolidation, we’ll cover the setups, key levels, and strategies to stay ahead.
Trade smart, stay ready. 🚀📉📈

GBPUSD - Support and resistance levelsGeneral technical background
Bulls are weak: the pair is supported by an attempt to recover from the July decline - a signal for growth was weak employment growth in the US and further uncertainty in market sentiment.
Current signals: Strong Buy on all major timeframes - 1M, Weekly, Daily and even 1 Min. Moving averages give 12 Buy and 0 Sell, technical indicators - 8 Buy, 1 Sell. Overall rating: Strong Buy.
Support and resistance levels
From the closing level of the July candle (1.3203), an upward movement to 1.3539 (14.6% level) is expected - the main scenario.
Alternative: a move higher to 1.3789, with a subsequent rollback to 1.3591.
Key levels broken:
The pair has returned above the resistance zone of 1.36158-1.36330, strengthening the bullish sentiment.
The immediate target is 1.36477 (2025 high). A break above this will open the way to the heights from 2022. Support is held at 1.35804-1.35919.
Positioning around the level of 1.350 and the 50-day EMA:
After an attempt to rise, GBP/USD is testing the level of 1.35 and the 50-day EMA.
A head and shoulders pattern may form. A break of the level of 1.36 may give a strong rise.

GBPUSD | New Week Technical Bias (Market Open)
Overview:
Price has rebounded from recent lows and is now pressing into a daily Inefficiency zone (D-PIZ) and towards BRB where prior sell-side pressure originated. Structure remains broadly bullish on the higher timeframes, but the bearish leg from July is still active and could continue if the current rally stalls.
Scenario 1 – Short Setup in Focus:
Watching the 1.3500–1.3540 region for signs of a microstructure shift or rejection.
A reaction here could trigger a continuation of the descending sequence toward the monthly PIZ.
Scenario 2 – Bullish Invalidation:
If price breaks and holds above 1.3600, with intraday structure turning impulsive to the upside, this would negate my short bias and signal continuation of the bullish leg.
Targets for Shorts:
First stop: reclaiming the 1.3139 low
Primary target: 1.30782 (Monthly PIZ)
Potential extension lower to 1.2944 if momentum builds
Notes:
Premium OCZ higher up is possible before decline but less probable unless used as a liquidity trap.
Price action confirmation in the D-PIZ is key before any short commitment.
⚠️ Strictly technical analysis. No fundamental overlays applied.
SHORT & LONG PROJECTIONS are for reference and not exact execution points.
📌 This is a strategic directional bias, not financial advice. Execute only with confirmation and proper risk management.

Weekly Performance Recap – Week Ending August 9Weekly Performance Recap
Week Ending: August 9
Trades Taken: 6
Results: 5 Wins · 1 Break-even
Risk Model: 3% per trade · 3RR target · Monthly compounding.
Week Outcome: +45% gain
EUROUSD NEW OUTLOOKAccording to M15 analysis eurousd market break the RESISTANCE LEVEL and make RBS (RESISTANCE BECOME SUPPORT)
now market almost at SUPPORT LEVEL
it will fly high from support level if you are interested go long from support level dont be greedy
TRADE AT YOUR OWN RISK
REGARD ALBERT
GBPUSD: Still Forming Higher Highs and Higher LowsLooking to buy again...
(H4)
Current price sits in the upper third of the recent bullish leg, holding above the 1.3390–1.3400 breakout zone.
Demand: 1.3390–1.3405
HTF liquidity pool: 1.3490–1.3505
(H1)
Price closed just under H1 supply at 1.3455–1.3475.
Minor imbalance below at 1.3412–1.3428 — could pull back to fill before continuation.
(M15)
Sideways consolidation near highs — accumulation pattern before a possible continuation.
Liquidity resting both above 1.3475 and below 1.3420.
1) Pullback Buy (Continuation)
🟢Entry Zone: 1.3412–1.3428 (M15 FVG + H1 demand)
Trigger: M15 bullish BOS above 1.3440 after tapping zone
SL: Below 1.3390
TP1: 1.3475
TP2: 1.3505
TP3: 1.3540
2) Breakout Buy (Momentum Play)
Trigger Zone: Clean M15/H1 close above 1.3475
Entry: Retest of 1.3465–1.3475 with bullish confirmation
SL: Below 1.3440
TP1: 1.3505
TP2: 1.3540
TP3: 1.3575
🚫 Invalidation Levels
H1 close below 1.3390 weakens bullish bias and opens door to 1.3330–1.3345 retest.
