GBPUSD(20250807)Today's AnalysisMarket News:
Federal Reserve Chairman Neel Kashkari: A rate cut may be appropriate in the short term, and two rate cuts this year are reasonable. Trump: The new Fed governor will likely be temporary, and the appointment will be announced within 2-3 days.
Technical Analysis:
Today's Buy/Sell Levels:
1.3334
Support and Resistance Levels:
1.3420
1.3388
1.3367
1.3301
1.3280
1.3248
Trading Strategy:
If the price breaks above 1.3367, consider buying, with the first target price being 1.3388. If the price breaks below 1.3334, consider selling, with the first target price being 1.3301 .
GBPUSD trade ideas

Pound-Dollar Intraday Outlook – 6th July 2025 - Long Idea.
Following yesterday’s bullish break of internal structure, our bias remains firmly on the buy side. We’re anticipating a continuation toward the nearest daily resistance level.
Stay sharp and active—opportunities may develop quickly.
#GBPUSD #ForexOutlook #IntradayAnalysis #ForexSignals #TradeSmart #PriceAction #MarketUpdate #BullishBias #TradeUp #ForexTrader

GBPUSD Long Important Correction FX:GBPUSD Long trade, with my back testing of this strategy, GBPUSD long correction.
This is good trade, don't overload your risk like Greedy, be disciplined trader.
Use proper risk management
Looks like good trade.
Lets monitor.
Use proper risk management.
Disclaimer: only idea, not advice

GBPUSD LONGCheck comment for multi-timeframe clean layout due to TradingViews publishing restriction. M5T screenshot also attached.
Price reacting from weekly demand, as mapped out in Monday’s post.
Still expecting a bullish move — unless 4H supply holds again.
Today, demand showed strength across timeframes.
5M demand held firm, aligning with 4H demand.
Waited for price to return to the 5M zone, then dropped to 15s for entry.
Tapped out after 3RR was achieved — no more, no less. same system, same pair
Data never lies.

The Day AheadChatGPT said:
Market Summary – Wednesday, August 6
Key Data Releases:
UK July Construction PMI and Eurozone July Construction PMI provide fresh insight into construction sector momentum amid rate cut hopes.
Germany June Factory Orders and Italy June Industrial Production offer signals on European industrial resilience.
France Q2 Private Payrolls and Eurozone June Retail Sales help gauge consumer and labor market strength.
Japan June Labor Cash Earnings may influence BoJ expectations on wage-led inflation.
Central Banks:
Fed’s Cook and Collins are scheduled to speak—investors will listen closely for clues on the Fed’s policy stance amid rising speculation of a rate cut.
Corporate Earnings:
Heavy day for earnings across sectors:
Tech & Consumer Platforms: Shopify, Airbnb, Duolingo, Lyft, DoorDash, Uber
Media & Entertainment: Walt Disney, DraftKings
Pharma & Healthcare: Novo Nordisk, Bayer, Generali
Energy: Siemens Energy, Occidental Petroleum, Energy Transfer, NRG Energy
Financials: Thomson Reuters, Commerzbank, Carlyle, Global Payments, Vonovia
Industrials & Materials: CRH, Emerson Electric, Rockwell Automation, Glencore, Honda Motor
Cybersecurity & Tech: Fortinet, AppLovin
Auctions:
The US 10-year Treasury auction will be closely watched for demand signals, especially as bond markets weigh the timing of potential rate cuts.
Conclusion:
A data-rich and earnings-heavy day with cross-sector insights, particularly in consumer trends, industrial health, and energy outlooks. Markets may remain sensitive to Fed commentary and the 10-year auction, as macro and monetary signals converge.
This communication is for informational purposes only and should not be viewed as any form of recommendation as to a particular course of action or as investment advice. It is not intended as an offer or solicitation for the purchase or sale of any financial instrument or as an official confirmation of any transaction. Opinions, estimates and assumptions expressed herein are made as of the date of this communication and are subject to change without notice. This communication has been prepared based upon information, including market prices, data and other information, believed to be reliable; however, Trade Nation does not warrant its completeness or accuracy. All market prices and market data contained in or attached to this communication are indicative and subject to change without notice.

GBPUSD SELL IDEA After seeing the daily timeframe reject the moving average in addition to resistance at1.33125 and also a break of 4hr structure support and also trendline area of support, we could be expecting a push into new lows.

Fundamental Market Analysis for August 6, 2025 GBPUSDSterling stays on the back foot ahead of tomorrow’s Bank of England decision: consensus expects the Bank Rate to be held at 5.25 percent, but markets price only one or two modest cuts by year-end as inflation has slowed to 2.6 percent while June retail sales fell 0.9 percent m/m.
Additional pressure stems from fiscal concerns: the UK Treasury warned that GBP 4 billion of spending cuts will be needed in 2026 to keep the deficit at the 3 percent-of-GDP target, stoking stagflation fears and capping the pound’s upside.
The dollar is buoyed by inflows into US yield assets: the 10-year Treasury yield has climbed to 4.47 percent, widening the spread over 10-year gilts to 155 basis points—historically associated with GBPUSD weakness.
Trading Recommendation: SELL 1.32850, SL 1.33050, TP 1.31800

Sell idea on GBPUSD Price looking to retrace back to 1.33369, and drop favouring seller on the market this week.

GBPUSD SHORTFibonacci retracement on the daily. Looking for two entries here. One at 38.2%, as it has retested this zone and didn’t break through. Another at 50% (resistance zone) where it broke through the H&S

GBPUSD – Not the Time to ChaseGBPUSD – Not the Time to Chase 🛑
When trends slow down, they don’t scream — they whisper. 📉 GBPUSD has been climbing, but the rhythm is shifting. Momentum is fading, price is pushing into weekly resistance, and short-term charts are starting to blink red. This isn’t dip-buying territory. It’s caution time.
🚫 I’m bearish on GBPUSD short-term — and I’m not buying dips into support.
Here’s why I’m leaning toward a short:
🔺 Overbought on higher timeframes
📍 Weekly resistance zone rejecting price
🕓 Bearish momentum shift on the 4H chart
🔻 Early signs of selling pressure in price action
📊 Fundamentals support a cautious — not bullish — stance
Let’s unpack it.
🇬🇧 UK data is mixed at best. Growth is improving, yes — but monthly GDP just slipped 📉, and while business investment has picked up, the BoE is still expected to cut. Markets are pricing in a 25bps cut in August ⏳, and GBP sentiment is already softening — net longs were slashed hard last week 📉.
🇺🇸 On the USD side, it’s not strong — but it’s stronger than the positioning implies. The job market remains resilient 💼, inflation is sticky, and the Fed has room to hold. Add to that the fact that USD positioning is extremely bearish (7:1 short bias ⚠️) — and we may be due for a short squeeze or bounce.
This isn’t about chasing momentum. It’s about fading exhaustion. Price is extended, bulls are crowded, and the macro picture is muddier than it looks on the surface.
❗️This is a patience play — not a panic sell or blind buy.
What’s your take? Still long the Pound? Or are you seeing the cracks too? Let’s talk 👇
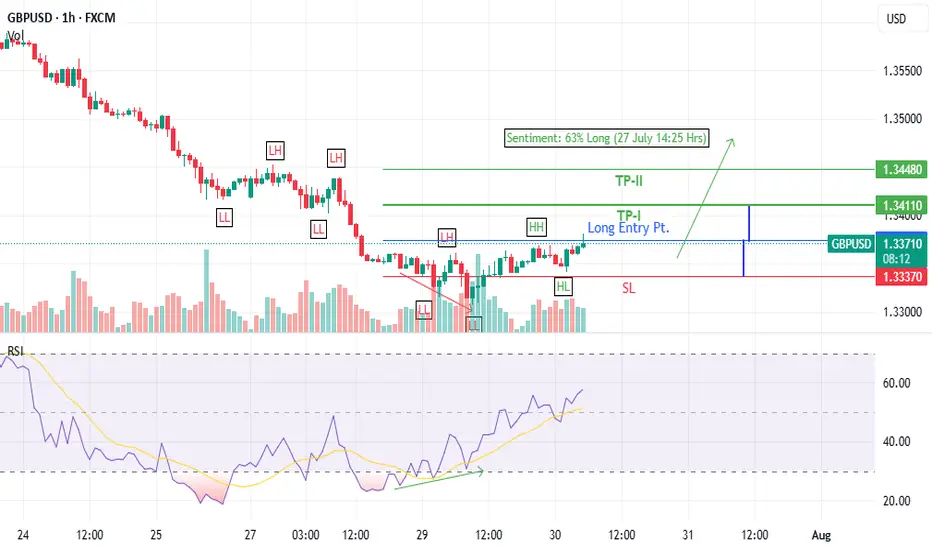
GBPUSD Long trade idea (30 July 2025)- Bullish Divergence on 1-H time frame
- Last LH broken at 1.3361
- Entered at CMP (1.33736)
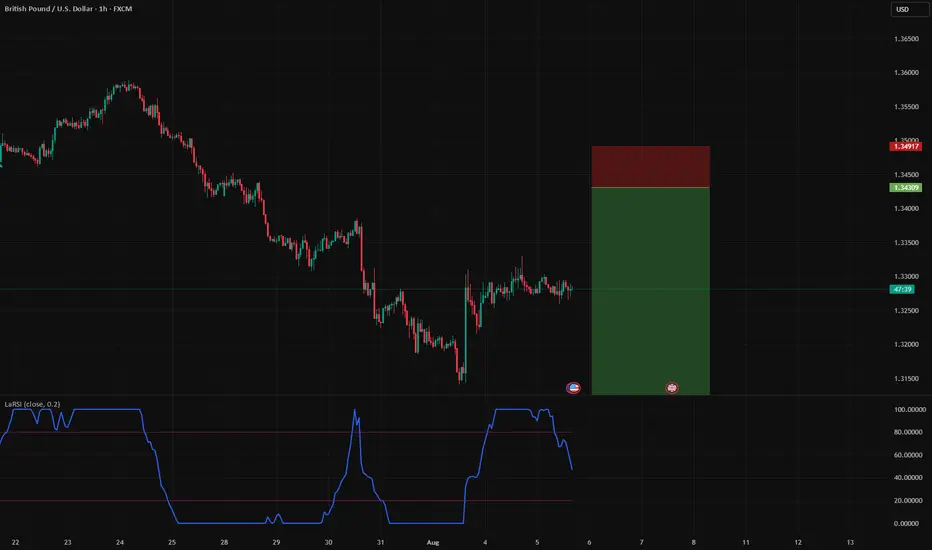
GBP/USD Analysis Based on Volume, Fibonacci & Stochastic
This GBP/USD setup is built on:
Volume Analysis to detect strong price areas
Fibonacci retracement to identify key support/resistance
Stochastic oscillator to find a better-timed entry
🔹 Entry: 1.3270
🔹 Stop-Loss: 1.3298
🔹 Take-Profit: 1.3239
🔹 Risk-to-Reward Ratio: 1.14
⚠️ Disclaimer: This analysis is for educational purposes only and does not constitute financial advice. Please do your own research and manage your risk properly before trading.

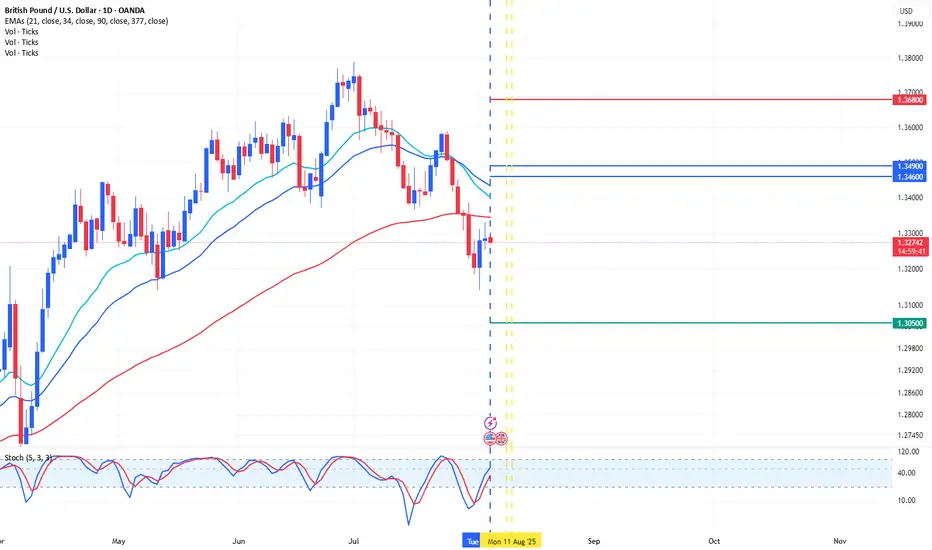
Trading Ideas GBPUSD 1D [Disc On]Technical Analysis:
A bearish pattern has formed on the daily (1D) timeframe, with price action potentially targeting the Fibonacci cluster zone at the psychological level 1.3600 - 1.3490.
Fundamental Analysis:
Fed Interest Rate: 4.50% (in line with expectations)
BoE Interest Rate: (Release date: 7 August 2025)
Conclusion:
High probability for SELL entries in the 1.3600 - 1.3490 zone, with:
(SL): 1.3680
(TP): 1.3050
GBPUSD short at current market priceH1 chart pattern showing buyer is loosing its strength especially with a long wick recorded yesterday (1.3330 to 1.3300, 30pips wick).
i'm short at current market price.
my target is around round number 1.32.
calculate your own risk & reward.
Good Luck

gbpusd buy tradeThe Relative Strength Index (RSI) is showing an upward trend, indicating increasing momentum. Additionally, the Moving Average Convergence Divergence (MACD) is showing a bullish crossover, further supporting the potential for an upward move

GBPUSD LONG4H supply still holding, but I expect a bullish move this week if possible.
Demand was in control on the 5M, creating a clean demand zone with a liquidity sweep.
That gave clear reason for higher prices. Dropped down to the 15s for entry.
Tapped out after 3RR was achieved.
Same system. Same pair. Same outcome.
Zero emotion. Just posting what works.

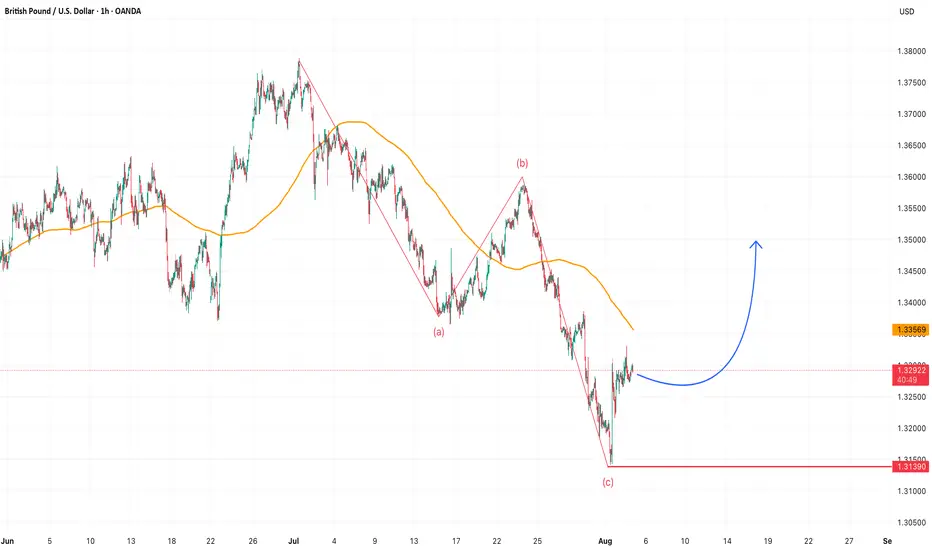
GBPUSD Outlook: Potential Rebound After Sharp CorrectionAfter a strong corrective move, GBPUSD is showing signs of recovery. The recent decline may have completed an ABC corrective wave pattern, indicating that a new upward move could be underway. Traders should monitor for bullish confirmation signals to join the potential uptrend.
GBPUSD(20250805)Today's AnalysisMarket News:
Goldman Sachs: The Federal Reserve is expected to cut interest rates by 25 basis points three times starting in September; if the unemployment rate rises further, a 50 basis point cut is possible.
Technical Analysis:
Today's Buy/Sell Levels:
1.3288
Support and Resistance Levels:
1.3365
1.3336
1.3317
1.3259
1.3240
1.3211
Trading Strategy:
If the price breaks above 1.3288, consider buying, with the first target price at 1.3317. If the price breaks below 1.3259, consider selling, with the first target price at 1.3240

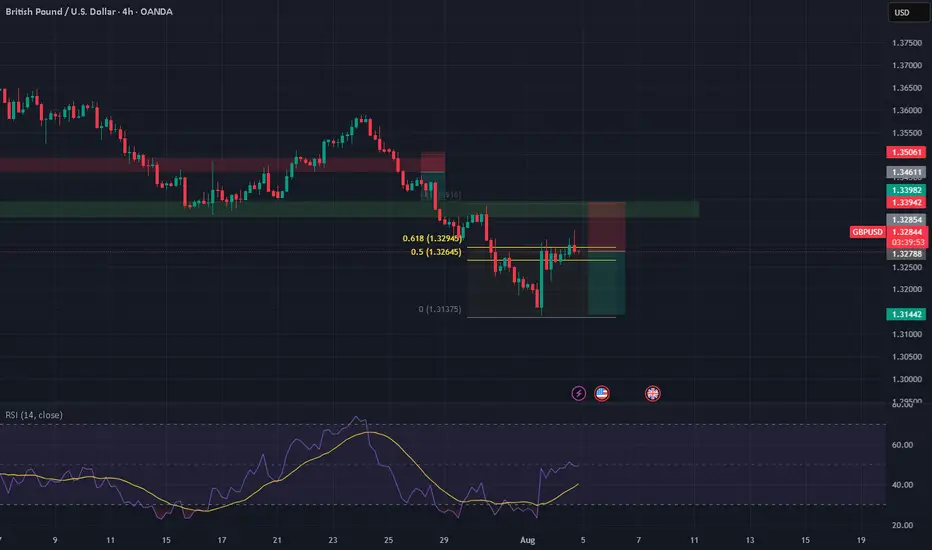
GBPUSD – Short Setup at Fibonacci Golden Pocket ZonePair: GBPUSD
Timeframe: 4H
Bias: Bearish retracement sell
🔍 Technical Outlook:
GBPUSD has retraced sharply from its recent low (1.3137) and is now testing a major resistance zone within the Fibonacci golden pocket (0.618–0.65 retracement) from the recent swing high to low:
This zone aligns with prior supply, creating a high-probability short setup.
🧠 Fundamentals + Sentiment
🇬🇧 GBP – Bearish Tilt
BOE's hawkish rate cut (25bps) failed to boost confidence due to internal voting splits and soft macro data.
Weak retail sales and flattening Services PMI signal slowing momentum.
CFTC data: Longs decreasing, net positioning weakening.
🇺🇸 USD – Defensive Strength
Fed holds at restrictive 4.25–4.50%, remains data-dependent.
US macro data like ISM Services and labor market stable.
USD gains from risk-off flows (VIX at 20.42), especially as GBP weakens.
🌐 Confluence Points:
❄️ Risk-off mood: favors USD safe-haven appeal
📉 GBP weakening across fundamentals
💡 Golden pocket = optimal area for trend continuation sell
📊 RSI suggests momentum exhaustion
✅ Conclusion:
GBPUSD is at a key sell zone, sitting within the Fibonacci golden pocket and prior supply. Unless bulls reclaim 1.3335, the path of least resistance is down. This is a textbook retracement short in line with macro and technical confluence.
GBPUSD IDEAConfluence of weekly FVG and daily EBP. Entry on 4 hour time-frame after 4 hour oder-block taken.

GBPUSD Update — July 16As shown in the pinned analysis from July 16, both of the marked zones played out beautifully and offered solid profits.
I’m still holding my short, and the current level on the chart could be a great area to pyramid the position.
Also, for those who missed the initial move, this might offer a fresh opportunity to join the short side.
📌 We remain open to all scenarios:
If this level breaks upward, we’ll wait for a pullback to go long.
If price reaches this level and offers a valid signal, we’ll enter short.
Rather than trying to predict the market with rigid opinions—like many tend to do on social media—we choose to listen to the market, respond to what it shows us, and follow price action with discipline.
No ego. No bias. Just clarity and flexibility.
🎯 Stay sharp. Stay prepared. Stay profitable.

GBP/USD Target 1 SHORT Target 2 LONG Aeria of Interest for sell and buy, probably movment...
- Real volume
- 5 of RMA (10,20,30,40,50)
- Fibo
- Market Structure
- Supply/Demand

GBPUSD short term LONGHello there, here's my analysis on GU
Price took out LQ on the daily and now we see a QM structure (choch) on the, Monday opens with a bit of bullish strength
I am expecting price to drop back down and take out the BB below the LQ which will be my entry zone and buy to the daily FVG where I prepare for sells … cheers
