GBPUSD short term LONGHello there, here's my analysis on GU
Price took out LQ on the daily and now we see a QM structure (choch) on the, Monday opens with a bit of bullish strength
I am expecting price to drop back down and take out the BB below the LQ which will be my entry zone and buy to the daily FVG where I prepare for sells … cheers
GBPUSD trade ideas

GBPUSD oversold bounce back supported at 1.3180The GBPUSD remains in a bullish trend, with recent price action showing signs of a corrective pullback within the broader uptrend.
Support Zone: 1.3180 – a key level from previous consolidation. Price is currently testing or approaching this level.
A bullish rebound from 1.3180 would confirm ongoing upside momentum, with potential targets at:
1.3370 – initial resistance
1.3430 – psychological and structural level
1.3480 – extended resistance on the longer-term chart
Bearish Scenario:
A confirmed break and daily close below 1.3180 would weaken the bullish outlook and suggest deeper downside risk toward:
1.3140 – minor support
1.3110 – stronger support and potential demand zone
Outlook:
Bullish bias remains intact while the GBPUSD holds above 1.3180. A sustained break below this level could shift momentum to the downside in the short term.
This communication is for informational purposes only and should not be viewed as any form of recommendation as to a particular course of action or as investment advice. It is not intended as an offer or solicitation for the purchase or sale of any financial instrument or as an official confirmation of any transaction. Opinions, estimates and assumptions expressed herein are made as of the date of this communication and are subject to change without notice. This communication has been prepared based upon information, including market prices, data and other information, believed to be reliable; however, Trade Nation does not warrant its completeness or accuracy. All market prices and market data contained in or attached to this communication are indicative and subject to change without notice.

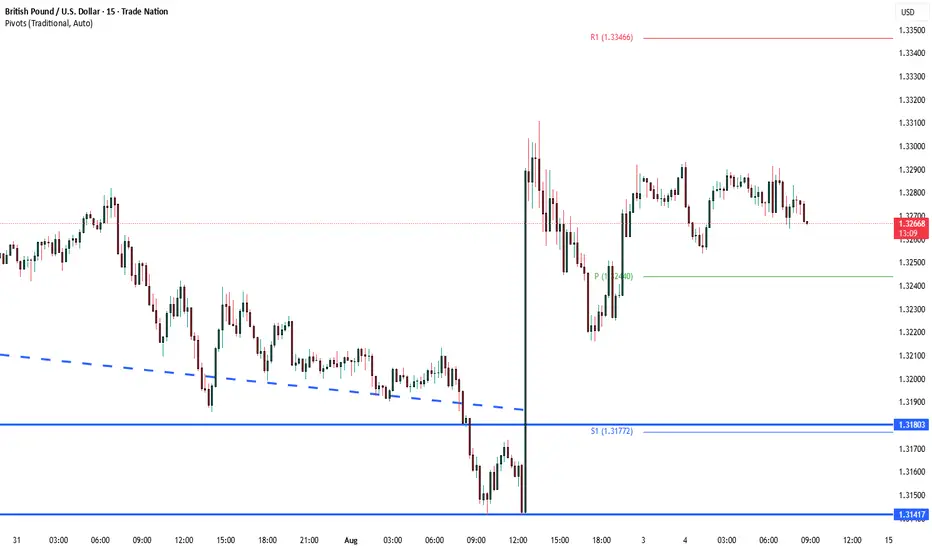
GBPUSD Short Re-Entry at Inverse SIBI Post NFP GBP/USD
Setup Overview
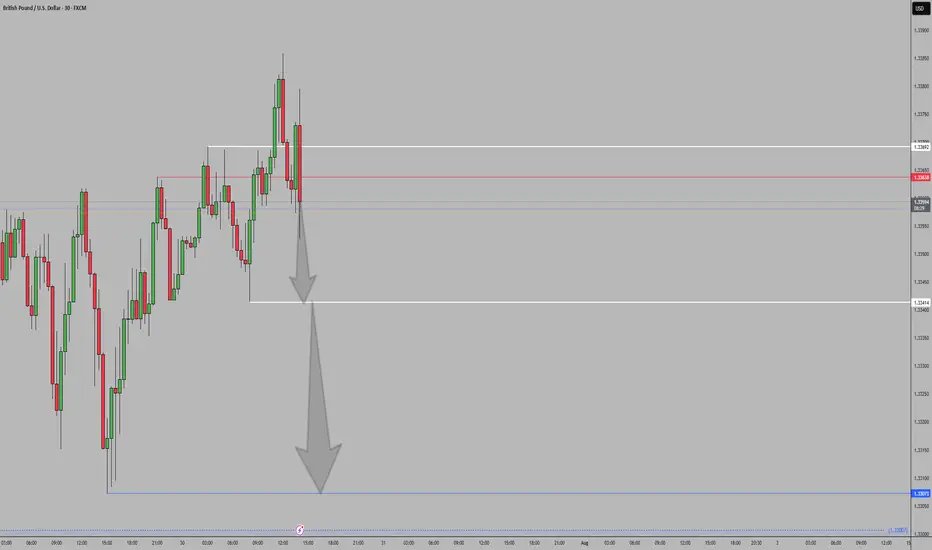
Price opened the week with a gap at 1.32765 following Friday’s underwhelming NFP. Asian session low formed at 1.32535 before a London-session re-entry tapped the inverse 1-hour SIBI level at 1.32765. This retest offers a high-probability short setup, targeting the Asian low and Friday NY PM low for optimal reward.
Entry & Exit Levels
Order Level Pips from Entry
Entry 1.32765 —
Stop Loss 1.32900 13.5
Target 1 1.32535 23
Target 2 1.32161 404
Risk/Reward Ratios
Target 1 R:R ≈ 1.7 (23 pips gain vs. 13.5 pips risk)
Target 2 R:R ≈ 3.1 (41.4 pips gain vs. 13.5 pips risk)
Trade Criteria
Entry triggered on a clear rejection candle at the 1-hour inverse SIBI level (1.32765)
Confirm on volume spike and bearish wick formation
Stop just above the recent high to protect against NFP-driven volatility
Confluence Factors
Weekly opening gap resistance at 1.32765
Friday’s NFP spike tapped into the daily SIBI high
Asian low at 1.32535 and NY PM low at 1.32161 provide clear, logical targets
Notes & Next Steps
Adjust position size to risk no more than 1% of account equity
Monitor US CPI and Fed speaker calendar for potential volatility twists
Annotate this idea on your TradingView chart, set alerts at entry and target levels, and review price action around London close
Good luck with your trade—stay disciplined, and may the odds be in your favor!

The Day AheadMacro Data:
US June factory orders fell 9.3% due to a big drop in aircraft orders. Excluding transport, orders rose 0.2%, but core capital goods fell 0.7%, pointing to weaker business investment. Manufacturing PMI stayed in contraction for a 4th month.
Japan July monetary base fell 3.9% y/y, showing reduced liquidity despite steady interest rates.
Switzerland July CPI was flat, with annual inflation at just 0.1%, staying very low.
Earnings:
Palantir expected strong revenue growth (~+38% YoY) from government and commercial AI work, but valuation is high.
Vertex seen with steady sales and profits from its drug portfolio.
MercadoLibre expected ~28–29% YoY revenue growth from e-commerce and fintech.
Williams Cos forecast stable earnings from energy infrastructure.
Mitsubishi UFJ reports later this week.
Conclusion:
US data points to slowing manufacturing and business investment.
Japan’s monetary base drop signals gradual tightening.
Switzerland’s inflation is very subdued.
Earnings focus is on high-growth names like Palantir and MercadoLibre—markets will watch if results can justify rich valuations.
This communication is for informational purposes only and should not be viewed as any form of recommendation as to a particular course of action or as investment advice. It is not intended as an offer or solicitation for the purchase or sale of any financial instrument or as an official confirmation of any transaction. Opinions, estimates and assumptions expressed herein are made as of the date of this communication and are subject to change without notice. This communication has been prepared based upon information, including market prices, data and other information, believed to be reliable; however, Trade Nation does not warrant its completeness or accuracy. All market prices and market data contained in or attached to this communication are indicative and subject to change without notice.
GBPUSD(20250804)Today's AnalysisMarket News:
① The US non-farm payrolls rose by 73,000 jobs in July, far below the expected 110,000; the previous two months saw a significant downward revision of 258,000 jobs, prompting traders to fully price in two Fed rate cuts before the end of the year.
② The US ISM Manufacturing PMI for July unexpectedly fell to 48, below the expected 49.5 and the lowest level since October 2024.
③ The University of Michigan Consumer Confidence Index for July reached a five-month high.
Technical Analysis:
Today's Buy/Sell Levels:
1.3242
Support and Resistance Levels:
1.3412
1.3348
1.3307
1.3177
1.3136
1.3073
Trading Strategy:
On a break above 1.3307, consider a buy entry, with the first target at 1.3348. On a break below 1.3242, consider a sell entry, with the first target at 1.3177

GBPUSD currency to reach a more consistent bearish expectationsOur analysis found that the current market for the future trend of the currency to reach a more consistent bearish expectations, mainly benefited from the improvement of macroeconomic indicators and liquidity environment easing.
We combined with news and professional analysis reports, identified "policy support", "economic recovery" and other key words accounted for a significant increase in the proportion of market participants in a positive mood, promoting the formation of a long atmosphere.
The capital flow model shows that cross-border capital inflows have increased, and institutional investors are gradually increasing their holdings of the currency, indicating that there is sufficient support on the capital side to enhance the sustained upward momentum of the price.
It is recommended that investors combine the signals from our system to reasonably plan the position layout, especially in the market adjustment to grasp the timing of entry and achieve cost optimization.
Position Management Recommendations:
Layout in batches, control the overall position ratio, avoid over-concentration, and pay attention to risk points in time to ensure capital safety.

GU Long Then, ShortM: Downtrend, made a new low
W: Uptrend, respecting the lows
D: Uptrend, price broke and retested trendline
4H: Downtrend, price broke and retested trendline retraced 50% and hit -27 on 4H fib and reversed to go long
1H: Downtrend, price broke and retested support. Then went aggressively long on NFP news (-jobs)
DXY is show bullish divergence
GU minor and daily trend is showing bearish divergence.
CURRENTLY: I'm looking for price to go long to retest support as resistance, then continue short.

GBPUSD MONDAY ENTRY Looking for price to break through the fib area for a long position. Fundamentals are showing that price will continue to be bullish because of the NFP release last Friday as well as the trade deals.

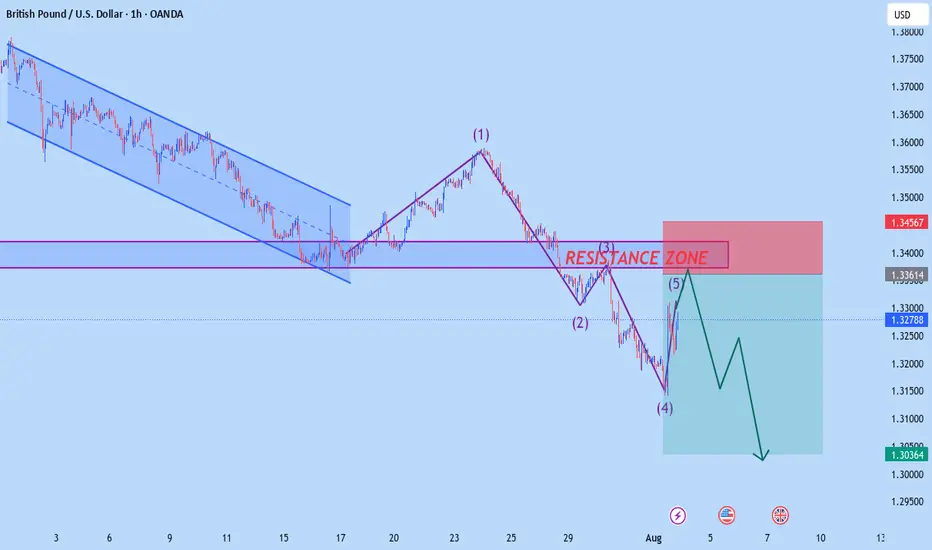
GBP/USD - Potential Targets this WeekDear Friends in Trading,
How I see it,
Let me know if anything is unclear, inputs and questions always welcome.
I don't always have the right answers, but I do share my opinion freely.
Keynotes:
As we are in still in a bearish trend, I will follow the river's current.
NFP could have provided a reversal trend igniter OR a correction candle?
We'll have to wait and see...
I sincerely hope my point of view offers a valued insight
Thank you for taking the time study my analysis.

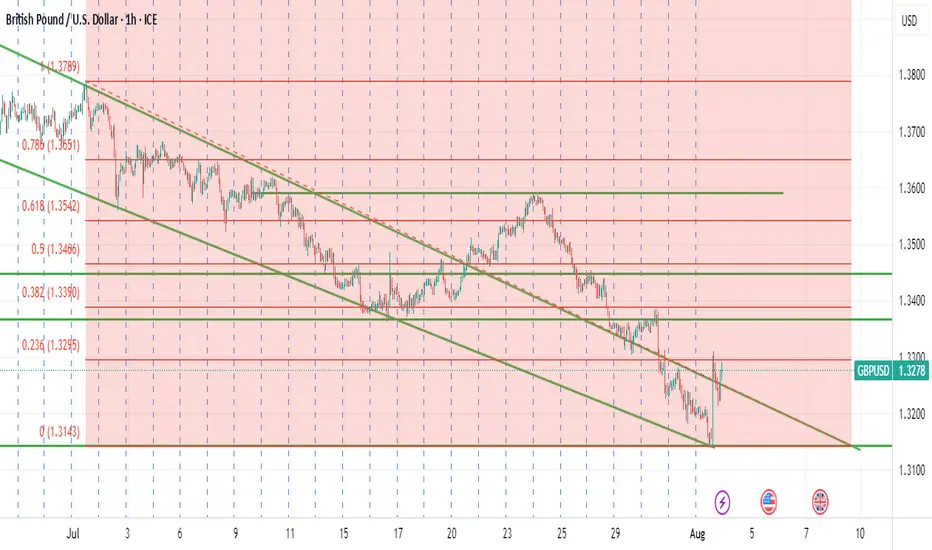
GBPUSD NEW H1 OUTLOOKAccording to H1 analysis GBP market almost at resistance level it will be falling soon from resistance zone we have good oppourtanity to short from here
TRADE AT YOUR OWN RISK
REGARD ALBERT
GBPUSD H1 OUTLOOKaccording to H1 analysis GBP market is at RESISTANCE LEVEL so we have great chance to go short from RESISTANCE LEVEL dont be greedy use money management
TRADE AT YOUR OWN RISK
REGARD ALBERT

Forensic ForexHello Traders! Was limited to recording software this week. This will suffice till we get something better. Thanks for the support.

GBPUSDWeekly review for directional bias
Align trades with institutional positioning
Focus only on setups that confirm sentiment
BIG MOVE UP FOR GBPUSDI was able to enter the trade at the lower low of the downtrend. The reason behind the entry is that the previous candlesticks respected the trend line. I was certain price would reject and retrace.

GBP/USDHello traders!
This is a trade setup for GBP/USD, based on volume and trend analysis.
Entry Price: 1.31947
Stop-Loss (SL): 1.32077
Take-Profit (TP): 1.31707
The trade is intended to be executed instantly at the mentioned price, in alignment with both volume behavior and the current trend direction.
Disclaimer: This setup is shared purely for backtesting purposes and to document trade ideas. It is not financial advice. Always perform your own analysis before making any trading decisions.

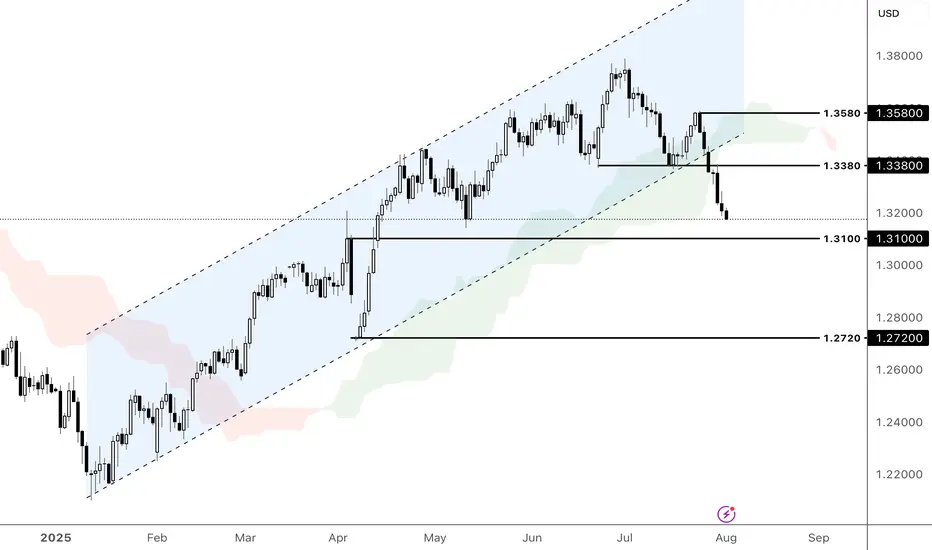
Could GBPUSD break the support at 1.3100?The pound extended its decline amid a stronger dollar and softening UK labour market, which fueled BoE rate cut expectations. From a technical perspective, GBPUSD broke out of the ascending channel and closed below the Ichimoku Cloud. If GBPUSD extends its decline and breaks the support at 1.3100, the price could approach the following swing low at 1.2720. Conversely, a rebound from the support at 1.3100 could prompt a retest of the resistance at 1.3380.
By Li Xing Gan, Financial Markets Strategist Consultant to Exness
GBPUSDAs the USD continues to rise, the GBP is expected to drop further, possibly reaching the previous support at 1.31448.

Fundamental Market Analysis for August 1, 2025 GBPUSDThe pound remains under pressure due to the strengthening of the dollar and expectations of further easing of the Bank of England's policy at its meeting on August 7. The regulator's rhetoric in June-July pointed to a “gradual and cautious” course of rate cuts amid weak growth, and the market is pricing in the likelihood of another move at the next meeting. The situation is complicated by the fact that July inflation in Britain unexpectedly accelerated, but the regulator interprets it as a temporary consequence of tariff and price shocks, not wanting to tighten financial conditions excessively.
The external environment is also unfavorable for the GBP: the US has imposed new tariffs on a number of trading partners, strengthening demand for the dollar as a risk-free asset. For the UK, the trade implications are mixed: part of the supply chain is focused on the dollar zone, and industry is sensitive to global demand, which, in the context of prolonged uncertainty, is hitting investment and employment expectations. The risks of a decline in private sector business activity remain elevated.
Today, attention is focused on US employment data: if the labor market confirms its stability, the likelihood of a Fed rate cut in September will decrease further, which will keep the dollar in the ascendancy. All these factors combined create a bearish bias for GBPUSD in the short term, with any brief rebounds from local oversold conditions typically being used for selling.
Trading recommendation: SELL 1.32000, SL 1.32500, TP 1.31000


GBPUSDI am currently making strategic preparations to engage in the downtrending market for GBP/USD. Upon analyzing the 4-hour timeframe, it is evident that we are witnessing a consistent decline in price, which reflects the overarching downtrend. This observation provides a solid foundation for my trading decisions moving forward

GBPUSD BUYGBP/USD rebounds from lows, back above 1.3200
GBP/USD now alternates gains with losses in the low-1.3200s, reversing an early pullback to the 1.3180 zone. Meanwhile, Cable's inconclusive tone is accompanied by some renewed selling pressuron on the the US Dollar in the wake of US data releases.
Robust macroeconomic data releases from the United States (US) and the Federal Reserve's (Fed) cautious tone on policy-easing fuelled a bullish rally in the US Dollar (USD) midweek, causing GBP/USD to decline sharply.
The US Bureau of Economic Analysis' (BEA) first estimate showed that the United States' (US) economy staged an impressive comeback following the 0.5% contraction seen in the first quarter. The Gross Domestic Product (GDP) grew at an annual rate of 3% in the second quarter, surpassing the market expectation of 2.4%. Additionally, ADP Employment Change came in at 104,000 in July, beating analysts' estimate of 78,000 by a wide margin.
Later in the day, the Fed announced that it maintained the policy rate at the range of 4.25%-4.5% in a widely expected decision. The policy statement showed that Governor Christopher Waller and Governor Michelle Bowman dissented, preferring a 25 basis points (bps) rate cut, which was also anticipated.
In the post-meeting press conference, Fed Chairman Jerome Powell refrained from confirming a rate cut at the next meeting in September, citing heathy conditions in the labor market and explaining that the current policy stance as being appropriate to guard against inflation risks. Moreover, Powell said that the policy was not holding back the economy despite being still modestly restrictive.
According go the CME FedWatch Tool, the probability of a 25 basis points Fed rate cut in September dropped toward 40% from above-60% before the Fed event. In turn, US Treasury bond yields pushed higher and the USD outperformed its rivals during the American trading hours.
The BEA will release Personal Consumption Expenditures (PCE) Price Index data for June on Thursday. Powell said that they expect the annual PCE inflation and Core PCE inflation to come in at 2.5% and 2.7%, respectively. Weekly Initial Jobless Claims will also be featured in the US economic calendar. Ahead of Friday's critical July employment report, investors could remain hesitant to take large positions based on this data.
It's important to note that month-end flows on the last day of July could ramp up volatility toward the end of the European session and trigger irregular movements in the pair.
SUPPORT 1.33727
SUPPORT 1.33128
SUPPORT 1.32590
RESISTANCE 1.3052
RESISTANCE 1.31567

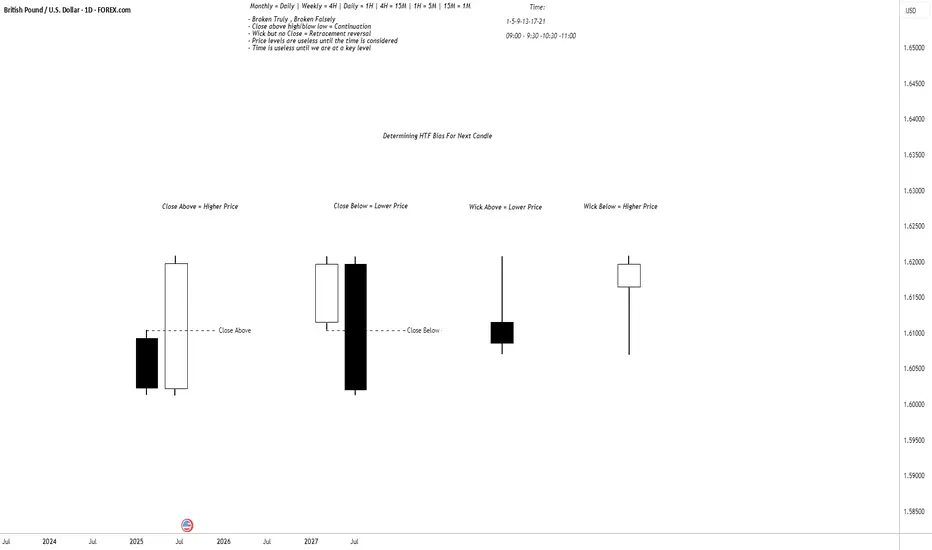
Determining HTF Bias For Next Candle (CRT)The image shows candlestick patterns for determining HTF bias for the next candle based on close and wick positions relative to price levels:
1. Close Above - Higher Price: White candle closing above a key level (bullish bias, suggests upward continuation).
2. Close Below - Lower Price: Black candle closing below a key level (bearish bias, suggests downward continuation).
3. Wick Above - Lower Price: Long upper wick rejected above a level (bearish bias, indicates seller control).
4. Wick Below - Higher Price: Long lower wick rejected below a level (bullish bias, indicates buyer support).