Fundamental Market Analysis for August 1, 2025 GBPUSDThe pound remains under pressure due to the strengthening of the dollar and expectations of further easing of the Bank of England's policy at its meeting on August 7. The regulator's rhetoric in June-July pointed to a “gradual and cautious” course of rate cuts amid weak growth, and the market is pricing in the likelihood of another move at the next meeting. The situation is complicated by the fact that July inflation in Britain unexpectedly accelerated, but the regulator interprets it as a temporary consequence of tariff and price shocks, not wanting to tighten financial conditions excessively.
The external environment is also unfavorable for the GBP: the US has imposed new tariffs on a number of trading partners, strengthening demand for the dollar as a risk-free asset. For the UK, the trade implications are mixed: part of the supply chain is focused on the dollar zone, and industry is sensitive to global demand, which, in the context of prolonged uncertainty, is hitting investment and employment expectations. The risks of a decline in private sector business activity remain elevated.
Today, attention is focused on US employment data: if the labor market confirms its stability, the likelihood of a Fed rate cut in September will decrease further, which will keep the dollar in the ascendancy. All these factors combined create a bearish bias for GBPUSD in the short term, with any brief rebounds from local oversold conditions typically being used for selling.
Trading recommendation: SELL 1.32000, SL 1.32500, TP 1.31000
GBPUSD trade ideas


GBPUSDI am currently making strategic preparations to engage in the downtrending market for GBP/USD. Upon analyzing the 4-hour timeframe, it is evident that we are witnessing a consistent decline in price, which reflects the overarching downtrend. This observation provides a solid foundation for my trading decisions moving forward

GBPUSD BUYGBP/USD rebounds from lows, back above 1.3200
GBP/USD now alternates gains with losses in the low-1.3200s, reversing an early pullback to the 1.3180 zone. Meanwhile, Cable's inconclusive tone is accompanied by some renewed selling pressuron on the the US Dollar in the wake of US data releases.
Robust macroeconomic data releases from the United States (US) and the Federal Reserve's (Fed) cautious tone on policy-easing fuelled a bullish rally in the US Dollar (USD) midweek, causing GBP/USD to decline sharply.
The US Bureau of Economic Analysis' (BEA) first estimate showed that the United States' (US) economy staged an impressive comeback following the 0.5% contraction seen in the first quarter. The Gross Domestic Product (GDP) grew at an annual rate of 3% in the second quarter, surpassing the market expectation of 2.4%. Additionally, ADP Employment Change came in at 104,000 in July, beating analysts' estimate of 78,000 by a wide margin.
Later in the day, the Fed announced that it maintained the policy rate at the range of 4.25%-4.5% in a widely expected decision. The policy statement showed that Governor Christopher Waller and Governor Michelle Bowman dissented, preferring a 25 basis points (bps) rate cut, which was also anticipated.
In the post-meeting press conference, Fed Chairman Jerome Powell refrained from confirming a rate cut at the next meeting in September, citing heathy conditions in the labor market and explaining that the current policy stance as being appropriate to guard against inflation risks. Moreover, Powell said that the policy was not holding back the economy despite being still modestly restrictive.
According go the CME FedWatch Tool, the probability of a 25 basis points Fed rate cut in September dropped toward 40% from above-60% before the Fed event. In turn, US Treasury bond yields pushed higher and the USD outperformed its rivals during the American trading hours.
The BEA will release Personal Consumption Expenditures (PCE) Price Index data for June on Thursday. Powell said that they expect the annual PCE inflation and Core PCE inflation to come in at 2.5% and 2.7%, respectively. Weekly Initial Jobless Claims will also be featured in the US economic calendar. Ahead of Friday's critical July employment report, investors could remain hesitant to take large positions based on this data.
It's important to note that month-end flows on the last day of July could ramp up volatility toward the end of the European session and trigger irregular movements in the pair.
SUPPORT 1.33727
SUPPORT 1.33128
SUPPORT 1.32590
RESISTANCE 1.3052
RESISTANCE 1.31567

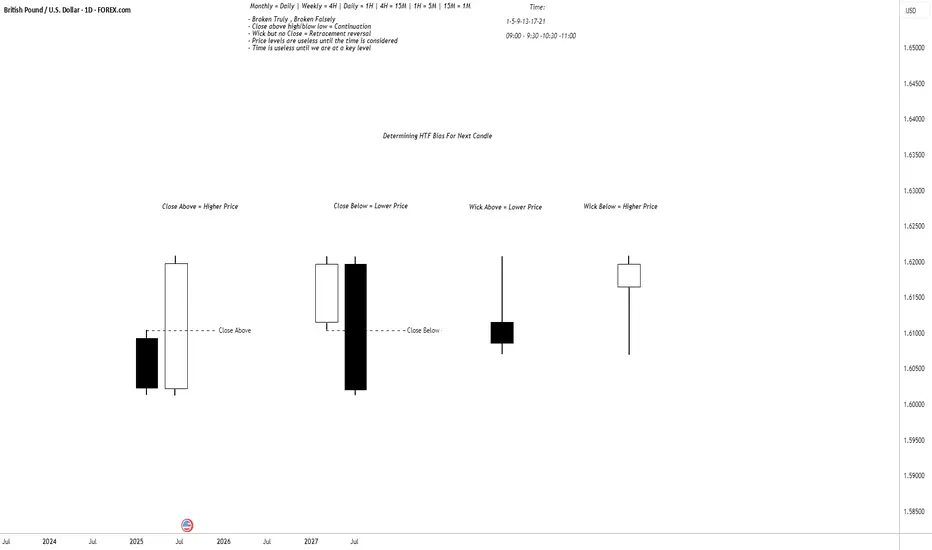
Determining HTF Bias For Next Candle (CRT)The image shows candlestick patterns for determining HTF bias for the next candle based on close and wick positions relative to price levels:
1. Close Above - Higher Price: White candle closing above a key level (bullish bias, suggests upward continuation).
2. Close Below - Lower Price: Black candle closing below a key level (bearish bias, suggests downward continuation).
3. Wick Above - Lower Price: Long upper wick rejected above a level (bearish bias, indicates seller control).
4. Wick Below - Higher Price: Long lower wick rejected below a level (bullish bias, indicates buyer support).
GBPUSD BEARISH POTENTIAL The daily time frame for GBPUSD is showing me that price has formed a head & shoulders pattern, breaking through the former support now resistance level. Price is currently sinking to my 1.31000 mid level, once the level is reached it will either breakthrough or bounce off of it to retrace and continue to build bearish structure.

MORE DOWNSIDE AHEAD Looking at the GBPUSD pair, we can see that the trend has reversed to the downside.
The pair broke a rising trendline to the downside in the past and also formed a head and shoulder pattern.
Also in the past,price broke a resistance which is indicated with blue rectangle and a support which is indicated with a red rectangle to the downside.
I'm seeing price retracing to retest the previously broken structure or support which is indicated with a red rectangle and turning it to resistance, and thereby continuing the downtrend

15-minute timeframe analysis of GBP/USD Trend & Structure:
Overall Trend: Bearish, confirmed by the consistent series of Lower Highs (LH) and Lower Lows (LL).
Downtrend Line: A blue diagonal trendline is drawn connecting recent LHs, acting as dynamic resistance.
Indicators & Tools Used:
Alligator Indicator: Comprising three smoothed moving averages (13, 8, 5) – the lines are wide apart and aligned downward, confirming the downtrend.
Fair Value Gaps (FVG): Marked in red zones showing potential imbalances or inefficiencies in price action where price may return. Recent FVGs are appearing near LHs, implying selling pressure.
RSI Divergence Indicator (14, close):
Current RSI value: 37.72 → indicates bearish momentum.
Previous Bullish Divergences were marked on the RSI where price made lower lows but RSI made higher lows – however, these failed to reverse the downtrend sustainably.
Trade Plan (as per annotation on chart):
Setup: Sell Stop Entry
Entry Level: 1.32048
Stop Loss (SL): 1.32447 (above recent FVG and LH)
Take Profit 1 (TP1): 1.31658 (below last LL)
Rationale: Selling continuation in bearish trend structure without divergence on RSI, supported by trendline and fair value gaps.
Key Support/Resistance Zones:
Resistance Levels:
1.32441 (Stop Loss Zone / recent LH)
1.32386 and 1.32333 (Alligator and FVG overlap)
Support Zone:
1.31658 (TP1 and potential previous demand zone)
Conclusion:
This chart illustrates a trend-following sell setup in a clear bearish structure. The trader is planning to enter short upon a breakdown below 1.32048, anticipating a move toward 1.31658. The lack of current RSI divergence supports the momentum-based bearish continuation.


Continue Short GBPUSDhi ever1 we have new entry for today in short, we hope get 50-60 points, Best Regards

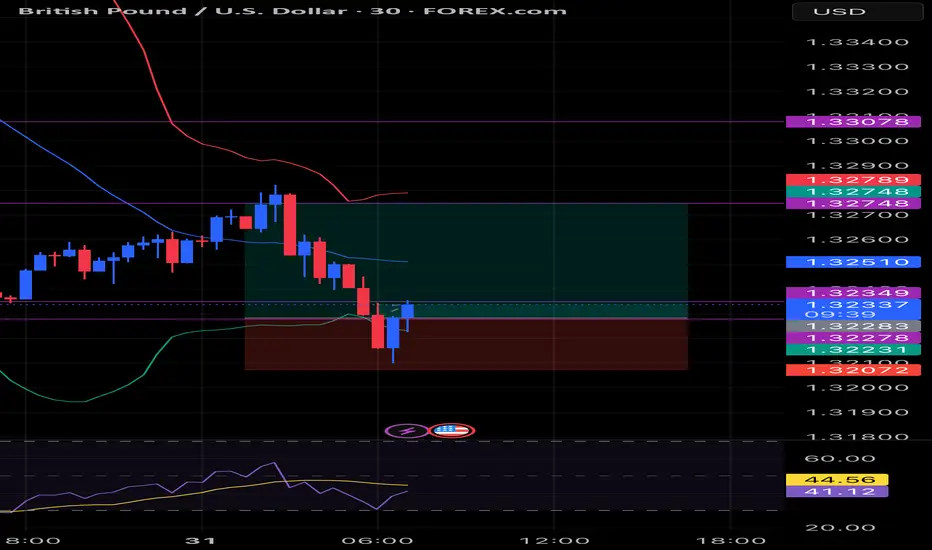
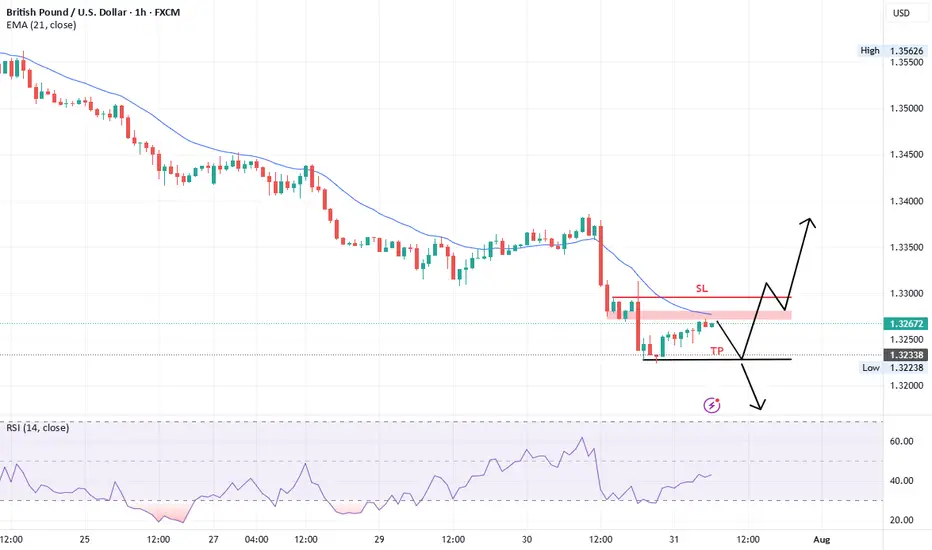
GBPUSD in Trend ReversalGBPUSD is in bullish divergence and we observed an inverse FVG forming suggesting a reversal in trend
Entry Price 1.3237
Stop Loss 1.3200
Risk 1%
Lot 0.68
TP1 1.3274
TP3 1.3348

GBP/USD EVALUATION = PASSGBP/USD EVALUATION = PASS This pair has been on our watchlist and it finally made a break below support with a good pullback into a strong resistance zone, timing was great (morning session), volume was great, engulfing candle great, S/R zone great.......but, momentum was low and although it made the hook, it was not strong enough. Also, we feel the market structure was only in a 2 leg and not 3 leg.
Not every setup deserves our attention — and that’s the point.
This is exactly where most traders go wrong — they force it.
But if we’re truly following a strategy rooted in alignment, discipline means saying no just as confidently as we say yes.
Passing on trades isn’t a missed opportunity.
It’s a mark of growth.

Short idea!Hey all. In my idea, market needs a very deep levels in GBPUSD, as you see Dollar is on a very strong movement and we should look at just for selling. Nodes works great most of the time. be happy(wink).

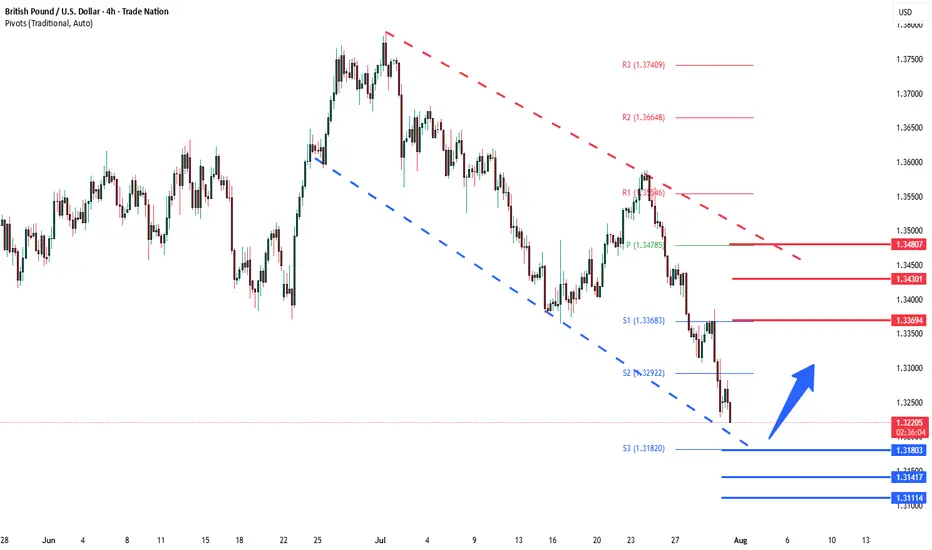
GBPUSD corrective pullback support at 1.3180The GBPUSD remains in a bullish trend, with recent price action showing signs of a corrective pullback within the broader uptrend.
Support Zone: 1.3180 – a key level from previous consolidation. Price is currently testing or approaching this level.
A bullish rebound from 1.3180 would confirm ongoing upside momentum, with potential targets at:
1.3370 – initial resistance
1.3430 – psychological and structural level
1.3480 – extended resistance on the longer-term chart
Bearish Scenario:
A confirmed break and daily close below 1.3180 would weaken the bullish outlook and suggest deeper downside risk toward:
1.3140 – minor support
1.3110 – stronger support and potential demand zone
Outlook:
Bullish bias remains intact while the GBPUSD holds above 1.3180. A sustained break below this level could shift momentum to the downside in the short term.
This communication is for informational purposes only and should not be viewed as any form of recommendation as to a particular course of action or as investment advice. It is not intended as an offer or solicitation for the purchase or sale of any financial instrument or as an official confirmation of any transaction. Opinions, estimates and assumptions expressed herein are made as of the date of this communication and are subject to change without notice. This communication has been prepared based upon information, including market prices, data and other information, believed to be reliable; however, Trade Nation does not warrant its completeness or accuracy. All market prices and market data contained in or attached to this communication are indicative and subject to change without notice.

The Day AheadThursday July 31 - Market Summary
United States:
June personal income rose by 0.2 percent.
June personal spending increased by 0.3 percent.
Core PCE inflation was up 0.2 percent, showing steady disinflation.
The Federal Reserve is likely to stay cautious; no immediate rate cuts expected.
Japan:
The Bank of Japan kept its interest rate at 0.5 percent.
Policymakers signaled possible rate hikes later this year if inflation remains strong.
The yen strengthened, and Japanese equities posted small gains.
China:
Official July PMIs remained weak, with manufacturing below the 50 threshold.
Signals continued sluggish growth momentum.
United Kingdom:
The Lloyds Business Barometer showed slightly improved sentiment in July.
Eurozone:
July inflation figures and June unemployment rate due later today.
Markets watching for signs of inflation persistence or labor market softness.
Canada:
May GDP expected today, with modest economic growth forecast.
Market Implications:
US dollar remains firm due to strong data and delayed Fed rate cut expectations.
Japanese yen is stronger on expectations of further tightening by the Bank of Japan.
US equities are supported by strong earnings and soft inflation trends.
Bond markets are stable with little movement in yields.
Commodities face downward pressure due to weak Chinese data.
Key data to watch today includes US jobless claims, Chicago PMI, Eurozone inflation, and Canadian GDP.
This communication is for informational purposes only and should not be viewed as any form of recommendation as to a particular course of action or as investment advice. It is not intended as an offer or solicitation for the purchase or sale of any financial instrument or as an official confirmation of any transaction. Opinions, estimates and assumptions expressed herein are made as of the date of this communication and are subject to change without notice. This communication has been prepared based upon information, including market prices, data and other information, believed to be reliable; however, Trade Nation does not warrant its completeness or accuracy. All market prices and market data contained in or attached to this communication are indicative and subject to change without notice.

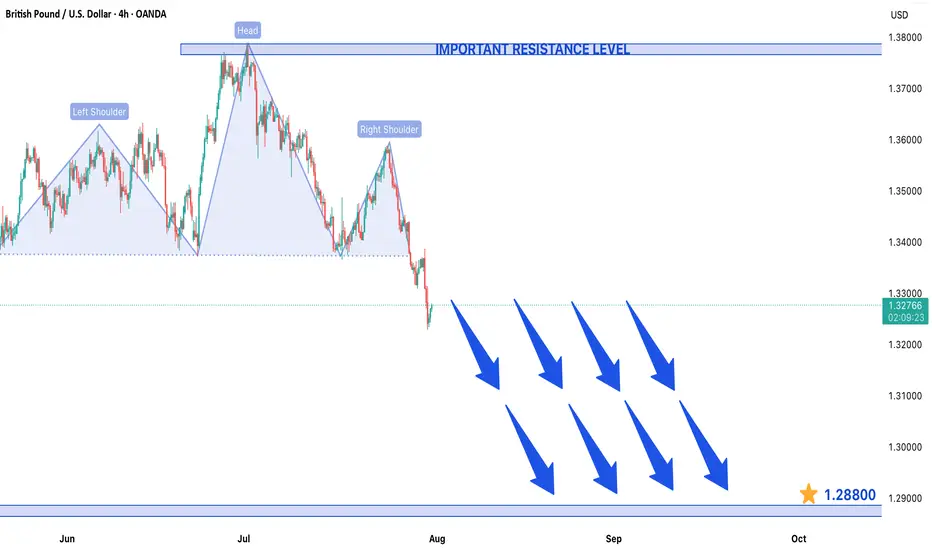
GBP/USD Forms Head and Shoulders Pattern in 4H Timeframe ChartGBP/USD Forms Head and Shoulders Pattern - Bearish Breakdown Expected
The GBP/USD currency pair has developed a clear Head and Shoulders (H&S) reversal pattern on the 4-hour chart, signaling potential weakness ahead. This technical formation - characterized by a central peak (head) flanked by two lower highs (shoulders) - suggests the recent uptrend may be exhausting as sellers gain control.
Current Market Structure
Price action remains confined within a bearish framework, making consistent lower highs and lower lows since failing at the pattern's right shoulder. The pair now tests critical support near the neckline of the H&S formation. A confirmed break below this level would validate the pattern and likely accelerate downward momentum.
Key Levels to Watch
- Downside Target: 1.28800 emerges as the next major support if bearish momentum sustains
- Resistance Zone: The 1.37900 level now acts as formidable overhead resistance
- Neckline Break: A daily close below current support would confirm the H&S pattern
Trading Implications
The technical setup favors:
1) Maintaining short positions while price holds below the right shoulder high
2) Watching for increased volume on breakdown moves to confirm bearish conviction
3) Considering long positions only if buyers reclaim 1.37900 resistance
Risk Factors
Traders should monitor:
- UK inflation data and BoE policy signals
- Fed interest rate expectations
- General USD strength across currency markets
This pattern projects approximately 900 pips of potential downside if fully realized. However, traders should wait for confirmed breakout momentum rather than anticipating the move, as false breakdowns remain possible in current market conditions. Proper position sizing and stop-loss placement above recent swing highs remains essential for risk management.
GBP/USD Long SetupGBP/USD Long Setup
Hello traders,
On the 1-hour chart, we’ve observed a strong bullish candle formation, indicating potential for further upside movement. Based on this setup:
Entry: 1.33650
Stop-Loss: 1.33500
Take-Profit: 1.33880
Exit Plan: We plan to close the trade by the end of the European session.
Trade safely and manage your risk accordingly!
Disclaimer: This is not financial advice. Please conduct your own analysis before entering any trades. Trading involves risk, and you should never risk more than you can afford to lose.

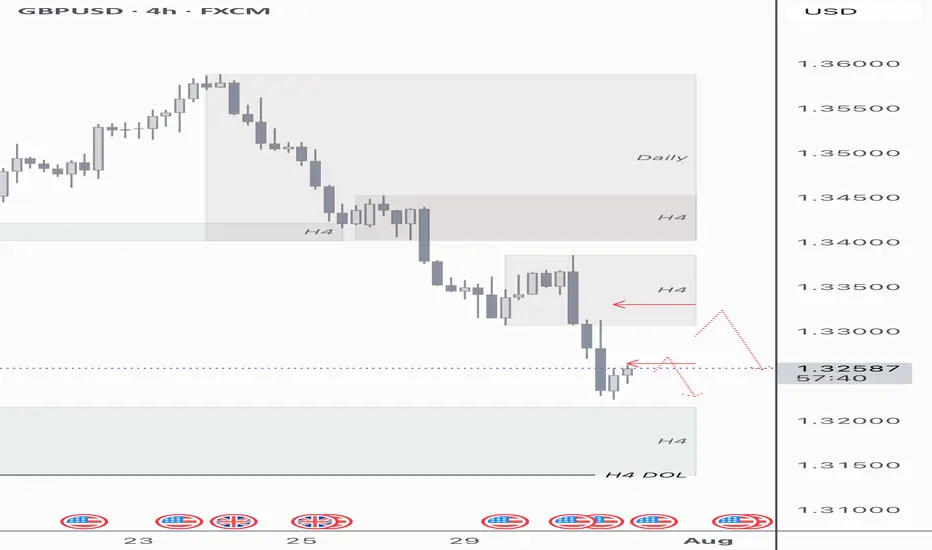
GU 01/08Looking at this current H4 leg trending down, we have levels of H4 supply to come test with some gaps that need filled. We have high impact news incoming, my trading ideas are to follow what I see, we have a H4 demand level from the left which has deeper levels of daily demand with draws of liquidity in the form of lows and equal lows.
My idea is that we clear our H4 imbalance gaps resting within H4 supply and below, hopefully mitigating supply in order to look for continuation shorts into lower demand levels.
GBPUSD SHORTsMarket structure bearish on HTFs 3
Entry at both Weekly and Daily AOi
Weekly rejection at AOi
Previous Weekly Structure Point
Daily Rejection At AOi
Daily EMA retest
Around Psychological Level 1.34500
H4 EMA retest
H4 Candlestick rejection
Levels 5.55
Entry 105%
REMEMBER : Trading is a Game Of Probability
: Manage Your Risk
: Be Patient
: Every Moment Is Unique
: Rinse, Wash, Repeat!
: Christ is King.

GBPUSD how low it will go?The first strong suport I can see at 1.31500 - 1.3100.
This cluster is created by three Fibo Retracement measurements.
I expect price to rebound form there and go up to 1.35400. I don's expect GBP to return to the uptrend - just make a correction and go down again.
Just my opinion.
