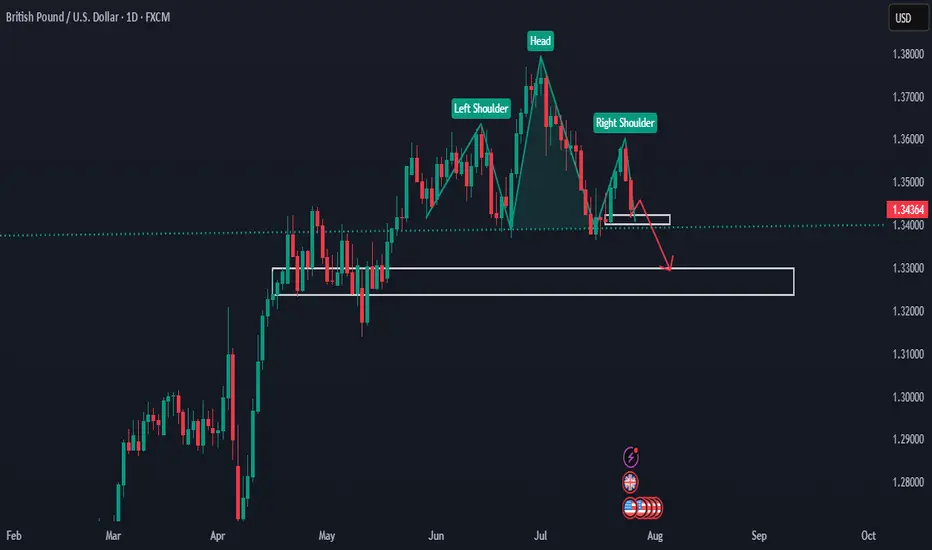
GBP Forming Head & Shoulders - Possible Bearish Scenario AheadHello traders!
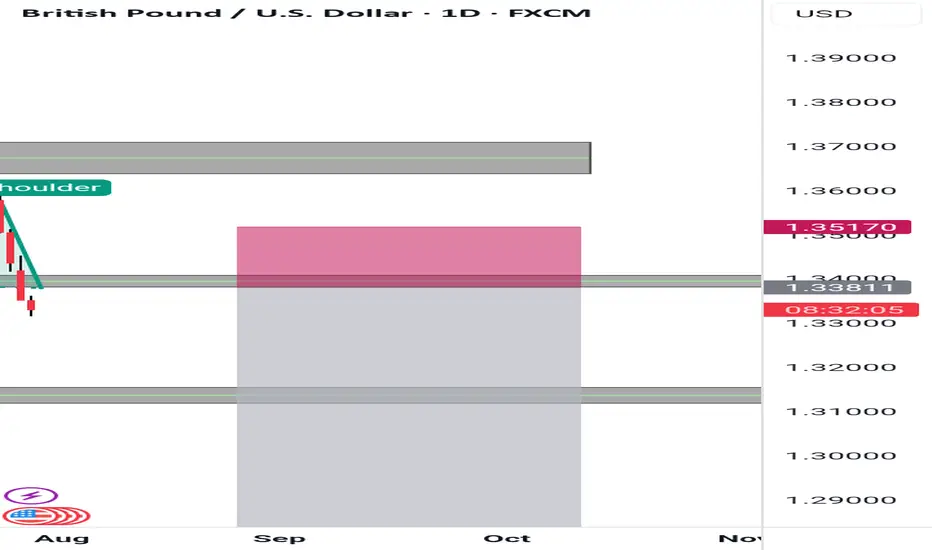
As you can see, price has formed a Head and Shoulders pattern on the daily chart.
If it breaks below the current support/demand area, it could move lower toward the 1.32000 – 1.33000 zone.
We’ll be watching closely to see what it does in the coming weeks.
GBPUSD trade ideas
GBPUSD DOWNSIDE UPDATE The dollar index (DXY00) on Tuesday rose by +0.22% and posted a 5-week high. The dollar has carryover support from Monday following the EU-US trade deal that is seen as favoring the US. Also, expectations for the Fed to keep interest rates unchanged at the end of Wednesday's 2-day FOMC meeting are supportive of the dollar. The dollar extended its gains after the US Jun advance goods trade deficit unexpectedly shrank, a supportive factor for Q2 GDP, and after July consumer confidence rose more than expected.

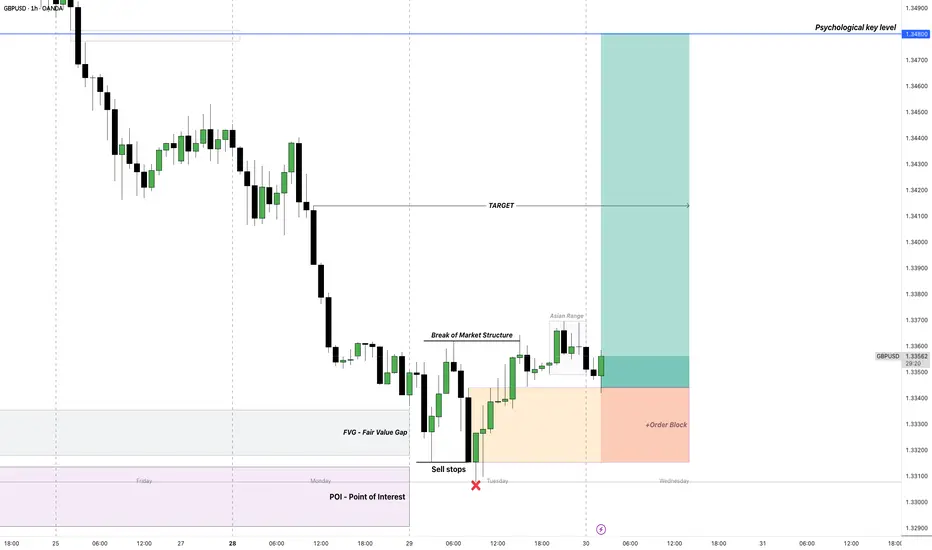
GBPUSD - 30/7/25 - PIvot to bullishYesterday price touched a HTF demand zone that i marked out and on the 1 hour formed a break of structure. This is as per my plan a pivot ore reversal sign.
Now trying to find an entry its trickier. Initially i wanted to enter higher up at the green imbalance that is there, but i noticed equal low liquidity marked as $$$ which i will assume will be taken out. I placed a buy-limit here with a tighter SL than i normally go for, but the TP is the next high.
Today is a high impact news day with the Fed releasing news later today -hence i will not take as many trades.

update Idea GBPUSDthe reteset was good, is it clear previous fall, there is in screen nice setup 3 candles red called 3 crows blacks, only wait market -NY for continue trade

GBPUSD 1H / 1DWait for the price leave the consolidation zone.
If it comes out in Long, wait for the retest in the support and look to enter in Long.
If it goes short, wait for the Retest at resistance and look to go short.

My Trading Journal on GU 30.07.2025GBPUSD has reached a significant point of interest, showing a high level of accuracy with a Fair Value Gap on the higher time frame. This presents an excellent entry opportunity. Additionally, today is midweek, and there are high-impact events to consider. Keep an eye on it as the events unfold.
Short idea!Hello all. after reversing from an LOZ market needs a very special zone for reaction. It would be a Broken Retraced zone and it is right here. be happy (wink)

GBP USD Long Term SellAs we are approaching NFP and FOMC, the outlook for me will be a no rate change and with the consensus being USD Long, it makes sense for GBP USD to sell off. Monthly, Weekly and Daily looking like it wants to continue down after a manipulation bringing GBP USD higher in the short term. A lot of pips to the downside into the end of this week and next week. Definitely one to keep an eye on.

GBPUSD H4 | Bearish continuationThe Cable (GBP/USD) is rising toward a pullback resistance level and may reverse from this point, potentially dropping lower.
Buy entry is at 1.3391, located at a pullback resistance.
Stop loss is at 1.3460, also a pullback resistance, positioned slightly above the 50% Fibonacci retracement.
Take profit is at 1.3318, which is a pullback support level.
High Risk Investment Warning
Trading Forex/CFDs on margin carries a high level of risk and may not be suitable for all investors. Leverage can work against you.
Stratos Markets Limited (tradu.com ):
CFDs are complex instruments and come with a high risk of losing money rapidly due to leverage. 65% of retail investor accounts lose money when trading CFDs with this provider. You should consider whether you understand how CFDs work and whether you can afford to take the high risk of losing your money.
Stratos Europe Ltd (tradu.com ):
CFDs are complex instruments and come with a high risk of losing money rapidly due to leverage. 66% of retail investor accounts lose money when trading CFDs with this provider. You should consider whether you understand how CFDs work and whether you can afford to take the high risk of losing your money.
Stratos Global LLC (tradu.com ):
Losses can exceed deposits.
Please be advised that the information presented on TradingView is provided to Tradu (‘Company’, ‘we’) by a third-party provider (‘TFA Global Pte Ltd’). Please be reminded that you are solely responsible for the trading decisions on your account. There is a very high degree of risk involved in trading. Any information and/or content is intended entirely for research, educational and informational purposes only and does not constitute investment or consultation advice or investment strategy. The information is not tailored to the investment needs of any specific person and therefore does not involve a consideration of any of the investment objectives, financial situation or needs of any viewer that may receive it. Kindly also note that past performance is not a reliable indicator of future results. Actual results may differ materially from those anticipated in forward-looking or past performance statements. We assume no liability as to the accuracy or completeness of any of the information and/or content provided herein and the Company cannot be held responsible for any omission, mistake nor for any loss or damage including without limitation to any loss of profit which may arise from reliance on any information supplied by TFA Global Pte Ltd.
The speaker(s) is neither an employee, agent nor representative of Tradu and is therefore acting independently. The opinions given are their own, constitute general market commentary, and do not constitute the opinion or advice of Tradu or any form of personal or investment advice. Tradu neither endorses nor guarantees offerings of third-party speakers, nor is Tradu responsible for the content, veracity or opinions of third-party speakers, presenters or participants.


GBPUSD LONG im buying GBPUSD because structure break shows buyer control Imbalance creates a natural magnet Lower timeframe confirms the energy

GBP/USD 4H Timeframe AnalysisOn the 4H timeframe, price recently bottomed out at the lower boundary of the channel and has since been hovering within a key support zone for the past couple of days.
My expectation is a potential push back up toward the 50% Fibonacci level of the most recent downward move, before a clearer decision is made. If we reach that level, it would satisfy all the criteria for a bearish flag formation, which could lead to a sudden move to the downside.
Alternatively, price may:
• Retest the ascending trendline before resuming the move down,
• Or break through that trendline, reclaiming bullish momentum back toward the resistance zone, and possibly into the demand area above.
For now, I’m waiting on clear confirmations before committing to a direction.
⚠️ Plenty of USD news on deck tomorrow, so stay patient.
Trade safe — only risk a maximum of 2% of your capital per day and don’t jump in without a solid setup.

GBPUSD short term key levelsThese are short term key levels for intra day and swing trading on 1h chart.
1.3795
1.3541
1.3384
1.3264
1.3129
1.2948
1.2718

GBPUSD(20250730)Today's AnalysisMarket News:
According to a Reuters/Ipsos poll, Trump's approval rating has fallen to 40%, the lowest level since his second term.
Technical Analysis:
Today's Buy/Sell Levels:
1.3339
Support and Resistance Levels:
1.3395
1.3374
1.3360
1.3317
1.3304
1.3283
Trading Strategy:
If the price breaks above 1.3360, consider a buy entry with the first target at 1.3374. If the price breaks below 1.3339, consider a sell entry with the first target at 1.3317

GBPUSD- Daily - H&S PatternReversal Pattern - Bearish Head and Shoulders
Levels - Trendline break and retest - breakdown of the 1.335 level
Price action - 70 day breakout, Strong bearish moves
GBPUSD as a planedThe daily structure remains bullish, though price is currently retracing into deeper levels, potentially targeting areas of inefficiency and liquidity.
On the 4H timeframe, price has:
Formed a valid demand zone
Left behind an imbalance
Built liquidity just below the zone, increasing the chance of a sweep before reacting
📍 Plan:
Wait for a mitigation of the 4H demand zone, ideally accompanied by a liquidity sweep
Then, drop to lower timeframes (M5–M15) to look for:
CHoCH
BOS
Bullish structure for entry confirmation
✅ Price is currently executing as planned, respecting the structure and moving toward our zone of interest. Stay ready to act upon confirmation

we have control in new area short GBPUSDwe have control in new area short GBPUSD, for retest to Asian low, and maybe take control liquidity.
Thanks un advance for keep positions

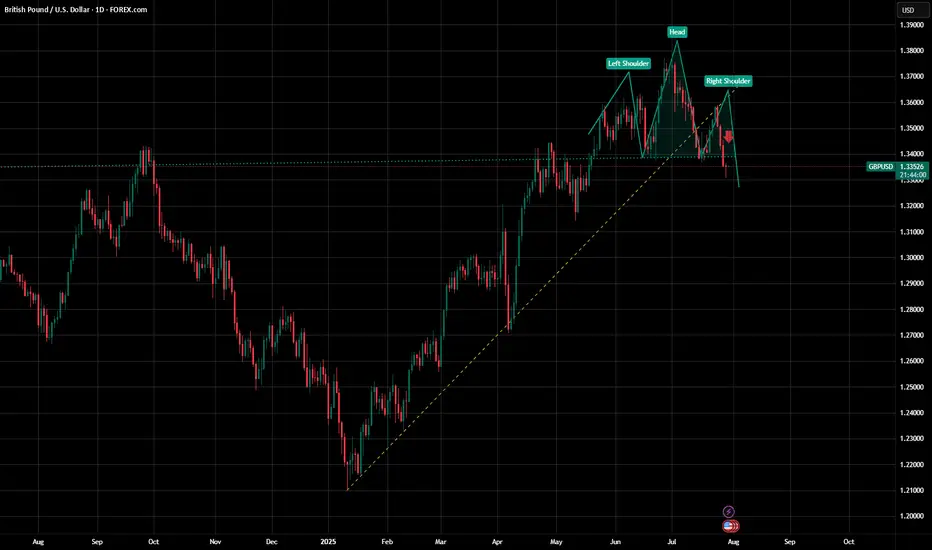
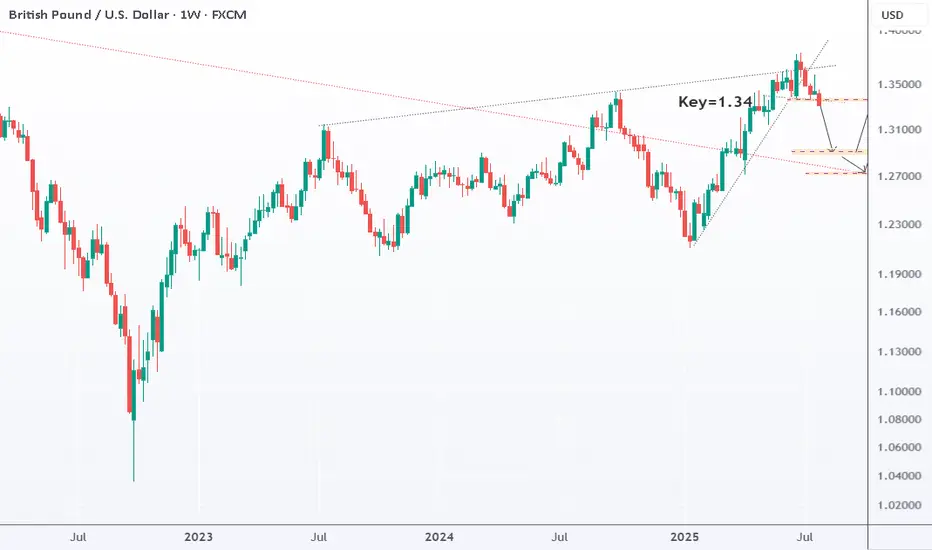
GBPUSD: Bearish toward 1.29 GBPUSD has broken below its recent uptrend and top structure. It’s now heading toward 1.29 and could drop as low as 1.273. That 1.273–1.29 zone is key — if it holds, we could see a new strong uptrend toward 1.40 and above. The bearish move stays in play as long as price remains below 1.34. But the bullish case also stays valid if price holds above 1.273.
Gbpusd for short.Price was previously bullish, formed a head and shoulders pattern, broke the neckline. Wait for retest and short
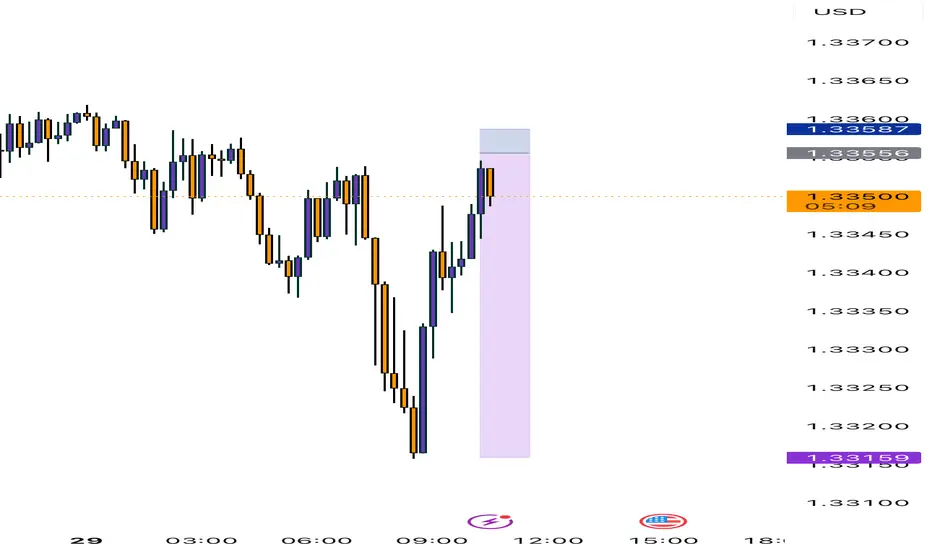
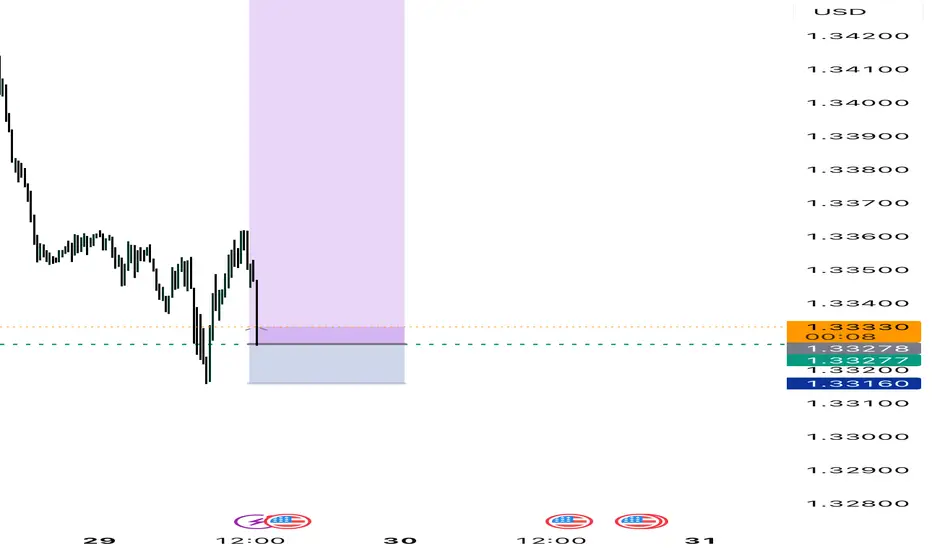
GBPUSD Bullish Retracement into NY KillzoneSetup Break above the Asian high (1.33600) leaves inverse SIBIs at:
4 h – 1.33610
1 h – 1.33440
15 m/5 m cluster – 1.33280
Entry & Stops
Primary: 1.33280–1.33320 (5 m/15 m cluster)
Alternate: 1.33440 retest (1 h SIBI)
Stop: below 1.33150 (Asian low)
Targets
1.33600 (Asian high)
1.33610 (4 h SIBI)
Trade Management
Move SL to breakeven at 1:1 R :R
Scale 20% at TP1
Trail SL beneath each lower‐timeframe SIBI
Watch for volume/VWAP confirmation into NY session
Chart markers: entry zone, SL line, TP levels, SIBI arrows. Trade your edge—let the killzone fuel it.

idea GBPUSDmorning everyone, i continue sell for next hours, i think good mommentum, entry was in 3 min. and we search aroun 60-80 points