GBPUSD – DAILY FORECAST Q3 | W31 | D29 | Y25📊 GBPUSD – DAILY FORECAST
Q3 | W31 | D29 | Y25
Daily Forecast 🔍📅
Here’s a short diagnosis of the current chart setup 🧠📈
Higher time frame order blocks have been identified — these are our patient points of interest 🎯🧭.
It’s crucial to wait for a confirmed break of structure 🧱✅ before forming a directional bias.
This keeps us disciplined and aligned with what price action is truly telling us.
📈 Risk Management Protocols
🔑 Core principles:
Max 1% risk per trade
Only execute at pre-identified levels
Use alerts, not emotion
Stick to your RR plan — minimum 1:2
🧠 You’re not paid for how many trades you take, you’re paid for how well you manage risk.
🧠 Weekly FRGNT Insight
"Trade what the market gives, not what your ego wants."
Stay mechanical. Stay focused. Let the probabilities work.
FX:GBPUSD
GBPUSD trade ideas

GBPUSD Bullish Trade- Spotted Valid Bullish Divergence on 1-H time frame
- Buy stop entry will be made when the bearish trend is overtaken by Bullish trend with the break of last LH
GU 29/08 H4 bearish M15 bearishWe are now within our daily demand zone after purging liquidity, after our sell off from silt supply we still haven’t seen price respect a H4 level of supply, I would like to see price pullback for us to consider shorts from this area of interest.
We can see that M15 OF is still chained bearish in order to look for longs we need to see supply fail and demand takeover, we could however see price continue bearish
I still see all structure as bearish so shouldn’t look for longs until we have out FLOR and bullish intention on the M15

GBPUSD Week 31 Swing Zone/LevelsPEPPERSTONE:GBPUSD keeps giving and simply does.
Strategy for this week is highlighted; sell at the zone and look for buy around 33683.
Zones/Levels are calculated based previous Week X's difference High & Low (dHL)
Trade Parameters:
sl: 10-15pips
dTP: dynamic TP means because momentum can push fast past say 33683, TP is a soft target. However typically 5-10x
As always price action determines trades.

GBPUSDGBPUSD has taken liquidity and is heading towards the 2H ORDERBLOCK at 1.33140 once I’ve reached this zone I will take profit and go long. Taking into account jolts today so be careful of volatility and the possibility of long wicks. I can’t see anymore liquidity underneath so expecting big volume to the upside

Super Sell!Hello all. as you see market reaches to an LOZ and it needs a historical low. As DXY will increasing, it it will falling. Effect of tariff started. be happy and have a super great week(wink)

Ready to go short?!Hello all. I was thinking on GBPUSD. then I found that a Node is left behind. is it possible to left sth. behind at market? I will tell you no. then it is a good Opp to start going short. huge R/R is important here. be happy and have a wealthy life (wink).
and let me tell you sth. """"BE PATIENT""". Today I lose 1.4% of my account just for having no patience.


GBP/USD Outlook Analyse TechniqueThe daily structure remains bullish, but price is currently retracing deeper, likely targeting unfilled areas
On the 4H timeframe, price has:
Formed a valid demand zone
Left an imbalance just above that demand
Engineered liquidity below the zone, increasing the probability of a sweep
📍 Strategy:
Wait for price to mitigate the 4H demand zone and sweep the liquidity beneath
Then, drop to lower timeframes (M5–M15 for the confirmation entry FX:GBPUSD ) and look for:
CHoCH (Change of Character)
Internal BOS
Bullish order flow for a safe entry

GBPUSD SELLIs trading not beautiful? I hope we can say that both in our wins and losses. Back to business, this is just a continuation of the sells.
As you can see, major support has been broken on the H4 chart, and a retest is incoming. A complete retest would be room for an entry to the next low—best of luck guys.

GBPUSD Wave Analysis – 28 July 2025
- GBPUSD broke support zone
- Likely fall to support level 1.3175
GBPUSD currency pair recently broke the support zone between the support level 1.3385 (which has been reversing the price from June) and the support trendline of the daily up channel from January.
The breakout of this support zone should accelerate the active intermediate impulse wave (1) from the start of July.
GBPUSD currency pair can be expected to fall to the next support level 1.3175 (former multi-month low from May, low of the earlier correction (4)).

GBPUSD ShortGBP/USD Short Bias – Target 1.2697
GBP/USD failed to hold above 1.35 and is forming lower highs, signaling bearish momentum.
A break and close below 1.3350 could trigger further downside to 1.3249 → 1.30 → 1.2697 (major weekly support).
MACD: Bearish crossover, momentum fading.
RSI: 38, room to drop before oversold.
Fundamentals: Weak UK data + expected BoE rate cut, while USD strengthens on trade deal optimism.
Plan: Wait for a clean break below 1.3350 to enter short, invalidation above 1.3450.

Candle Close July 2025I made a post about a draw to sell side. Objective met today. unexpected for a Monday but all good. We could continue lower but it's likely we get a pull back or consolidation considering this is the last week of the month thus a candle close for July 2025. let's watch. I'm gonna stay out for the rest of the week. toodles

GBP_USD BEARISH BREAKOUT|SHORT|
✅GBP_USD is going down currently
As the pair broke the key structure level of 1.3380
Which is now a resistance, and after the pullback
And retest, I think the price will go further down
SHORT🔥
✅Like and subscribe to never miss a new idea!✅
Disclosure: I am part of Trade Nation's Influencer program and receive a monthly fee for using their TradingView charts in my analysis.


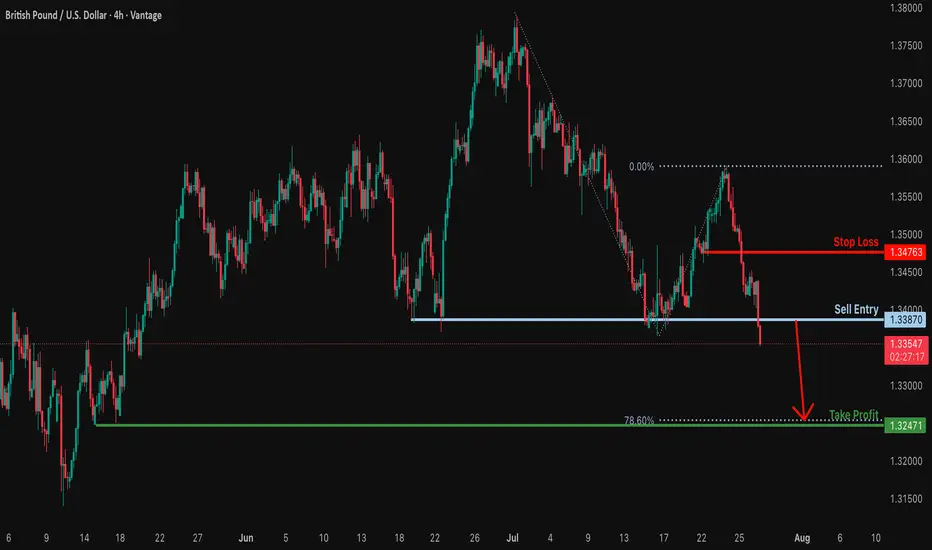
Potential bearish drop?GBP/USD has reacted off the support level which is a multi swing low support and could drop from this levle to our take profit.
Entry: 1.3387
Why we like it:
There is a multi swing low support.
Stop loss: 1.3476
Why we like it:
There is a pullback resistance.
Take profit: 1.3247
Why we like it:
There is a multi swing low support that aligns with the 78.6% Fibonacci projection.
Enjoying your TradingView experience? Review us!
Please be advised that the information presented on TradingView is provided to Vantage (‘Vantage Global Limited’, ‘we’) by a third-party provider (‘Everest Fortune Group’). Please be reminded that you are solely responsible for the trading decisions on your account. There is a very high degree of risk involved in trading. Any information and/or content is intended entirely for research, educational and informational purposes only and does not constitute investment or consultation advice or investment strategy. The information is not tailored to the investment needs of any specific person and therefore does not involve a consideration of any of the investment objectives, financial situation or needs of any viewer that may receive it. Kindly also note that past performance is not a reliable indicator of future results. Actual results may differ materially from those anticipated in forward-looking or past performance statements. We assume no liability as to the accuracy or completeness of any of the information and/or content provided herein and the Company cannot be held responsible for any omission, mistake nor for any loss or damage including without limitation to any loss of profit which may arise from reliance on any information supplied by Everest Fortune Group.
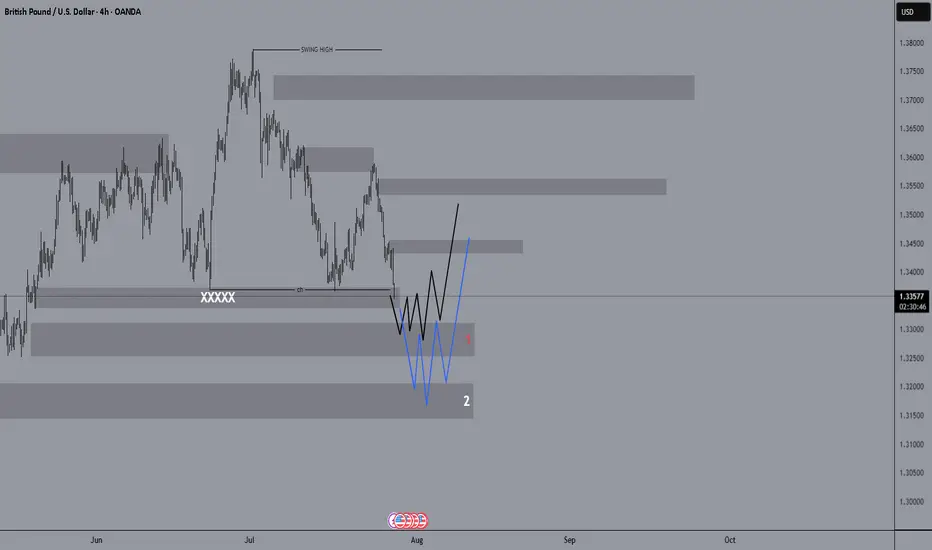
It could be a profitable deal.Hello friends, I hope you have started the week well.
I expect that after the corrections that have occurred, the price will make an upward move from areas 1 and 2, but this move is not a new ceiling because there is a possibility of a market reversal on the daily timeframe, but you should wait for the candles to close.
In the indicated areas, you can look for confirmation on lower timeframes to take a buy trade.
(You can name any currency pair you are interested in in the comments, and our team will share its opinion on that currency pair with you.)
Follow our page to see more analysis.
Gbpusd looks set to buy Gbp has dropped a significant amount and looks nicely poised for a return upwards this week or next days , being in this area and in so e nice support I will be looking to buy especially with this week economical news from USA I would think the seller will want to take his profits here which could tatapult the gb back up into 1,35763 area i will buy at 1.33576 and take profit at 1.35763 a 1.64% rise .

GBP/USD 4H Bearish Reversal Setup. GBP/USD 4H Chart Analysis (July 24, 2025):
Price is rejecting resistance near 1.35709, forming a bearish setup. A short position is highlighted with entry around 1.35067, stop loss above resistance, and target near the 1.33786 support zone. Bears aim for continuation toward 1.33745.

GBP/USD OUTLOOKOn the monthly timeframe, GBP/USD pushed back up this July to retest a key resistance zone, which originally acted as a strong demand area back in January 2022. This level was first tapped again in June, leading to a rejection—and now, July has repeated that pattern, dropping 421 pips from that same zone.
Price is now entering a monthly support level that was previously resistance, showing signs of a potential bounce. My current bias is bullish from this support area, with the expectation that price may begin to climb again from here.
Ideally, I would like to see price eventually reach the next significant demand zone, which was formed in July 2021. However, that level is still quite a distance away, so in the short term, I will be focusing on buy setups.
My plan is to enter longs, placing stop losses just below major daily points of interest (POIs). This approach allows flexibility while managing risk appropriately.
⚠️ Reminder: There is major USD news this week, so it’s crucial to stay disciplined. Always protect your capital and risk no more than 1–2% per day.
Stay patient, stay focused.
Happy trading!

GBPUSD and The Elliott Wave TheoryThis is the continuation of a larger wave that had started earlier. Our Wave 2(Green) was a Zigzag and our Wave 4(Green), a Flat completed when Wave C(Blue) finished. When Wave 4(Green) completed, we see a 5 Wave move begin, thus Wave 5(Green). This 5 wave move is shown in Black. Wave 2(Black) was a Zigzag meaning a Flat should be expected for Wave 4(Black) - more on this later in this article. Wave 3(Black) expressed itself in a 5 wave move, shown in Red. Wave 2(Red) was a Zigzag meaning Wave 4(Red) should be a Flat. We see exactly that when Wave 3(Red) completes -- a Flat for Wave 4(Red). After Wave 4(Red), a Wave 5(Red) forms to complete the 5 wave move for Wave 3(Black) and is marked as so. Wave 2(Black) was a Zigzag and as mentioned earlier, hence Wave 4(Black) should be a Flat. Indeed, a Wave A(Green) forms for the first leg of the Flat, then a B(Green). Currently, we are on Wave C(Green) and upon completion, this would be our Wave 4(Black). After Wave B(Green) completes we see a Wave 1(Orange) form with a 2 or A forming. This has two readings for now because it could be a Zigzag or the first leg of a Flat. Stay tuned for updates.

GBPUSDGBPUSD is in bearish trend.
Potentially printing LH and LL.
No sign of reversal here.
Alligator also indicates that trend will be continue.
We sell at CMP.

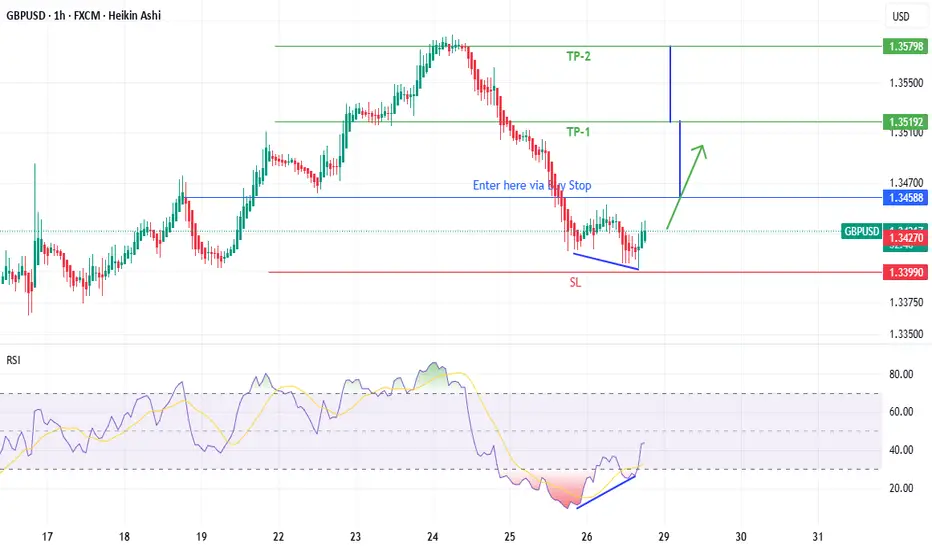
GBP/USD 1H – Potential Bullish Reversal Ahead. Buy stop at BO.GBP/USD has been following a bearish structure, forming consistent Lower Highs (LH) and Lower Lows (LL). However, we’re starting to see signs of weakening bearish momentum, as shown by a clear bullish divergence on our oscillator (e.g., RSI or MACD). This suggests that while the price has made a lower low, the indicator has formed a higher low — a classic early signal for a potential trend reversal.
Currently, the market is in consolidation and preparing for a possible breakout. We are treating this as a neutral zone, awaiting confirmation before entering a trade. The key confirmation will be a break above the previous Lower High, signaling a shift in market structure and the beginning of a bullish phase.
✅ Trade Plan:
🔹 Pair: GBP/USD
🔹 Timeframe: 1H
🔹 Trend: Bearish
🔹 Divergence: Bullish
🔹 Bias: Neutral
🔹 Strategy: Buy Stop Entry at Breakout of Lower High (LH)
🔸 Entry Type: Buy Stop (Pending Order)
🔸 Entry Point (Ep): 1.34555 – Just above the previous LH
🔸 Stop Loss (SL): 1.33999 – Below recent minor swing low
🔸 Take Profit 1 (TP1): 1.35111 – Near short-term resistance
🔸 Take Profit 2 (TP2): 1.35667 – Extended target based on measured move
🔸 Lot Size: 0.17
🔸 Risk to Reward Ratios:
TP1 = 1:1
TP2 = 1:2
💰 Risk: $200
📈 Reward: Up to $400
📌 Why This Setup?
📉 Trend Shift Potential: Break of LH will invalidate the bearish structure.
🔄 Divergence Confirmation: Bullish divergence adds momentum to our thesis.
🔎 Smart Entry: Buy Stop ensures we only enter once confirmation is in place.
📐 Clean Risk/Reward: Defined risk and profit levels make this a disciplined trade.
We’re not chasing the market here — we’re waiting for the market to prove itself. If price breaks the LH, we’re in. If not, we sit out. No emotions, just pure structure and logic.
📊 Summary:
This is a textbook breakout-reversal trade. The bearish trend may be nearing exhaustion, and with divergence already present, a breakout of structure could mark a major shift. Patience is key — let the market come to you.
#GBPUSD #ForexTrading #BullishDivergence #TrendReversal #SmartMoney #TechnicalAnalysis #BreakoutStrategy #BuyStop #FXSetup #PriceAction #ForexEducation #TradingPlan #ForexSignals #tradingview #ForexLife #ForexCommunity #DailyAnalysis #pipcollector #FXReversal
