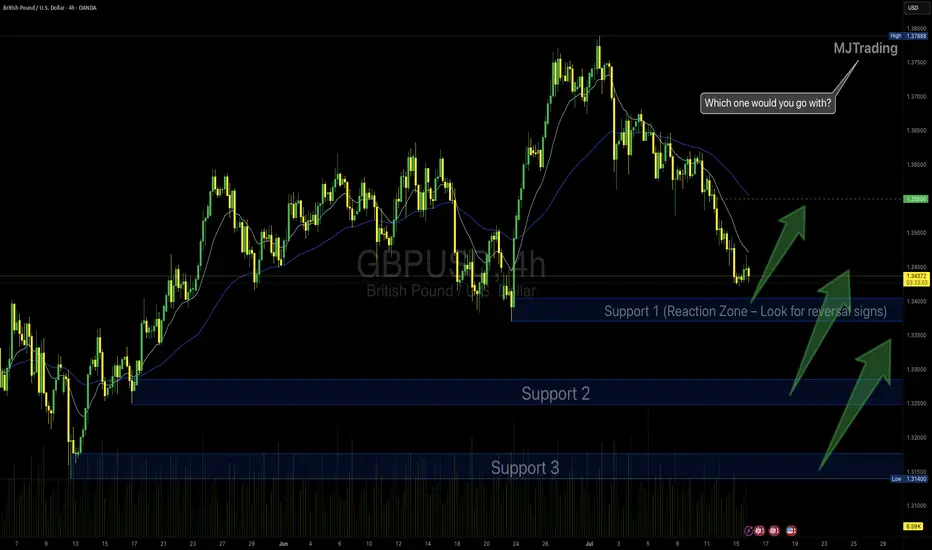
GBPUSD Idea – Demand Zones & Potential Reversal Play🧠 MJTrading:
After a steady downtrend, GBPUSD is now approaching a strong 4H demand zone (Support 1), where we previously saw explosive bullish reactions.
Price is also extended from both EMAs, showing potential for a technical pullback or full reversal.
💡Scenarios to consider:
🔹 If Support 1 holds → we may see a bounce toward 1.3500+
🔹 If broken → Support 2 & 3 offer deeper liquidity and high-probability demand zones
👀 Watch for:
Bullish reversal candles (engulfing / hammer)
Bullish divergence on lower timeframes
Volume spikes on reaction
⚠️ Invalidation:
If Support 3 breaks with strong momentum, we might enter a bearish continuation phase.
#GBPUSD #Forex #ChartDesigner #SmartMoney #PriceAction #MJTrading #ForexSetup #TrendReversal #SupportZones
GBPUSD trade ideas
GBPUSD BUY IDEAWe will be looking into taking the buys as per the chart. I hope this is an idea that resonates with you. Happy trading days

gbpusdwe have active order block on gbpusd and we will wait for confirmation entry dont open position until i active it manually
OANDA:GBPUSD

idea gpbusd Momentum LongWE here in position long based 3 min CHOCH and it reached zone Demmand in H1. i search around 6 to 1 , Best luck Traders

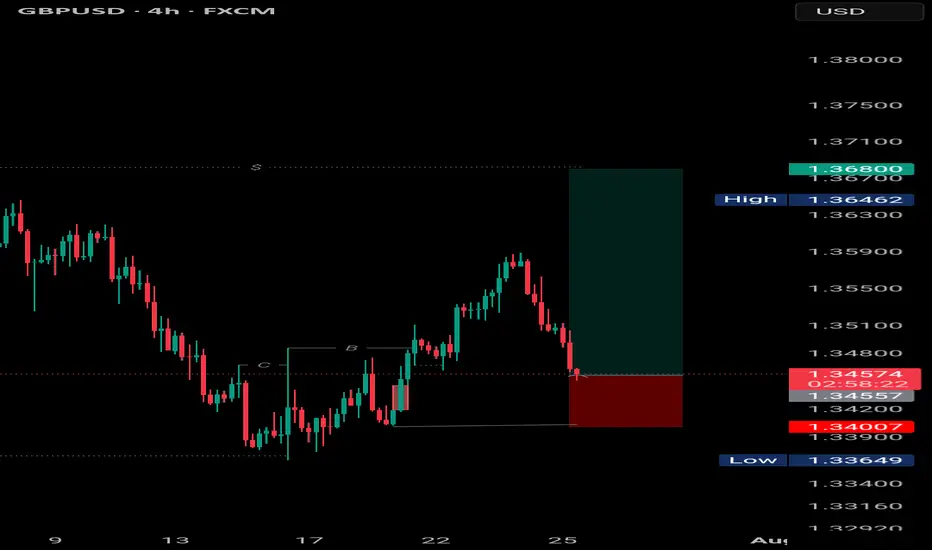
GBPUSD | Bullish Reversal Setup GBPUSD | Bullish Reversal Setup
Price tapped into previous demand zone after forming a clear BOS (Break of Structure). Anticipating a bullish move towards 1.36800.
Entry at key support with a clean RR. Watching closely for momentum confirmation.
#GBPUSD #SmartMoney #ForexTrading #PriceAction #EranseCapital
POUND DOLLAR LONG CONTINUATIONMarket Outlook: GBP/USD
25th July 2025.
The Pound-Dollar pair continues to maintain a bullish market structure, and our approach remains aligned with the prevailing trend. Recently, the price traded above a key 4-hour high, triggering a deeper pullback into discount pricing within the currently active H4 demand zone.
We are now observing price action closely, as this H4 demand level holds potential to serve as the launch point for the next bullish swing. As long as the structure remains intact, we remain buyers from this zone — anticipating a continuation of the upward momentum.

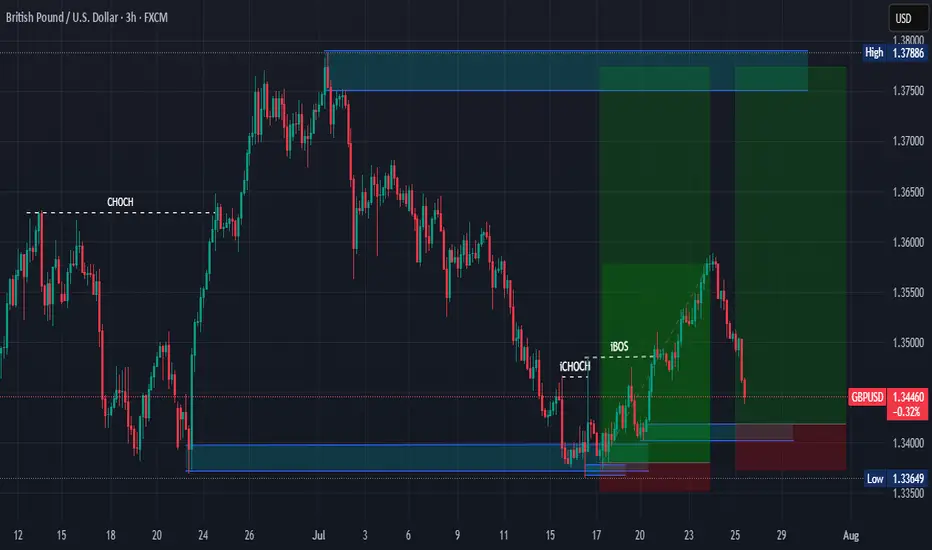
GBP/USD Technical Analysis Anticipating a bullish reversal Price made a CHoCH, followed by a Break of Structure (BOS), confirming a bullish shift.
Currently, price is retracing into a high-confluence zone:
Internal demand (order block)
Imbalance (IMB)
Near the EMA
Reaction expected around 1.34300–1.34600.
If this zone holds, we anticipate a bullish push toward 1.36000+ (better to make a confirmation entry)
GBPUSD BULLISH Technically:
GBPUSD printed HH
GBPUSD retrace at golden zone
At entry point which is previous support most likely became resistance


GBPUSD Long, 25 JulyHigh Risk HL Play from 5m OB + D EMA Support
We’re reacting off a Daily Bearish OB, but price got rejected precisely into the D 50EMA, creating a potential HL. Confluence comes from DXY aligning for a bounce and a 5m OB entry on GU, even though LTF structure isn’t ideal.
📈 HTF Confluence:
✅ Rejection from Daily OB → back to D 50EMA
🔄 Trend unclear, but EMA tap suggests short-term buy opportunity
📍 EMA sits right in the same zone as our LTF POI → stacked confluence
📉 LTF Context:
✅ Asia range formed
✅ DXY also in its Asia + 15m POI zone → supports GU long bias
❌ No LTF BOS or strong structure shift on GU yet
🎯 D Imbalance on GU still unfilled = TP area
🎯 Entry Plan:
✅ 50% position already in from 5m OB tap, which aligns with HTF EMA + DXY 15m POI
⏳ Waiting for 1m BOS to confirm the rest of the entry
❗ This is the last unmitigated OB before invalidation – strong RR if it holds
🛡 SL: Placed below 5m OB to protect structure
📌 TP: D Imbalance above, aligns well with a clean 1:5 RR, but will take partials at asia high or 1:3

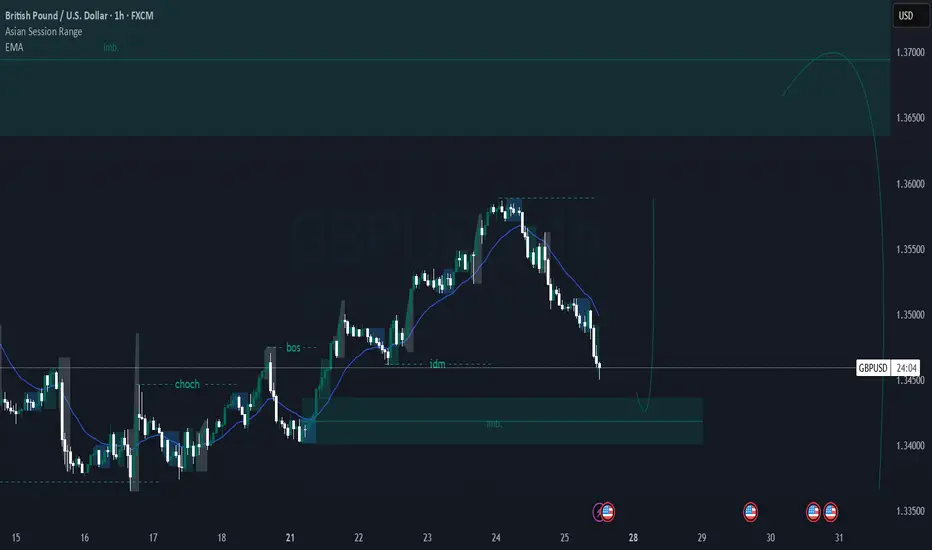
GBPUSD ENTRY CHARTOn this Pair, We are bullish, as the Dollar is still weak and the POUNDS DOLLAR is still in an UPTREND, on the HTF and the MID-TERM-TF, also on the Hourly, we got a Zone with additional confluences that are in align with the Trend, then on our Entry TF, We got a Sweep of LIQ, BOS and IND close to our POI, so we are IN, and if this matches with your TRADE IDEA, i advise you add a good risk management to manage your Trade, THANK YOU.

GBPUSD Support & Resistance Levels🚀 Here are some key zones I've identified on the H1/M15/M5 timeframe.
These zones are based on real-time data analysis performed by a custom software I personally developed.
The tool is designed to scan the market continuously and highlight potential areas of interest based on price action behavior and volume dynamics.
Your feedback is welcome!

#GBPUSD: Going As Expected, Strong Move AheadHey Everyone,
We have a good opportunity coming up on gbpusd; since our last update on gbpusd, price went as expected. We will see huge increase in price in coming days. Good luck and take care!!
If you like our work then please like and comment.

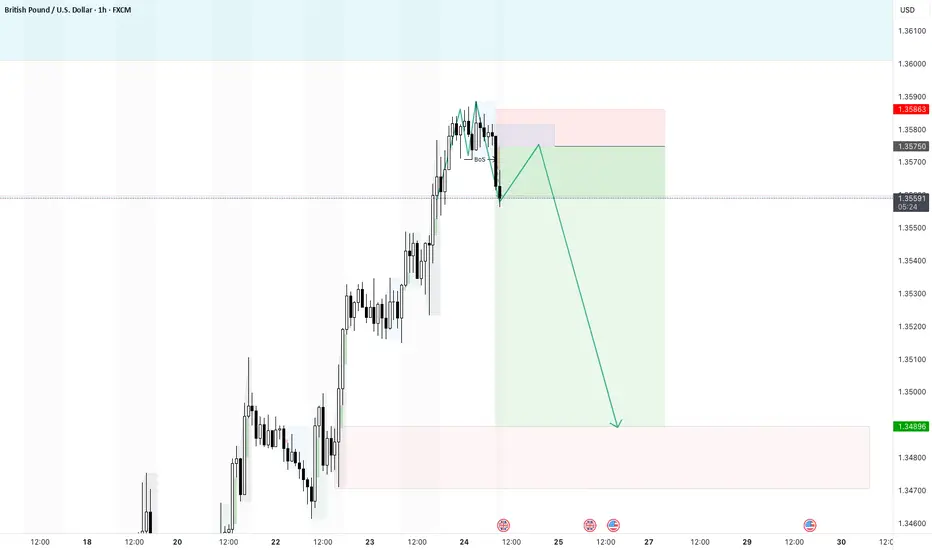
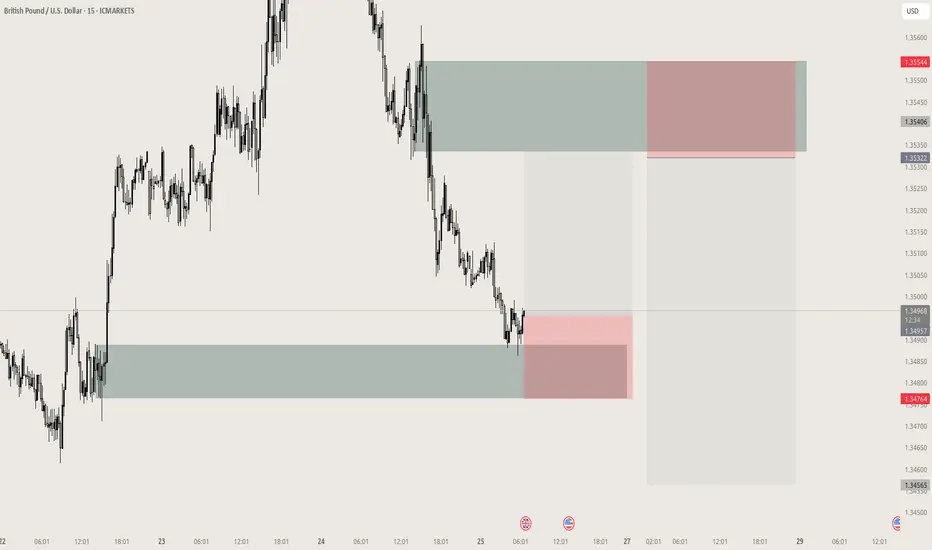
GU 25/071. we have taken out a level of H4 demand, however to confirm our new bearish intent we need to see a H4 level of supply hold this being our first level of respect.
2. at the current moment M15 structures are chained bearish showing us the desire for price to continue lower, we do have further H4 gaps below with H4 demand as our potential targets so we could trade with continuation lower, we just have to be wary that we are within a H4 demand zone if we wish to look for shorts
3. because we havent seen a H4 level of supply hold, i would be interested to see if price comes back to this zone, to confirm or disprove our intention.
As they say, trade what you see not what you anticipate so in this instance I am seeing bearish orderflow on the M15, a level of demand broken on the H4 so I am seeing shorting oppurtunities until proven wrong. In order to consider longs id want to see from the current H4 demand zone were in, a level of M15 supply fail typically with a sweep of a low, then M15 demand hold as the FLOR (first level of respect) followed by a second failure of supply where id then look for a long opportunity from the new demand area!
On another note its friday, its been a long week for me with work and other tasks so I hope you all have a great weekend also, ciao!

MY SHORT BIAS ON GBPUSDIf you're looking for an opportunity to scalp on GBPUSD, this is my BIAS, although I missed in, but my analysis is already in profits

Pull back on GBPUSDThe clear break of structure gives me confidence that a short trade is possible today. Ideally i want a retest of the imbalance and then a push down. My TP is quite far at the moment and i may take profit earlier or move my SL.
GBP USD shortpossible after bullish rally today is a busy day we may see a correction in the trend
Please note: This is for educational purposes only and not a trading signal. These ideas are shared purely for back testing and to exchange views. The goal is to inspire ideas and encourage discussion. If you notice anything wrong, feel free to share your thoughts. In the end, to learn is to share !

After Breaking Downward Trend, GBPUSD Ready for Upward Rally!GBPUSD
N.B!
- GBPUSD price might not follow the drawn lines . Actual price movements may likely differ from the forecast.
- Let emotions and sentiments work for you
- ALWAYS Use Proper Risk Management In Your Trades
#audusd

GBPUSD Morning routineGBPUSD long into short, liquidity has been prepared last Tuesday and yesterday.
GBPUSD Q3 | D25 | W30 | Y25 FUN COUPON FRIDAYGBPUSD Q3 | D25 | W30 | Y25
Daily Forecast🔍📅
Here’s a short diagnosis of the current chart setup 🧠📈
Higher time frame order blocks have been identified — these are our patient points of interest 🎯🧭.
It’s crucial to wait for a confirmed break of structure 🧱✅ before forming a directional bias.
This keeps us disciplined and aligned with what price action is truly telling us.
📈 Risk Management Protocols
🔑 Core principles:
Max 1% risk per trade
Only execute at pre-identified levels
Use alerts, not emotion
Stick to your RR plan — minimum 1:2
🧠 You’re not paid for how many trades you take, you’re paid for how well you manage risk.
🧠 Weekly FRGNT Insight
"Trade what the market gives, not what your ego wants."
Stay mechanical. Stay focused. Let the probabilities work.
FRGNT
FX:GBPUSD

GBPUSD NEW BULLISH LOOKAccording to M15 analysis gbpusd market is near to touch support zone
it is very best chnace for buyer to buy from support level
dont be greedy use money managment
TRADE AT YOUR OWN RISK
REGARD ALBERT

GBPUSD H4 Bullish Reversal Based on the H4 chart analysis, the price is approaching our buy entry level at 1.3404, a pullback support that aligns with the 50% Fib retracement.
Our take profit is set at 1.3555, a pullback resistance.
The stop loss is placed at 1.3404, a swing low support.
High Risk Investment Warning
Trading Forex/CFDs on margin carries a high level of risk and may not be suitable for all investors. Leverage can work against you.
Stratos Markets Limited (tradu.com ):
CFDs are complex instruments and come with a high risk of losing money rapidly due to leverage. 63% of retail investor accounts lose money when trading CFDs with this provider. You should consider whether you understand how CFDs work and whether you can afford to take the high risk of losing your money.
Stratos Europe Ltd (tradu.com ):
CFDs are complex instruments and come with a high risk of losing money rapidly due to leverage. 63% of retail investor accounts lose money when trading CFDs with this provider. You should consider whether you understand how CFDs work and whether you can afford to take the high risk of losing your money.
Stratos Global LLC (tradu.com ):
Losses can exceed deposits.
Please be advised that the information presented on TradingView is provided to Tradu (‘Company’, ‘we’) by a third-party provider (‘TFA Global Pte Ltd’). Please be reminded that you are solely responsible for the trading decisions on your account. There is a very high degree of risk involved in trading. Any information and/or content is intended entirely for research, educational and informational purposes only and does not constitute investment or consultation advice or investment strategy. The information is not tailored to the investment needs of any specific person and therefore does not involve a consideration of any of the investment objectives, financial situation or needs of any viewer that may receive it. Kindly also note that past performance is not a reliable indicator of future results. Actual results may differ materially from those anticipated in forward-looking or past performance statements. We assume no liability as to the accuracy or completeness of any of the information and/or content provided herein and the Company cannot be held responsible for any omission, mistake nor for any loss or damage including without limitation to any loss of profit which may arise from reliance on any information supplied by TFA Global Pte Ltd.
The speaker(s) is neither an employee, agent nor representative of Tradu and is therefore acting independently. The opinions given are their own, constitute general market commentary, and do not constitute the opinion or advice of Tradu or any form of personal or investment advice. Tradu neither endorses nor guarantees offerings of third-party speakers, nor is Tradu responsible for the content, veracity or opinions of third-party speakers, presenters or participants.
