GBPUSD trade ideas

GBPUSD BUY SETUPGBPUSD has double bottom on a support zone and we are likely to see it going up , but lets see how see things go

GBPUSD BUY IDEAWe will be looking into taking the buys as per the chart. I hope this is an idea that resonates with you. Happy trading days
GBPUSD BUY IDEATREND - UPTREND
What's currently happening is a retracement/retest of the previous high for continued buys to the next resistance. H4 close will be confirmation for entries

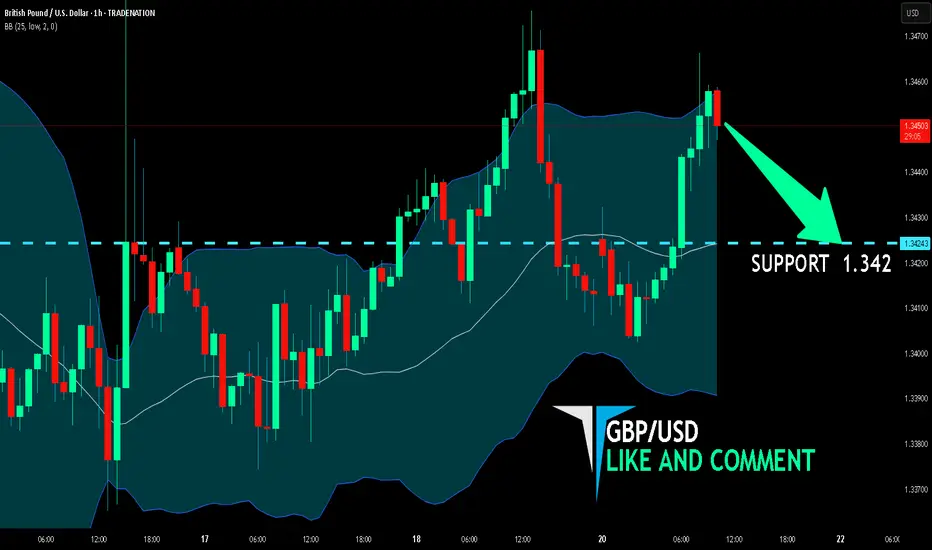
GBP/USD BEARISH BIAS RIGHT NOW| SHORT
Hello, Friends!
We are targeting the 1.342 level area with our short trade on GBP/USD which is based on the fact that the pair is overbought on the BB band scale and is also approaching a resistance line above thus going us a good entry option.
Disclosure: I am part of Trade Nation's Influencer program and receive a monthly fee for using their TradingView charts in my analysis.
✅LIKE AND COMMENT MY IDEAS✅
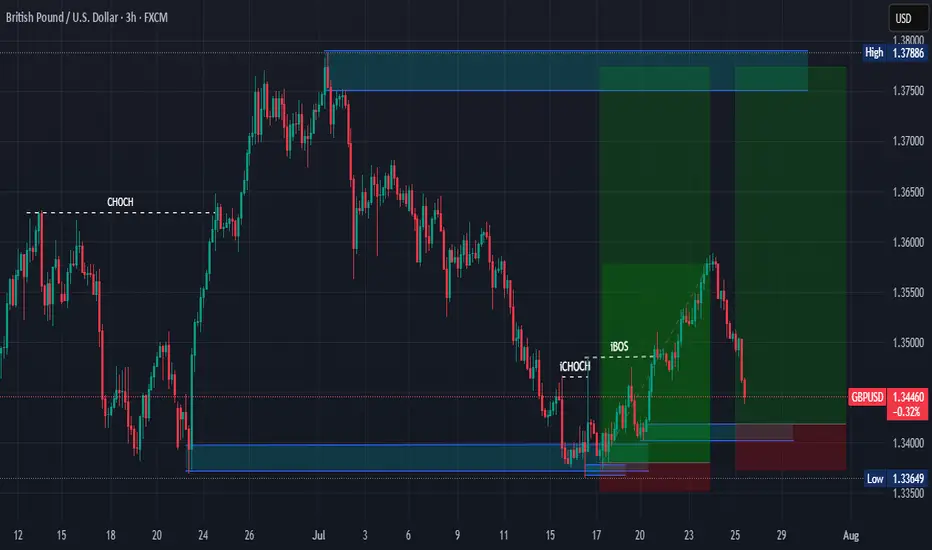
BUY SETUP FOR GBPUSDGU is on an overall uptrend with a daily retest. When I went down to a lower timeframe from the daily retest, I found the sequenced that caused a CHOCH. Wait for retest in one of those zones before buying to my blue line. If price breaks and closes below the last lower low, that will potentially cause a continuation to the downside.

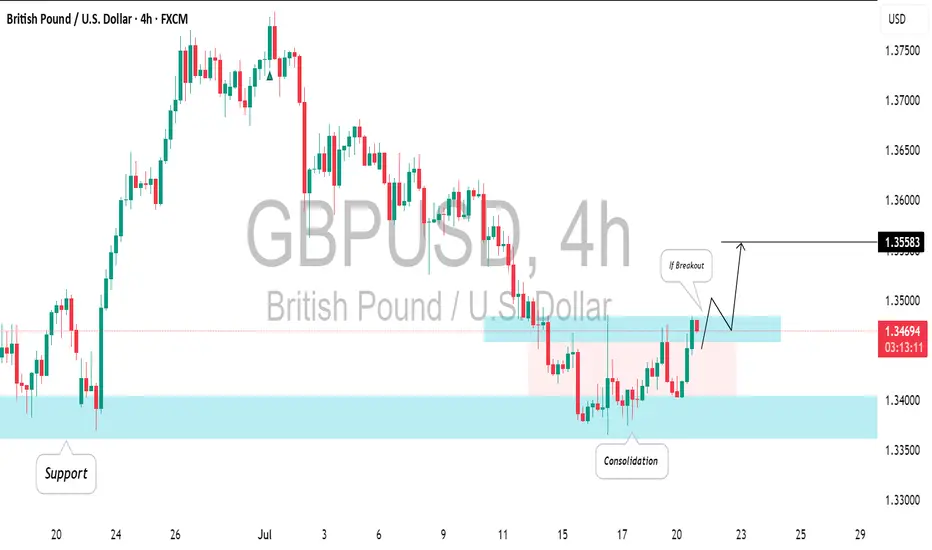
GBPUSD: Your Trading Plan For Today ExplainedThe GBPUSD is currently consolidating at a solid intraday/daily support level.
To enter a buy position with confirmation, it's advisable to wait for a breakout on the 4-hour chart.
A breakout followed by a 4-hour candle closing above the horizontal resistance will serve as a strong bullish signal, with a target of 1.3558.
Conversely, if the price makes a new lower low on the 4-hour chart, this setup will be considered invalid.
24.07.25 Morning ForecastPairs on Watch -
FX:GBPCAD
FX:GBPUSD
FX:AUDNZD
A short overview of the instruments I am looking at for today, multi-timeframe analysis down to what I will be looking at for an entry. Enjoy!

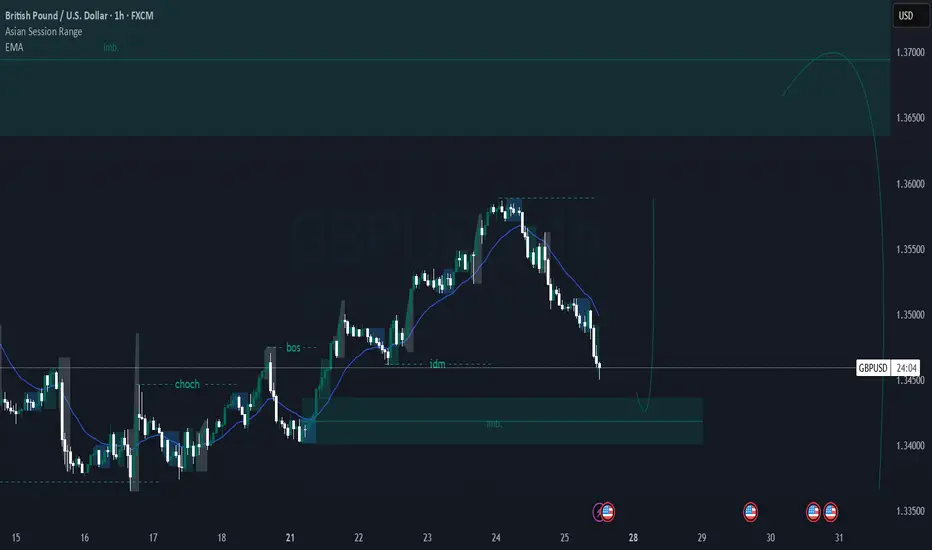
GBP/USD Technical Analysis Anticipating a bullish reversal Price made a CHoCH, followed by a Break of Structure (BOS), confirming a bullish shift.
Currently, price is retracing into a high-confluence zone:
Internal demand (order block)
Imbalance (IMB)
Near the EMA
Reaction expected around 1.34300–1.34600.
If this zone holds, we anticipate a bullish push toward 1.36000+ (better to make a confirmation entry)
GBPUSD - market structureGBPUSD - market structure , easy and clean chart, of course this is no analysis, use risk and trade managment
The bearish wave recovery ends and a new bullish wave begins✏️ OANDA:GBPUSD After a long downtrend that touched the important support zone of 1.138 GBPUSD has recovered to the upside. The h4 candle has just closed above the accumulation zone of 1.345 to continue the upward momentum towards the peak of 1.367. The price line also created a trendline supporting the main uptrend of the pair, and the price line can follow the uptrend to the Target.
📉 Key Levels
Support: 1.345 - 1.338
Resistance: 1.360-1.367
Buy Trigger: Rejects above 1.345
Buy zone: 1.348-1.345
Target 1.367
Leave your comments on the idea. I am happy to read your views.

GBPUSD I Scalp EntryCMCMARKETS:GBPUSD
Fast entry area for GBPUSD with a small stop loss after breaking the resistance area and retesting.
📊 BUY GBPUSD @ 1.3482
☠ STOP LOSS : 1.34600
🎯 tp : 1.35100
🎯 tp : 1.35600
🎯 tp : 1.36000

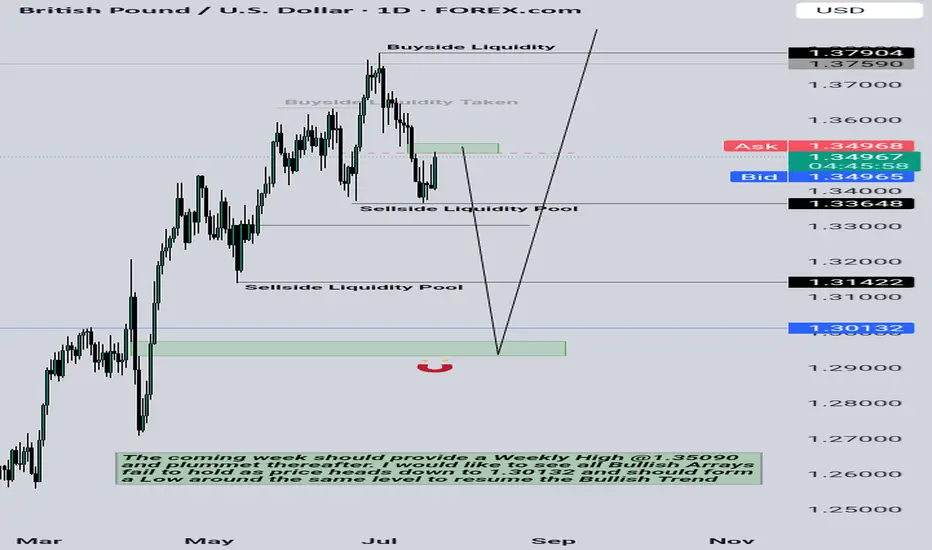
GBPUSD I Weekly CLS to be completed I Target Key LevelYo Market Warriors ⚔️
GBPUSD is going to complete WCLS, in to the key level. In COT data we see shorts being added which is taking net positions down. Intraday shorts model 0 are possible, Its early to long.
if you’ve been riding with me, you already know:
🎯My system is 100% mechanical. No emotions. No trend lines. No subjective guessing. Just precision, structure, and sniper entries.
🧠 What’s CLS?
It’s the real smart money. The invisible hand behind $7T/day — banks, algos, central players.
📍Model 1:
HTF bias based on the daily and weekly candles closes,
Wait for CLS candle to be created and manipulated. Switch to correct LTF and spot CIOD. Enter and target 50% of the CLS candle.
For high probability include Dealing Ranges, Weekly Profiles and CLS Timing.
Analysis done on the Tradenation Charts
Disclosure: I am part of Trade Nation's Influencer program and receive a monthly fee for using their TradingView charts in my analysis.
Trading is like a sport. If you consistently practice you can learn it.
“Adapt what is useful. Reject whats useless and add whats is specifically yours.”
David Perk aka Dave FX Hunter
💬 Don't hesitate to ask any questions or share your opinions

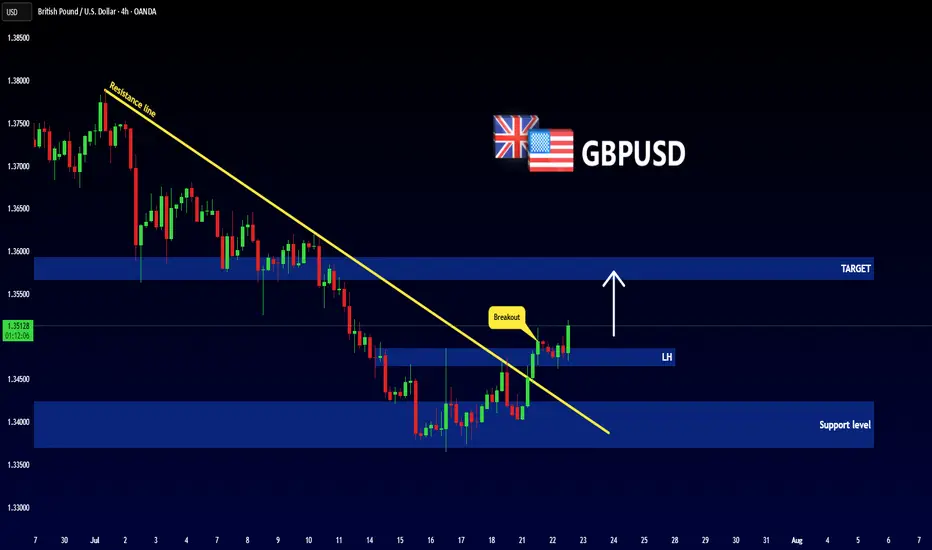
GBPUSD - New Breakout !Hello Traders !
The GBPUSD failed to create a new lower low!
Currently, The lower high is broken (change of character).
So, I expect a bullish move🚀
__________________
TARGET: 1.35670🎯
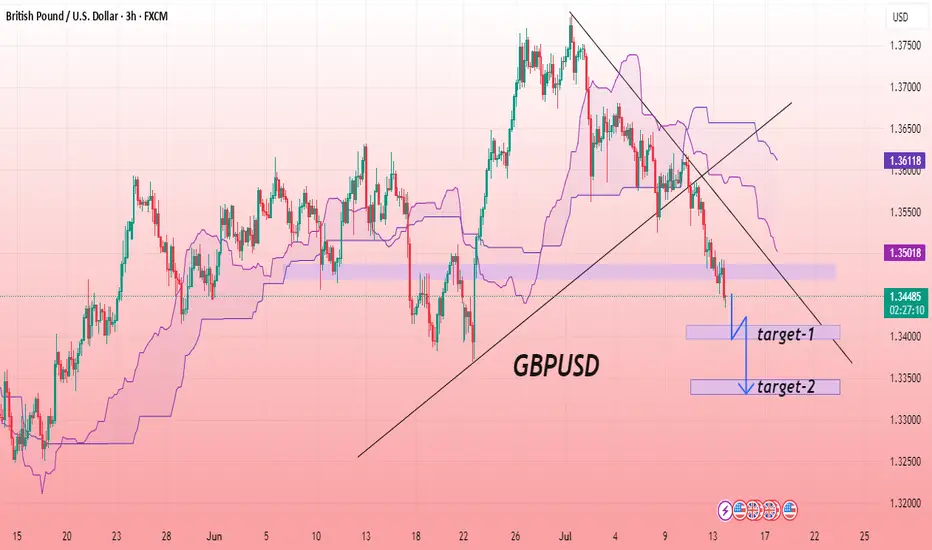
GBP/USD BEARISH SETUPThe chart shows the GBP/USD currency pair on a 3-hour timeframe, indicating a bearish trend. Price action has broken below the trendline support and is trading beneath the Ichimoku cloud, suggesting downward momentum. A key support zone has been breached, and the price is currently retesting this zone as resistance. The overall structure suggests a continuation to the downside. The chart highlights a descending channel and marks two projected levels as potential targets. The analysis aligns with bearish sentiment, reinforced by consistent lower highs and lower lows. Traders may consider further confirmation before initiating positions based on trend continuation setups.
Entry: 1.34500
Target First: 1.33960
Target Second: 1.33313
Stop Loss: 1.35000
GBPUSD Short, 21 JulyShort-Term Bearish Bias Despite HTF OB
Even though we sit at a Daily Orderblock (Buy), LTF structure remains bearish, and price respects both D/4H EMA.
📉 Confluence:
Multiple Asia lows unfilled
Clear snap of recent lows
Gap on DXY still open
DXY lacks perfect structure but aligns with 4H EMA and gaps = possible short-term drop
On GU 15m Extreme OB in play
🎯 Entry: Waiting for 1m BOS to confirm sellers stepping in
🛡️ SL: Slight risk, can’t fully cover highs with a 10 pip stop
📌 TP: Focused on completing Asia lows with 1:3 RR target minimum

Market Analysis: GBP/USD Dips FurtherMarket Analysis: GBP/USD Dips Further
GBP/USD started a downside correction from the 1.3620 zone.
Important Takeaways for GBP/USD Analysis Today
- The British Pound started a fresh decline and settled below the 1.3500 zone.
- There is a connecting bullish trend line forming with support at 1.3415 on the hourly chart of GBP/USD at FXOpen.
GBP/USD Technical Analysis
On the hourly chart of GBP/USD at FXOpen, the pair struggled above the 1.3600 zone. The British Pound started a fresh decline below the 1.3550 pivot level against the US Dollar, as discussed in the previous analysis.
The pair dipped below the 1.3500 and 1.3450 levels. A low was formed at 1.3364 and the pair is now consolidating losses. On the upside, it is facing resistance near the 1.3475 level. The next key resistance is near 1.3490 and the 50% Fib retracement level of the downward move from the 1.3619 swing high to the 1.3364 low.
An upside break above the 1.3490 zone could send the pair toward 1.3520 and the 61.8% Fib retracement level.
More gains might open the doors for a test of 1.3620. If there is another decline, the pair could find support near the 1.3415 level and a connecting bullish trend line. The first major support sits near the 1.3365 zone.
The next major support is 1.3350. If there is a break below 1.3350, the pair could extend the decline. The next key support is near the 1.3320 level. Any more losses might call for a test of 1.3250.
This article represents the opinion of the Companies operating under the FXOpen brand only. It is not to be construed as an offer, solicitation, or recommendation with respect to products and services provided by the Companies operating under the FXOpen brand, nor is it to be considered financial advice.

GBPUSD is Bearish! Look for Sells!Welcome back to the Weekly Forex Forecast for the week of July 21-25th.
In this video, we will analyze the following FX market:
GBPUSD
Expecting the USD to continue to push higher, which would further drag the EURO down. Look to take advantage of this dynamic and wait for sell setups!
Enjoy!
May profits be upon you.
Leave any questions or comments in the comment section.
I appreciate any feedback from my viewers!
Like and/or subscribe if you want more accurate analysis.
Thank you so much!
Disclaimer:
I do not provide personal investment advice and I am not a qualified licensed investment advisor.
All information found here, including any ideas, opinions, views, predictions, forecasts, commentaries, suggestions, expressed or implied herein, are for informational, entertainment or educational purposes only and should not be construed as personal investment advice. While the information provided is believed to be accurate, it may include errors or inaccuracies.
I will not and cannot be held liable for any actions you take as a result of anything you read here.
Conduct your own due diligence, or consult a licensed financial advisor or broker before making any and all investment decisions. Any investments, trades, speculations, or decisions made on the basis of any information found on this channel, expressed or implied herein, are committed at your own risk, financial or otherwise.

GBPUSD Short tradeCable is actually on the way to sink on the current week. I have my target at the key level 1.340.

Triangle pattern plus a trendline breakoutThe price broke out of a triangle pattern followed by a pullback, now the price looks to make a higher high and go long
WE ONLY TRADE PULLBACKS

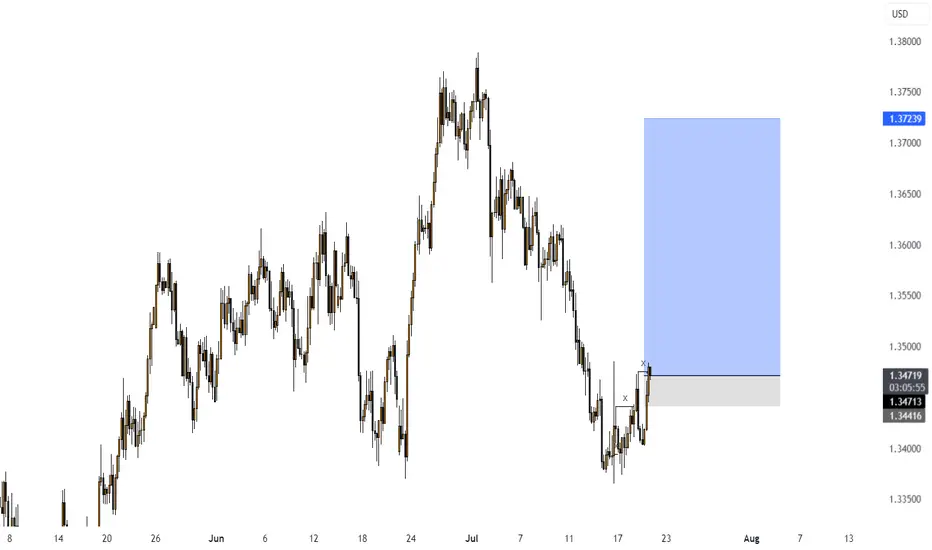
GBP BearsHigh of the week should be in today or tomorrow. Then we will see whether it shoots up during the course of the coming month or not
GBPUSD for short*The content on this analysis is subject to change at any time without notice, and is provided for the sole purpose of assisting traders to make independent investment decisions.

