GBPUSD 28/7/25- Sweep and bullishI highlighted the equal liquidity zone and places a buy limit order.
This has been triggered and now will see if it holds.
GBPUSD trade ideas
GBPUSD LongWe are in a key Fibonacci Level, Where it falls in line with a fair value gap. We are Looking to Go long to the yesterdays high of 1.35880. Lets see how it goes

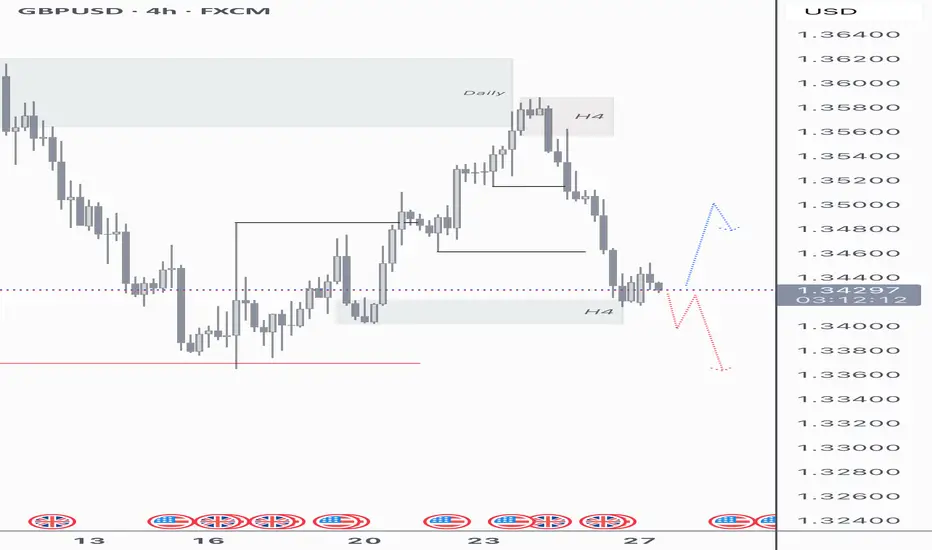
GU 28/07Good morning ladies and gents, today on GU I’m a bit unclear, we seen our sell off from daily supply taking out levels of H4 demand, however we still haven’t tested H4 supply to confirm our H4 trend reversal, technically we could turn bullish again. We are now are a level of H4 demand, we could continue to break this level and take out the daily low which originally looked like a sweep (indicated by the red line). However this level could hold and turn bullish to test a level of supply, the only key level of supply I’m interested in is at the extreme, I have marked out the intermediate as we may manufacture liquidity at this point showing a catalyst for pullback.
I will away for the M15 to break out and give us some clearer intent.
anyway thanks for checking my ideas out.
GBPUSD – DAILY FORECAST Q3 | W31 | D28 | Y25📊 GBPUSD – DAILY FORECAST
Q3 | W31 | D28 | Y25
Daily Forecast 🔍📅
Here’s a short diagnosis of the current chart setup 🧠📈
Higher time frame order blocks have been identified — these are our patient points of interest 🎯🧭.
It’s crucial to wait for a confirmed break of structure 🧱✅ before forming a directional bias.
This keeps us disciplined and aligned with what price action is truly telling us.
📈 Risk Management Protocols
🔑 Core principles:
Max 1% risk per trade
Only execute at pre-identified levels
Use alerts, not emotion
Stick to your RR plan — minimum 1:2
🧠 You’re not paid for how many trades you take, you’re paid for how well you manage risk.
🧠 Weekly FRGNT Insight
"Trade what the market gives, not what your ego wants."
Stay mechanical. Stay focused. Let the probabilities work.
FX:GBPUSD

GBPUSD NEW LOOKaccording to H1 analysis GBP market is at support level we have good opportynity
go long from support level
Dont be greedy use money management
TRADE AT YOUR OWN RISK
REGARD ALBERT

GBPUSD H4 I Bearish Continuation?Based on the H4 chart analysis, we can see that the price is rising toward our sell entry at 1.3475, which is a pullback resistance aligning with a 38.2% Fibo retracement.
Our take profit will be at 1.3403, a swing low support level.
The stop loss will be placed at 1.3529, a pullback support.
High Risk Investment Warning
Trading Forex/CFDs on margin carries a high level of risk and may not be suitable for all investors. Leverage can work against you.
Stratos Markets Limited (tradu.com ):
CFDs are complex instruments and come with a high risk of losing money rapidly due to leverage. 66% of retail investor accounts lose money when trading CFDs with this provider. You should consider whether you understand how CFDs work and whether you can afford to take the high risk of losing your money.
Stratos Europe Ltd (tradu.com ):
CFDs are complex instruments and come with a high risk of losing money rapidly due to leverage. 66% of retail investor accounts lose money when trading CFDs with this provider. You should consider whether you understand how CFDs work and whether you can afford to take the high risk of losing your money.
Stratos Global LLC (tradu.com ):
Losses can exceed deposits.
Please be advised that the information presented on TradingView is provided to Tradu (‘Company’, ‘we’) by a third-party provider (‘TFA Global Pte Ltd’). Please be reminded that you are solely responsible for the trading decisions on your account. There is a very high degree of risk involved in trading. Any information and/or content is intended entirely for research, educational and informational purposes only and does not constitute investment or consultation advice or investment strategy. The information is not tailored to the investment needs of any specific person and therefore does not involve a consideration of any of the investment objectives, financial situation or needs of any viewer that may receive it. Kindly also note that past performance is not a reliable indicator of future results. Actual results may differ materially from those anticipated in forward-looking or past performance statements. We assume no liability as to the accuracy or completeness of any of the information and/or content provided herein and the Company cannot be held responsible for any omission, mistake nor for any loss or damage including without limitation to any loss of profit which may arise from reliance on any information supplied by TFA Global Pte Ltd.
The speaker(s) is neither an employee, agent nor representative of Tradu and is therefore acting independently. The opinions given are their own, constitute general market commentary, and do not constitute the opinion or advice of Tradu or any form of personal or investment advice. Tradu neither endorses nor guarantees offerings of third-party speakers, nor is Tradu responsible for the content, veracity or opinions of third-party speakers, presenters or participants.


GBP/USD: Following the Bearish Trend to a Key LevelSharing my perspective on a potential short setup in GBP/USD.
This view is based on a combination of weakening UK fundamentals and a clear bearish technical structure.
📰 The Fundamental View
The main driver here is the growing difference in monetary policy. The Bank of England is signaling a more dovish stance due to recent soft economic data out of the UK. In contrast, the US economy is showing more resilience, which may keep the Federal Reserve on a less aggressive easing path. This fundamental divergence puts downward pressure on the Pound versus the Dollar.
📊 The Technical Picture
The chart supports this bearish bias. We can see a clear downtrend in place, defined by a series of lower highs and lower lows. Price is currently trading below its key moving averages, which often act as dynamic resistance. The critical level to watch is the 1.34377 price zone, which was a previous area of support and could now be tested as resistance.
🎯 The Strategy
The plan is to watch for bearish price action as we approach the 1.34377 key level. A rejection from this zone would provide a good opportunity to enter a short position, aiming to ride the next leg of the established downtrend.
As always, this is my own perspective. Manage your risk carefully and trade safe.

GBPUSD💹 GBP/USD Trade Analysis – Sell Setup
📍 Trade Idea: Initiating a short (sell) position on GBP/USD at the current market level.
---
🔽 Entry Zone
Suggested Entry: 1.34393
This level aligns with a minor resistance area formed by recent price rejection. It offers an optimal spot for initiating short positions, especially after confirmation of bearish pressure in lower timeframes.
---
📉 Stop Loss
Suggested Stop Loss: 1.34900 (above key resistance zone)
The stop loss is placed just above a strong resistance level to prevent premature exits. This level has historically acted as a barrier, making it a reliable invalidation point for the trade setup.
---
🎯 Take Profit Targets
TP1: 1.34215 – A modest first target based on recent intraday support.
TP2: 1.34125 – A deeper pullback zone where price has previously found temporary support.
TP3: 1.34000 – A psychologically and technically significant round number with historic support relevance.
GBPUSD short Fundamental and price action
Possible 1000 pip short
first red candle rule and price action , 4h moving average signal

GBPUSD(20250728)Today's AnalysisMarket news:
Trump announced that the US and Europe reached a trade agreement: 15% tariffs on the EU, $600 billion in investment in the US, zero tariffs on the US by EU countries, the EU will purchase US military equipment, and will purchase US energy products worth $750 billion. However, the US and Europe have different opinions on whether the 15% tariff agreement covers medicines and steel and aluminum. Von der Leyen: 15% tariff rate is the best result that the European Commission can achieve.
US Secretary of Commerce: The deadline for tariff increase on August 1 will not be extended. The United States will determine the tariff policy on chips within two weeks.
Technical analysis:
Today's buying and selling boundaries:
1.3462
Support and resistance levels:
1.3578
1.3535
1.3507
1.3417
1.3389
1.3346
Trading strategy:
If the price breaks through 1.3462, consider buying, the first target price is 1.3507
If the price breaks through 1.3417, consider selling, the first target price is 1.3389

Bullish bounce off?The Cable (GBP/USD) is falling towards the pivot and could bounce to the swing high resistance.
Pivot: 1.3370
1st Support: 1.3161
1st Resistance: 1.3585
Risk Warning:
Trading Forex and CFDs carries a high level of risk to your capital and you should only trade with money you can afford to lose. Trading Forex and CFDs may not be suitable for all investors, so please ensure that you fully understand the risks involved and seek independent advice if necessary.
Disclaimer:
The above opinions given constitute general market commentary, and do not constitute the opinion or advice of IC Markets or any form of personal or investment advice.
Any opinions, news, research, analyses, prices, other information, or links to third-party sites contained on this website are provided on an "as-is" basis, are intended only to be informative, is not an advice nor a recommendation, nor research, or a record of our trading prices, or an offer of, or solicitation for a transaction in any financial instrument and thus should not be treated as such. The information provided does not involve any specific investment objectives, financial situation and needs of any specific person who may receive it. Please be aware, that past performance is not a reliable indicator of future performance and/or results. Past Performance or Forward-looking scenarios based upon the reasonable beliefs of the third-party provider are not a guarantee of future performance. Actual results may differ materially from those anticipated in forward-looking or past performance statements. IC Markets makes no representation or warranty and assumes no liability as to the accuracy or completeness of the information provided, nor any loss arising from any investment based on a recommendation, forecast or any information supplied by any third-party.

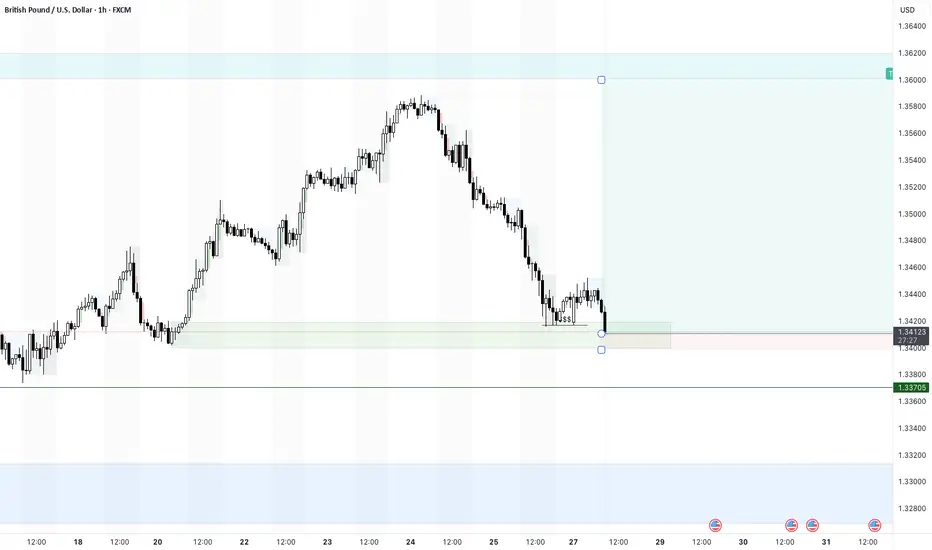
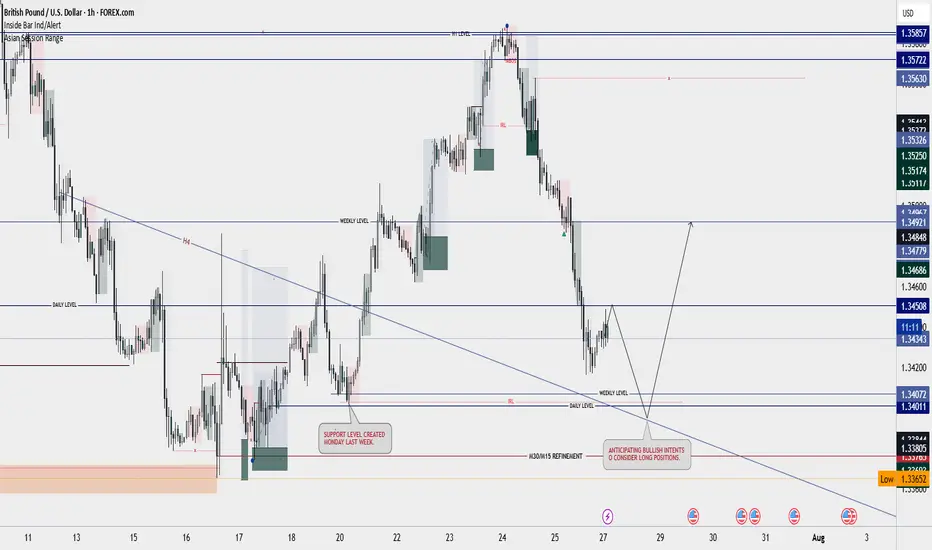
POUND DOLLAR LONGS - INTRA DAY: 27TH, 28TH JULY 2O25.📊 GBP/USD – Key Support in Focus
Last week, GBP/USD met strong resistance at 1.3587, a key daily opening price level from July 10th, which triggered a sharp decline of over 165 pips.
Currently, price is approaching a daily support level around 1.3401 – 1.3407, an important region formed on Monday, July 21st. This area marked the start of a significant bullish move that lasted from Monday until Wednesday last week, July 23rd.
🔍 What I’m Watching:
I’m closely monitoring the 1.3401 – 1.3407 zone for signs of bullish intent.
A break of the current internal bearish structure (i.e., shift in order flow) from this level would indicate potential accumulation and give me reasons to consider a long position.
✅ Trade Idea:
If price shows:
Rejection from support
Break of internal structure to the upside
Violation of the current bearish order flow.
Then I’ll look to enter long, targeting a potential recovery move.
Note: This is only a potential level of interest - If there is no confirmation to go long from this level, then there is no setup and hence, no trade. I remain patient and reactive at this key level.
To your trading success,
TradeUp team!📈📉
#GBPUSD #ForexAnalysis #PriceAction #Supportandresistance #TradeupNG

A POTENTIAL TREND REVERSALHello Traders 👋
What are your views about GBPUSD
Looking at a daily time frame we can see that press action has broken a rising trend line and also we are seeing a potential head and shoulder pattern.
For further clarification we need to see if the price action can break a demand zone which is indicator with a red rectangle.
This will give us a strong conviction that the dollar is already buying and GBPUSD is set for further downside.

GBPUSD | Bullish Bias - Midframe Alignment After SSL SweepPair: GBPUSD
Bias: Bullish
HTF Overview (4H):
Price structure is clearly bullish with strong intent. Looking to ride momentum as price continues toward 30M and 4H highs.
LTF Confirmation (30M):
Structure has been refined. Price swept sell-side liquidity and cleanly mitigated a key 30M OB — now I’m monitoring for LTF alignment to catch the continuation.
Entry Zone: Waiting for 5M CHoCH to flip bullish. Entry comes on the pullback into demand once the shift confirms.
Targets: 5M highs, 30M highs — trailing based on delivery and momentum
Mindset Note: No emotion, no forcing. Waiting for alignment from Smart Money and letting price invite me in. Clarity leads, execution follows.

GBPUSD - W30📉 GBP/USD Weekly Trading Plan
Current Bias: Neutral to Bearish
Last Week: Rejected near 1.3587, now near 1.3436
🔑 Key Levels
Resistance: 1.3500 → 1.3587
Support: 1.3400 → 1.3363 → 1.3206
🔧 Trade Setups
1. Sell near 1.3500–1.3550
SL: 1.3590
TP: 1.3400 → 1.3363
2. Buy near 1.3365 (if bounce)
SL: 1.3320
TP: 1.3500
🗓️ Key Events
Wed: FOMC
Thu: UK Retail Sales, PMI
Fri: US NFP

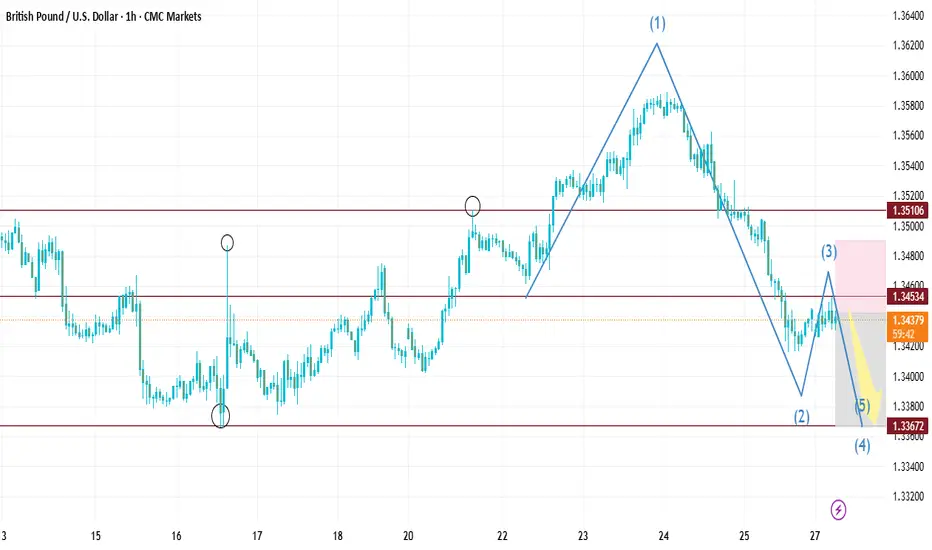
GBPUSD Outlook Week 21 Day 27CMCMARKETS:GBPUSD rejected at 1.375 to a low of 1.3375 and pulled back to a 50 percent retracement to the high of the week, 1.3575. To confirm whether the pair will continue to the upside, we have to wait to see it break 1.36250 and 1.375, otherwise we must also still wait for the low of the trend of 1.3375 to be broken before we can confirm a bearish trend
Overall bias is bearish.
Sell stop 1.33750 take profit 1.31250 (250 pips)
Buystop 1.36250 take profit 1.37500 (125 pips)
Disclaimer: Not a trading advice, please trade on demo
If you agree with my analysis, please give it a boost for others to see. If you disagree, share your opinion with me in the comment section

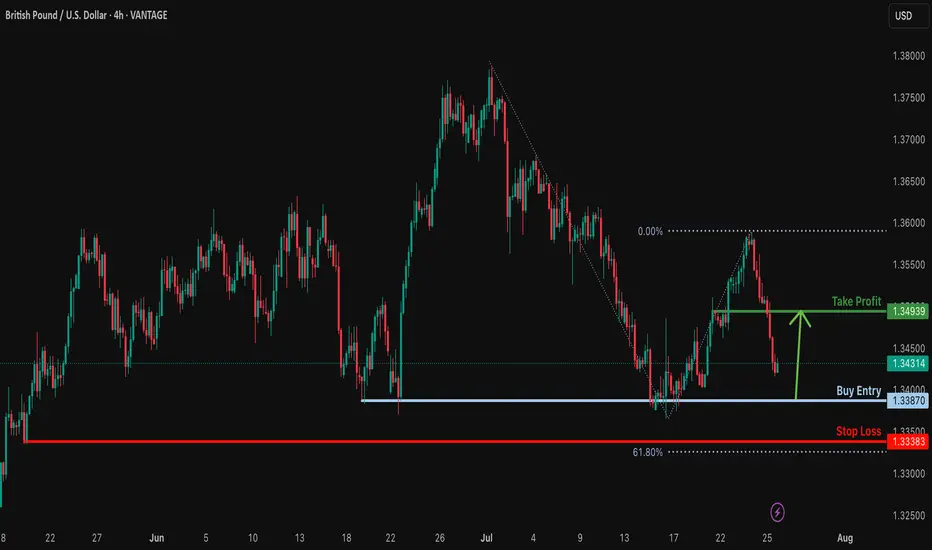
Bullish bounce?GBP/USD is falling towards the support level which is a multi swing low support and could bounce from this level to our take profit.
Entry: 1.3387
Why we like it:
There is a multi swing low support.
Stop loss: 1.3338
Why we like it:
There is a swing low support that is slightly above the 61.8% Fibonacci projection.
Take profit: 1.3493
Why we like it:
There is a pullback resistance.
Enjoying your TradingView experience? Review us!
Please be advised that the information presented on TradingView is provided to Vantage (‘Vantage Global Limited’, ‘we’) by a third-party provider (‘Everest Fortune Group’). Please be reminded that you are solely responsible for the trading decisions on your account. There is a very high degree of risk involved in trading. Any information and/or content is intended entirely for research, educational and informational purposes only and does not constitute investment or consultation advice or investment strategy. The information is not tailored to the investment needs of any specific person and therefore does not involve a consideration of any of the investment objectives, financial situation or needs of any viewer that may receive it. Kindly also note that past performance is not a reliable indicator of future results. Actual results may differ materially from those anticipated in forward-looking or past performance statements. We assume no liability as to the accuracy or completeness of any of the information and/or content provided herein and the Company cannot be held responsible for any omission, mistake nor for any loss or damage including without limitation to any loss of profit which may arise from reliance on any information supplied by Everest Fortune Group.
GBP/USD Outlook: Bearish Swing in Play After Weekly FVG RetestGBP/USD Weekly Forecast – July Week 4
Last week, GBP/USD retested a weekly Fair Value Gap near 1.35900 and responded with a strong bearish engulfing candle — showing clear rejection from the imbalance zone.
With the dollar expected to strengthen this week, we could see a small bullish retracement early in the week toward 1.35000, followed by a bearish swing move targeting at least the 1.31000 support zone.
Bias: Bearish
Key Zones:
• Resistance / Retest: 1.35000
• Target: 1.31000
• FVG Supply: 1.35900
Structure and macro direction both point to GBP weakness continuing.
—
Weekly forecast by Sphinx Trading
Share your bias in the comments.
#GBPUSD #Cable #ForexForecast #SmartMoney #SphinxWeekly #FairValueGap #DollarStrength #PriceAction

Sell gbpusdStrong selling wave expected for long term
Trend seems to be change the trend now
Monthly still overbought pair
Daily support trend break and retested

GBPUSD: Sellers Are Taking ControlWelcome back to the Weekly Forex Forecast for the week of July 28 - Aug 1st
In this video, we will analyze the following FX market:
GBPUSD
GBP is weak vs USD. GU is heading lower with a bit of steam.
The Monthly and the Weekly are still bullish, but the Daily and 4H indicate weakness. I would not entertain longs until I see a bullish BOS.
Look for the CISD on the 4H in the beginning of the week, confirming sells are the way to go.
Enjoy!
May profits be upon you.
Leave any questions or comments in the comment section.
I appreciate any feedback from my viewers!
Like and/or subscribe if you want more accurate analysis.
Thank you so much!
Disclaimer:
I do not provide personal investment advice and I am not a qualified licensed investment advisor.
All information found here, including any ideas, opinions, views, predictions, forecasts, commentaries, suggestions, expressed or implied herein, are for informational, entertainment or educational purposes only and should not be construed as personal investment advice. While the information provided is believed to be accurate, it may include errors or inaccuracies.
I will not and cannot be held liable for any actions you take as a result of anything you read here.
Conduct your own due diligence, or consult a licensed financial advisor or broker before making any and all investment decisions. Any investments, trades, speculations, or decisions made on the basis of any information found on this channel, expressed or implied herein, are committed at your own risk, financial or otherwise.

GBP/USD Longs to Shorts GU has been very bearish recently and is currently reacting from a clean demand zone with multiple confluences. While we may see a short-term push to the upside, I’ll be watching to see if price reaches the 3hr supply zone sitting at a premium level.
If price does reach that zone, I’ll be on the lookout for signs of Wyckoff distribution and a slowdown in momentum, which could signal the start of another bearish leg.
Confluences for GU Shorts:
Overall bearish trend remains intact — this is a pro-trend setup
Price may retrace to mitigate a 3hr supply zone
Liquidity to the downside still needs to be taken
Current demand zone may simply serve as a trigger for a retracement up to supply
P.S. If price fails to reach the supply zone and continues dropping, we’ll likely see a new break of structure and the formation of a fresh nearby supply zone, which we can then trade from.
Let’s stay sharp and have a profitable trading week ahead! 🔥📊💰
