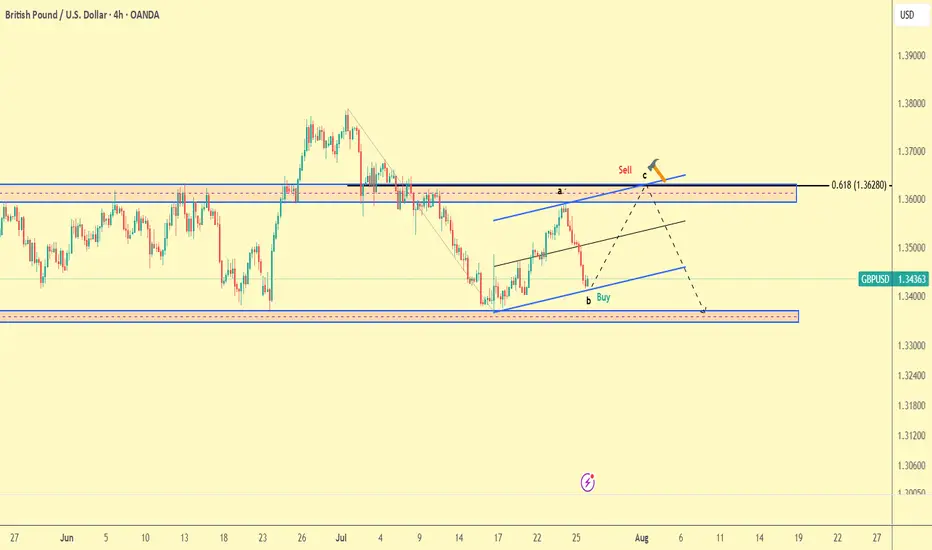
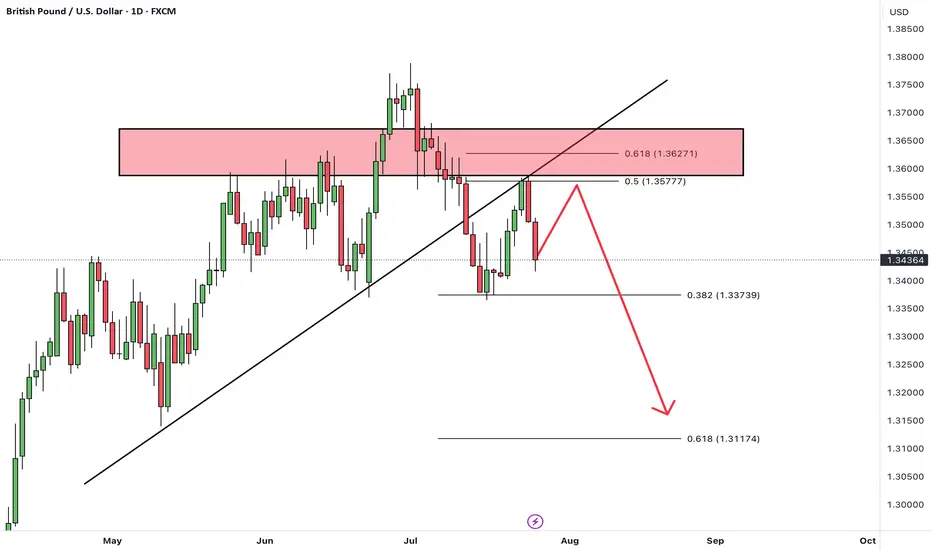
GBPUSD Trade plan 27/07/2025Dear Trader,
The pound has entered a corrective phase, and it seems that the corrective phase will continue. The current zone is a good area for buying until the 1.36 zone. At the 0.618 Fibonacci level, considering the channel's peak and the resistance zone, I expect a drop to the 1.33000 region.
Regards,
Alireza!
GBPUSD trade ideas
GBPUSDHello Traders! 👋
What are your thoughts on GBPUSD?
GBP/USD has broken below a trendline and has completed a retest (pullback) to the broken level.
The pair is now positioned for a potential downward move.
After some short-term consolidation, we expect price to drop at least toward the next identified support level.
As long as GBP/USD stays below the broken trendline, the bearish bias remains valid, and further downside is likely.
Don’t forget to like and share your thoughts in the comments! ❤️
GBPUSD SHORTSPrice closed the week bearish. There’s a daily head and shoulders pattern as well. Looking for price to continue bearish towards daily support. I’d like for price to retrace and create a LH before looking to get back into shorts.

GBP/USD Holds Trendline Support as USD Shows StrengthThe US dollar showed some strength against the British pound during Thursday and Friday session, reflecting overall USD resilience.
Despite the prevailing uptrend, it's possible that GBP/USD may begin to consolidate, given how extended the pound's bullish run has been.
Currently, price is holding above a rising trendline, with additional support near the 1.3350 level. That trendline could play a key role if price pulls back further.
This pair often acts as a gauge for broader USD strength, considering the pound's relative strength. A decisive break above the 1.3600 level could open the door for a move toward 1.3750 in the sessions ahead.

GBP/USD Retraces to Demand — Buy Setup FormingHello traders!
Price has been in a strong bullish trend throughout the week.
After forming a demand zone around 1.35300 and retracing back to it, we are looking to take a buy position in this area.
Manage your risk and trade safe!
GBP/USD - market structure analysis the price is in a very strong demand area, at the first confirmation that I will see of a change in character in this area, I will prefer to choose purchase transactions.
Buy zone for GBP USDEasy buy on GBP_ Very good entry point after a massive rally,,, pull back zone.. and its a careful buy point

GBPUSD → Retest of previously broken resistance...FX:GBPUSD has entered a correction phase after breaking through the local downtrend. If the price remains in the 1.3450–1.346 zone, this will confirm the formation of a new trading range...
The market is entering a correction phase due to the dollar. A countertrend retest of the support zone is forming. Earlier, the currency pair broke the local trend and is entering a flat phase. The retest of support may end with a recovery. If, within the local movement and after a false breakout of the 1.345 - 1.3467 zone, the bulls keep the price above the buying zone, then in the short and medium term, we can expect growth to continue.
Support levels: 1.3467, 1.345
Resistance levels: 1.35, 1.3584
A false breakdown of support at 1.3467 will confirm a change in the local trend (correction). The market may return to the recovery phase of the global trend.
Best regards, R. Linda!

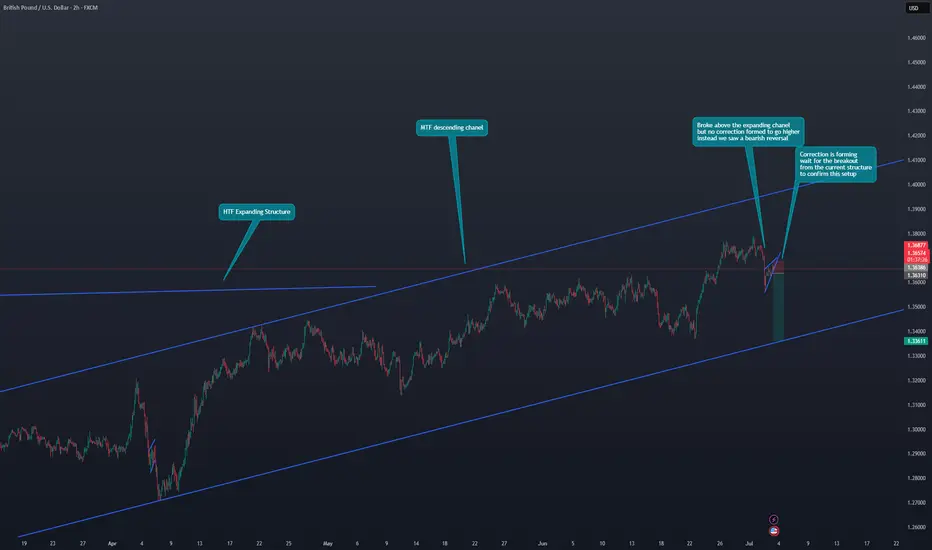
GBP/USD Sells incomingHi Traders!
1.HTF Expanding structure
2.MTF Asceding Chanel
3.False Breakout and LTF Reversal
4.LTF Continuation correction is forming
5.Wait for the breakout from the current structure to confirm this setup
GBPUSD Will Go Higher! Long!
Take a look at our analysis for GBPUSD.
Time Frame: 4h
Current Trend: Bullish
Sentiment: Oversold (based on 7-period RSI)
Forecast: Bullish
The market is approaching a key horizontal level 1.344.
Considering the today's price action, probabilities will be high to see a movement to 1.351.
P.S
Please, note that an oversold/overbought condition can last for a long time, and therefore being oversold/overbought doesn't mean a price rally will come soon, or at all.
Disclosure: I am part of Trade Nation's Influencer program and receive a monthly fee for using their TradingView charts in my analysis.
Like and subscribe and comment my ideas if you enjoy them!

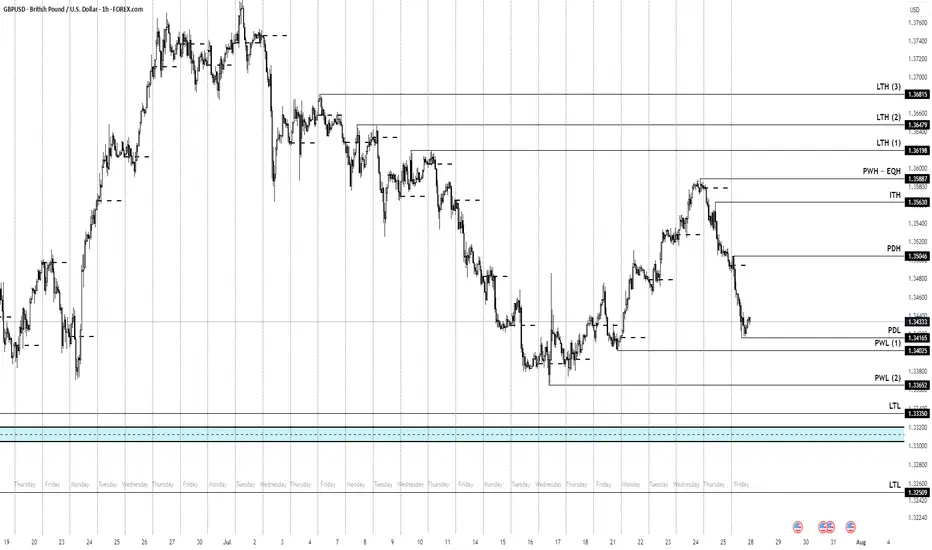
Cable Price Points to keep track off going into NFP/FOMC weekHeading into NFP week we have mixed bias.
Daily sais : BEARISH
Weekly is BULLISH (specially that we closed respecting a +FVG)
Ofc, being an NFP week we trade with care.
Nevertheless i highlighted some key Highs and Lows to keep track of.
GBP USD long as the price approaching the trend line we may have a rejection to the top so this trade is so viable ....
Please note: This is for educational purposes only and not a trading signal. These ideas are shared purely for back testing and to exchange views. The goal is to inspire ideas and encourage discussion. If you notice anything wrong, feel free to share your thoughts. In the end, to learn is to share !

GBP_USD LONG FROM SUPPORT|
✅GBP_USD has been falling recently
And the pair seems locally oversold
So as the pair is approaching
A horizontal support of 1.3399
Price growth is to be expected
LONG🚀
✅Like and subscribe to never miss a new idea!✅
Disclosure: I am part of Trade Nation's Influencer program and receive a monthly fee for using their TradingView charts in my analysis.

GBPUSD BUYGBP/USD drops to 1.3450 area after weak UK Retail Sales data
GBP/USD continues to push lower after closing in negative territory on Thursday and trades near 1.3450 on Friday. Weaker-than-expected Retail Sales data from the UK and the broad-based US Dollar strength forces the pair to stay on the back foot heading into the weekend
GBP/USD came under bearish pressure on Thursday and lost more than 0.5%, snapping a three-day winning streak in the process. The pair extends its slide on Friday and trades below 1.3500.
The renewed US Dollar (USD) strength weighed on GBP/USD on Thursday. The US Department of Labor reported that the number of first-time applications for unemployment benefits declined to 217,000 in the week ending July 19 from 221,000 in the previous week. This reading came in better than the market expectation of 227,000. Additionally, the S&P Global Composite Purchasing Managers Index (PMI) improved to 54.6 (preliminary) in July from 52.9 in June, reflecting an ongoing expansion in the private sector's business activity, at an accelerating pace.
Meanwhile, the EUR/GBP cross rose more than 0.3% on Thursday as the Euro benefited from the European Central Bank's (ECB) cautious tone on policy-easing. EUR/GBP preserves its bullish momentum and trades at its highest level since early April above 0.8700 on Friday, suggesting that the Euro continues to capture capital outflows out of Pound Sterling.
Early Friday, the UK's Office for National Statistics reported that Retail Sales rose by 0.9% on a monthly basis in June. This reading followed the 2.8% decrease recorded in May but came in worse than the market expectation for an increase of 1.2%, making it difficult for GBP/USD to stage a rebound.
In the second half of the day, Durable Goods Orders data for June will be the only data featured in the US economic calendar. Nevertheless, this data is unlikely to have a long-lasting impact on the USD's valuation.
SUPPORT 1.34550
SUPPORT 1.34982
SUPPORT 1.35421
RESISTANCE 1.33990
RESISTANCE 1.33698

GBP-USD Support Ahead! Buy!
Hello,Traders!
GBP-USD went down but
The pair will soon hit a
Horizontal support level
Of 1.3400 from where we
Will be expecting a local
Rebound and a move up
Buy!
Comment and subscribe to help us grow!
Check out other forecasts below too!
Disclosure: I am part of Trade Nation's Influencer program and receive a monthly fee for using their TradingView charts in my analysis.

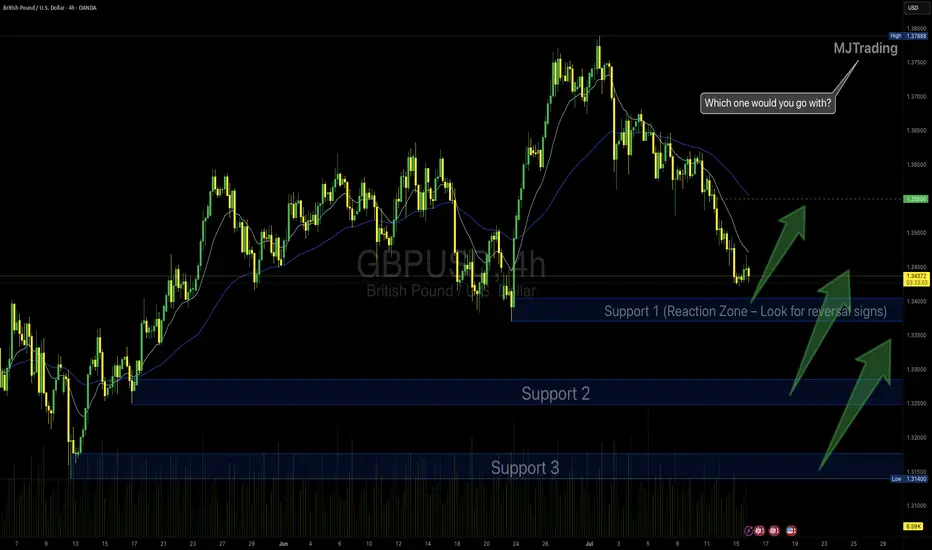
GBPUSD Idea – Demand Zones & Potential Reversal Play🧠 MJTrading:
After a steady downtrend, GBPUSD is now approaching a strong 4H demand zone (Support 1), where we previously saw explosive bullish reactions.
Price is also extended from both EMAs, showing potential for a technical pullback or full reversal.
💡Scenarios to consider:
🔹 If Support 1 holds → we may see a bounce toward 1.3500+
🔹 If broken → Support 2 & 3 offer deeper liquidity and high-probability demand zones
👀 Watch for:
Bullish reversal candles (engulfing / hammer)
Bullish divergence on lower timeframes
Volume spikes on reaction
⚠️ Invalidation:
If Support 3 breaks with strong momentum, we might enter a bearish continuation phase.
#GBPUSD #Forex #ChartDesigner #SmartMoney #PriceAction #MJTrading #ForexSetup #TrendReversal #SupportZones
GBPUSD BUY IDEAWe will be looking into taking the buys as per the chart. I hope this is an idea that resonates with you. Happy trading days

gbpusdwe have active order block on gbpusd and we will wait for confirmation entry dont open position until i active it manually
OANDA:GBPUSD

idea gpbusd Momentum LongWE here in position long based 3 min CHOCH and it reached zone Demmand in H1. i search around 6 to 1 , Best luck Traders

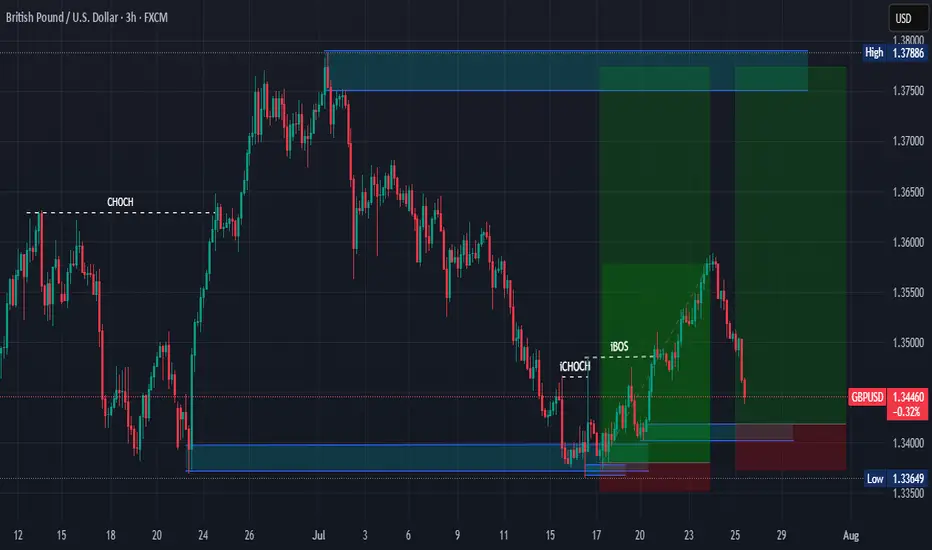
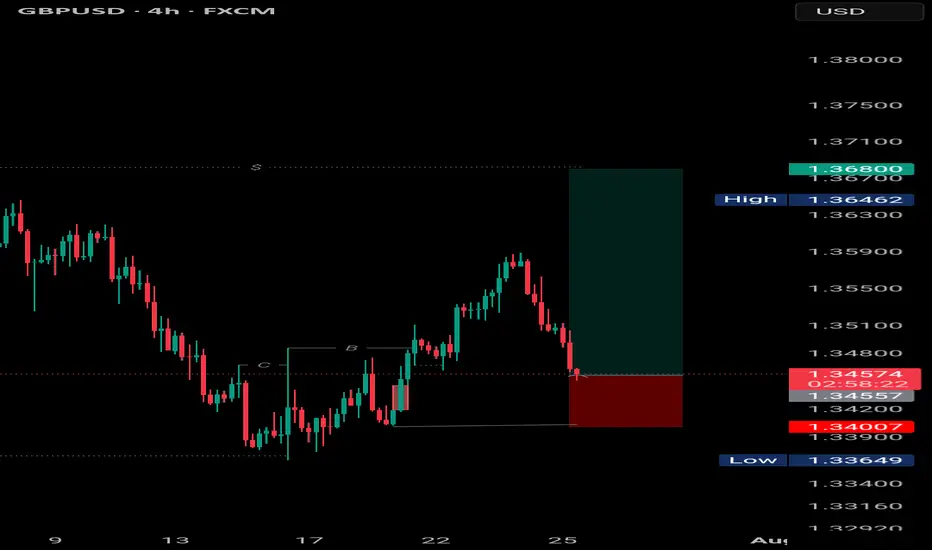
GBPUSD | Bullish Reversal Setup GBPUSD | Bullish Reversal Setup
Price tapped into previous demand zone after forming a clear BOS (Break of Structure). Anticipating a bullish move towards 1.36800.
Entry at key support with a clean RR. Watching closely for momentum confirmation.
#GBPUSD #SmartMoney #ForexTrading #PriceAction #EranseCapital
POUND DOLLAR LONG CONTINUATIONMarket Outlook: GBP/USD
25th July 2025.
The Pound-Dollar pair continues to maintain a bullish market structure, and our approach remains aligned with the prevailing trend. Recently, the price traded above a key 4-hour high, triggering a deeper pullback into discount pricing within the currently active H4 demand zone.
We are now observing price action closely, as this H4 demand level holds potential to serve as the launch point for the next bullish swing. As long as the structure remains intact, we remain buyers from this zone — anticipating a continuation of the upward momentum.

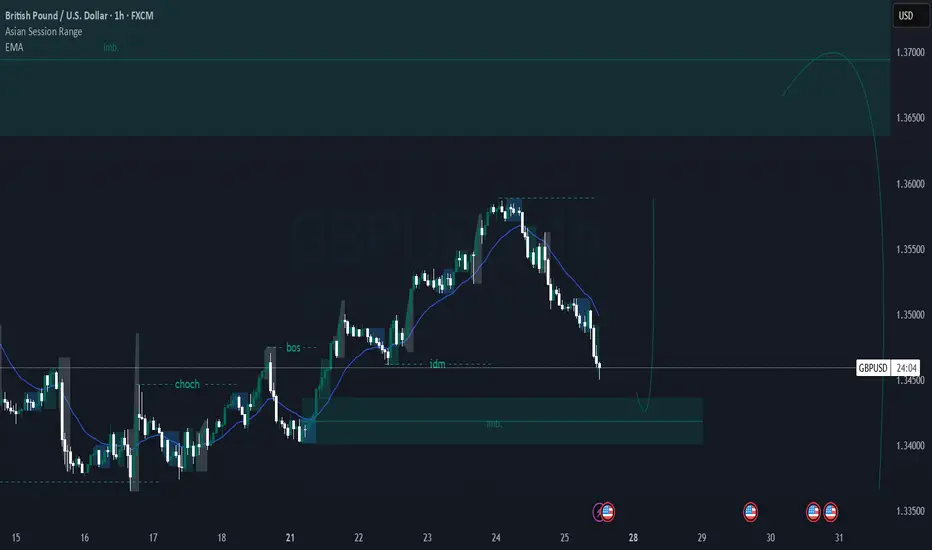
GBP/USD Technical Analysis Anticipating a bullish reversal Price made a CHoCH, followed by a Break of Structure (BOS), confirming a bullish shift.
Currently, price is retracing into a high-confluence zone:
Internal demand (order block)
Imbalance (IMB)
Near the EMA
Reaction expected around 1.34300–1.34600.
If this zone holds, we anticipate a bullish push toward 1.36000+ (better to make a confirmation entry)