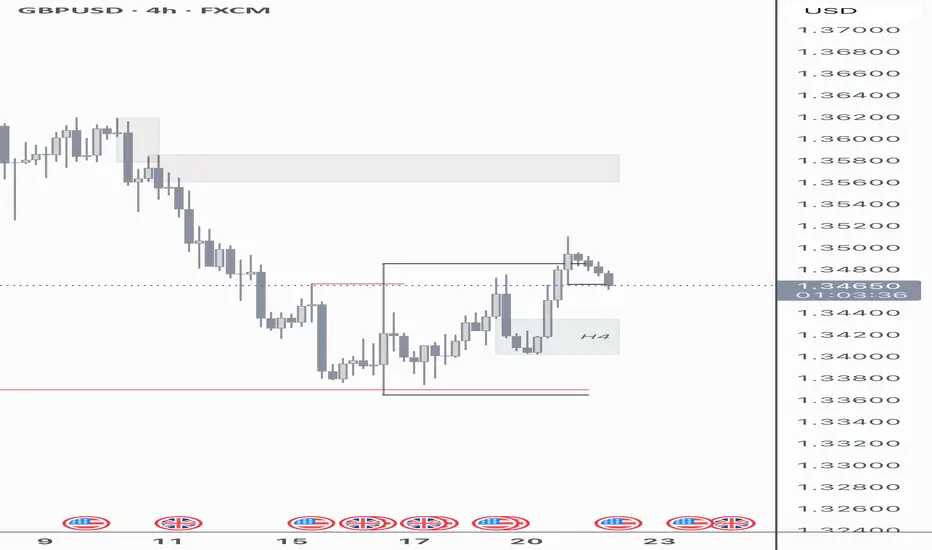
GBP/USD - Potential LONG After sweeping Liquidity last week, GBP/USD has been pushing higher.
Price has now pushed towards a 4H Bearish FVG, if price pushes through this area and its gets invalidated, we can look for Long positions on the lower timeframes.
Note - I only take my trades during London or New York sessions, this is a potential for London open.
GBPUSD trade ideas

GBP/USD is having a bearish bias and it just mitigate the BBGBP/USD is having a bearish bias and it just mitigate the Braker block in my extreme POI as a results today Tue/jul/2025 i decided to open a short position.

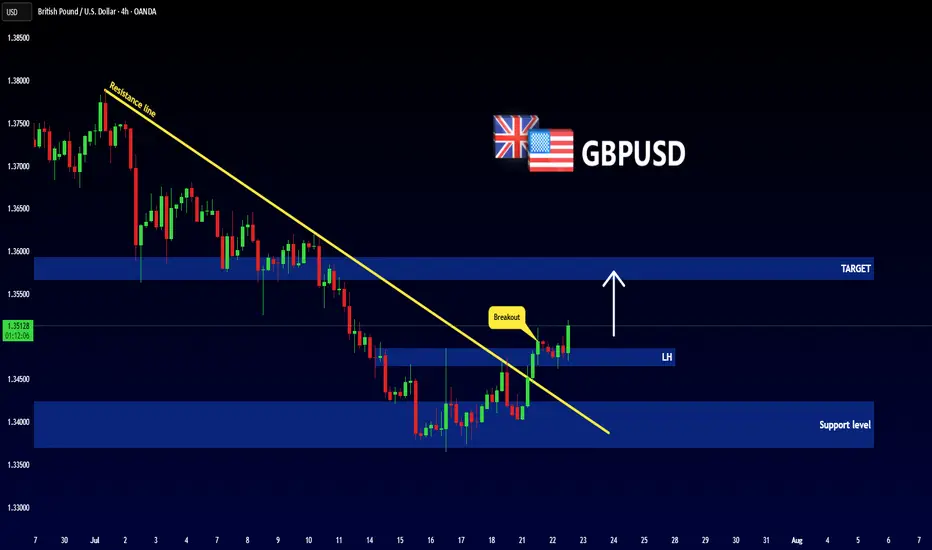
GBPUSD - New Breakout !Hello Traders !
The GBPUSD failed to create a new lower low!
Currently, The lower high is broken (change of character).
So, I expect a bullish move🚀
__________________
TARGET: 1.35670🎯
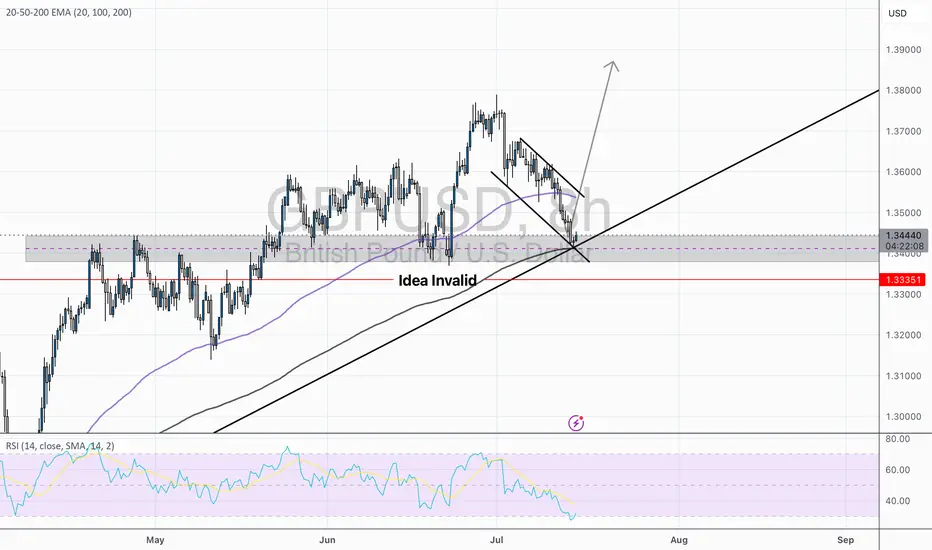
GBP/USD — Potential Bullish Reversal Setup | Long Bias Above Sup🧠 Thesis:
GBP/USD is showing early signs of a potential bullish reversal from a key confluence zone. While price has recently tested short-term descending channel, we’re currently testing a strong ascending trendline support and prior demand zone. This setup offers a favorable long-risk scenario — so long as price remains above 1.3335 (invalid level).
🔍 Technical Breakdown:
Descending Channel: Price has been in a corrective downward channel since early July. This pullback appears orderly and corrective rather than impulsive.
Support Zone: We are seeing strong reactions from the 1.3400–1.3440 area, which aligns with:
Previous consolidation zone (mid-May).
200 EMA on the 4H.
Long-term ascending trendline support (from April lows).
Bullish RSI Divergence: RSI is testing oversold territory (~32) with potential for bullish divergence forming — a classic early signal for a bounce.
EMA Cluster: 50 EMA has been breached but price is testing the 200 EMA as last-resort dynamic support. If held, this further adds to the bullish case.
🧭 Scenarios:
✅ Bullish Bias (Preferred)
If price holds above the trendline support and breaks out of the descending channel, we could see a bullish impulse toward:
🎯 TP1: 1.3600 (prior structure)
🎯 TP2: 1.3770 (trendline extension & fib confluence)
Confirmation trigger: Break and close above 1.3500 resistance (channel breakout).
❌ Invalidation:
A decisive break below 1.3335 (marked in red) invalidates this idea and shifts bias back to bearish — potential deeper pullback toward 1.3200s.
⚠️ Risk Management:
Entry zone: 1.3430–1.3450 (near support)
Stop loss: Below 1.3335
Risk-reward: >2.5:1 on a successful breakout
📝 Conclusion:
This is a classic trend-continuation play with clean structure and a logical invalidation point. The market is offering a textbook “buy-the-dip” scenario off strong multi-timeframe support. Patience is key — wait for confirmation before sizing in.
GBPUSD Long📊 Market Structure Overview:
After forming a swing low near 1.3474, GBPUSD respected the demand zone and initiated a strong bullish impulse.
This rally broke above internal market structure, triggering a Break of Structure (BOS) at 1.3519, indicating a momentum shift favoring the bulls.
A short-term retracement is anticipated, offering a potential higher low formation before continuation toward untested higher timeframe liquidity.
📌 Key Zones ("Your Borders"):
🟢 Demand Zone (Support / Re-Entry Area)
Level: 1.3480 – 1.3495
This green demand block is strategically positioned just above the 0.5 Fibonacci retracement level (1.3490) and below the IDM low (1.3474).
This confluence adds strength to the zone, making it a high-probability re-accumulation area where buyers are expected to defend.
If price retests this level after the recent BOS, it may present an ideal long entry opportunity with a bullish continuation target above the local high.
⚪ Mid Supply Zone (Breakout Zone)
Level: 1.3519 – 1.3530 (gray shaded area)
This zone was the prior resistance level before the BOS. Now that price has broken above, it may act as a minor resistance-turned-support if price consolidates or pulls back temporarily.
🔄 Price Expectation:
A pullback into the 1.3480–1.3495 demand zone is anticipated to attract renewed buying pressure.
If bullish structure holds, the market is likely to form a higher low, then resume upward momentum, potentially breaking through the minor supply near 1.3530 and targeting 1.3550–1.3570 as a liquidity draw.
A failure to hold above the IDM low at 1.3474 and the structural CHoCH at 1.3461 would invalidate the bullish scenario and shift bias back to the downside.

GBPUSD BUYS GU broke the previous LH and formed support. I’m waiting for price to break out of consolidation on the M15 and form more bullish pressure before entering longs towards 1.36200 area.

GBPUSDHello Traders! 👋
What are your thoughts on GBPUSD?
GBP/USD has broken support zone and its ascending trendline, indicating a shift in momentum.
The pair is currently in a pullback phase, retesting the broken support zone, which now acts as resistance.
Once the pullback is complete, we expect further downside toward the next identified support level.
As long as the price remains below the broken zone, the bearish outlook remains valid, and rallies may offer sell opportunities.
Don’t forget to like and share your thoughts in the comments! ❤️
GBPUSDBias,to the upside on the CABLE, after,we broke to the upside clearing the Previous Monthly candle Open, price is expected to continue to the upside

GBPUSDThis is the kind of setup I’d get involved in. Whatever happens, happens—this is just my perspective on what might unfold. It may or may not play out, but either way, we grow and learn

GBPUSDOn the 1hr time frame price took sell side liquidity and ran into an FVG, I expect a little push up after the break of internal structure to the area of 1.35060

GBPUSD - Looking To Sell Pullbacks In The Short TermH4 - Strong bearish move.
No opposite signs.
Currently it looks like a pullback is happening.
Expecting bearish continuation until the two Fibonacci resistance zones hold.
If you enjoy this idea, don’t forget to LIKE 👍, FOLLOW ✅, SHARE 🙌, and COMMENT ✍! Drop your thoughts and charts below to keep the discussion going. Your support helps keep this content free and reach more people! 🚀
--------------------------------------------------------------------------------------------------------------------

GBPUSDLong opportunity
- broke through 4 hr descending trendline
- you can see CHOCH where the grey dashed box is
- continues bullish now
- order block where blue dashed box is
- bullish candle engulfed the previous bearish candle ( this is where i entered )
- SL below demand zone
- TP at major supply zone

GBPUSD Long Trade Alert – Inverted Head & Shoulders BreakoutGBPUSD has confirmed a classic Inverted Head & Shoulders pattern, signaling a strong bullish reversal opportunity on the 2-hour chart. Price has successfully broken above the neckline resistance zone (~1.3490) and has now retested that zone, forming a bullish engulfing candle — an ideal confirmation for long entries.
🟢 Trade Plan:
Entry: After bullish engulfing candle formed on neckline retest (~1.3490–1.3500)
Stop Loss: Just below the right shoulder low / retest swing low (~1.3455)
Risk/Reward Ratio: ~4:1 (High reward with tightly controlled risk)
🎯 Target Levels:
Target 1: 1.3555
Final Target (Projected): 1.3620
These levels align with structure resistance and measured move of the pattern
📌 Why This Trade Matters:
Pattern confirmed ✅
Retest successful ✅
Bullish confirmation candle ✅
Clean invalidation and upside potential ✅
This is a textbook reversal play, offering solid structure, clear stop placement, and attractive upside. Perfect for swing traders or short-term position setups.
📉 Trade what you see, not what you think. Let price action lead your execution.
=================================================================
Disclosure: I am part of Trade Nation's Influencer program and receive a monthly fee for using their TradingView charts in my analysis.
=================================================================

EURUSD and GBPUSD Analysis todayHello traders, this is a complete multiple timeframe analysis of this pair. We see could find significant trading opportunities as per analysis upon price action confirmation we may take this trade. Smash the like button if you find value in this analysis and drop a comment if you have any questions or let me know which pair to cover in my next analysis.

GBPUSD Forming a Fall CorrectionGBPUSD is forming a counter-trend correction and pushing towards a liquidity zone, supported by recent USD weakness.
If price continues to rise amid USD softness, GBPUSD may test the resistance at 1.35500. A rejection or bearish price action from this resistance could trigger a pullback or continuation of the broader downtrend. The downside target remains near 1.32200, aligned with previous demand and potential liquidity zones.
You may find more details in the Chart.
Ps; Support with like and comments for more better analysis.

GbpusdI’m looking for bearish movement in pound. It’s a contra trend trade, but I have the right movement in COT

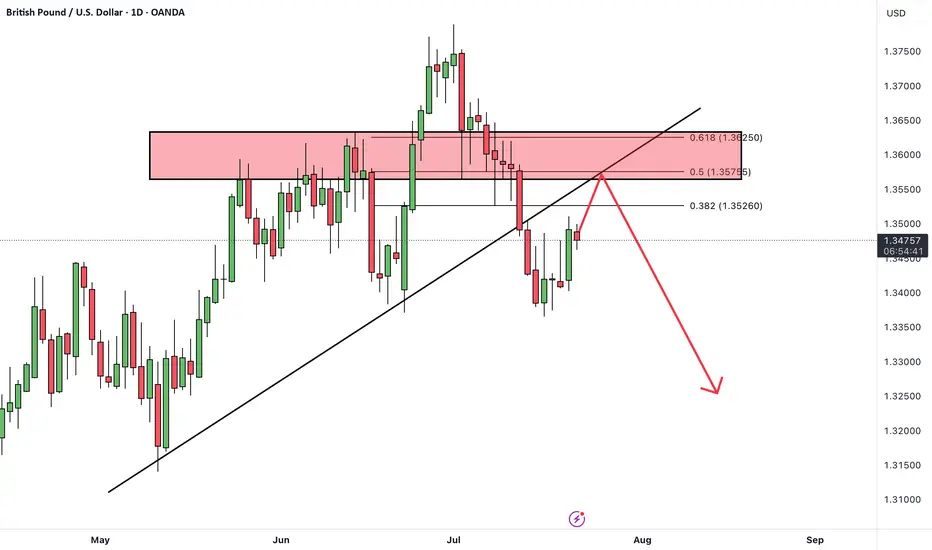
GBP/USD TARGET1 - TARGET2target no. 1, then target no. 2, meaning continued weakening of the GBP against the USD.
Tools:
- real volume (proper interpretation)
- Fibonacci expansion ABC
- Fibonacci retracement
- volume support and resistance levels
- oversold/overbought index
- candlestick patterns

GBPUSD BUY IDEATREND - UPTREND
What's currently happening is a retracement/retest of the previous high for continued buys to the next resistance. H4 close will be confirmation for entries

GU 22/07Today I’m looking at potential shorts into the H4 demand zone, we have seen H4 supply break after taking a HTF level of liquidity as marked out by my red line, now I’d like to see H4 demand being respected as our FLOR (first level of respect) to continue higher. Intraday il be wanting to see if the M15 demand fails then supply is retested to look for short opportunities into H4 demand
bullish reveralThe low has been taken out, and price changed character and broke structure to the upside, we anticipate price to fill the imbalance and test the discount price range before taking off

Could the Cable bounce from here?The price is falling towards the pivot, which lines up with the 50% Fibonacci retracement and could bounce to the 1st resistance.
Pivot: 1.3462
1st Support: 1.3402
1st Resistance: 1.3532
Risk Warning:
Trading Forex and CFDs carries a high level of risk to your capital and you should only trade with money you can afford to lose. Trading Forex and CFDs may not be suitable for all investors, so please ensure that you fully understand the risks involved and seek independent advice if necessary.
Disclaimer:
The above opinions given constitute general market commentary, and do not constitute the opinion or advice of IC Markets or any form of personal or investment advice.
Any opinions, news, research, analyses, prices, other information, or links to third-party sites contained on this website are provided on an "as-is" basis, are intended only to be informative, is not an advice nor a recommendation, nor research, or a record of our trading prices, or an offer of, or solicitation for a transaction in any financial instrument and thus should not be treated as such. The information provided does not involve any specific investment objectives, financial situation and needs of any specific person who may receive it. Please be aware, that past performance is not a reliable indicator of future performance and/or results. Past Performance or Forward-looking scenarios based upon the reasonable beliefs of the third-party provider are not a guarantee of future performance. Actual results may differ materially from those anticipated in forward-looking or past performance statements. IC Markets makes no representation or warranty and assumes no liability as to the accuracy or completeness of the information provided, nor any loss arising from any investment based on a recommendation, forecast or any information supplied by any third-party.

22.07.25 Morning ForecastPairs on Watch -
FX:GBPJPY
FX:AUDUSD
OANDA:XAUUSD
FX:GBPUSD
A short overview of the instruments I am looking at for today, multi-timeframe analysis down to what I will be looking at for an entry. Enjoy!

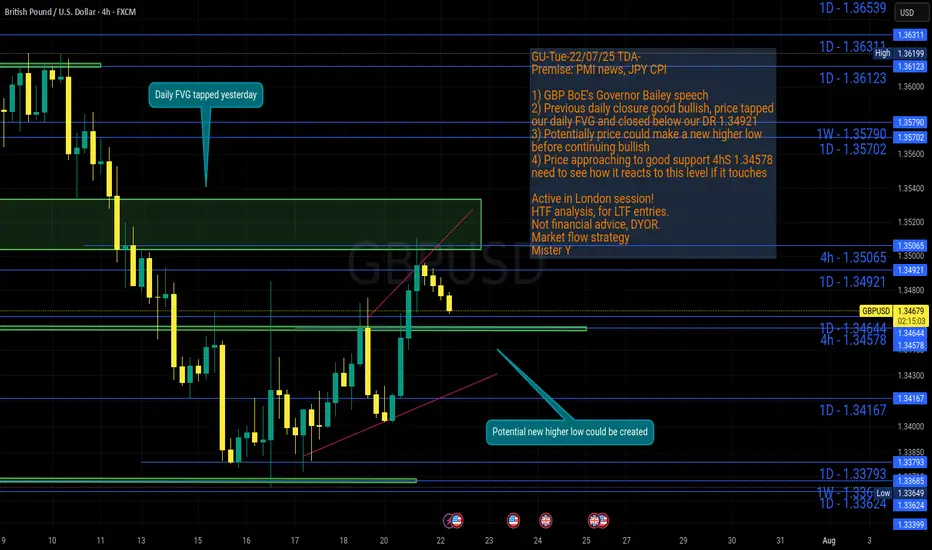
GU-Tue-22/07/25 TDA-Potential new higher low before continue?Analysis done directly on the chart!
Price gave a good bullish closure on daily candle yesterday,
if bullish trend continues, there's a good probability for price
to create a new higher low before continuing up.
Monitor and react to how price move from level to level.
Premise:
A simple idea plan (like Tradingview public posts) won't describe everything.
No one can predict how market will move, it's always good to react to how it moves.
It gives an idea of how price might move, but no one come from FUTURE.
So I always encourage people to openly and actively discuss in real time.
I don't give signals blindly, people should learn
and understand the skill.
Following blindly signals you won't know how to
manage the trade, where precisely put sl and tp,
lot size and replicate the move over time.
That's why you need active real time discussions.
Trading is not get rich quick scheme!
Active in London session!
Not financial advice, DYOR.
Market Flow Strategy
Mister Y