Getting Choppy for the fall ? Or connecting to move UP Again ??Resistance 1 Can touch 1.35900
Resistance 2 Can touch 1.36321
Resistance 3 Can touch 1.37789
Support 1 Can touch 1.34593
Support 2 Can touch 1.34151
Support 3 Can touch 1.33741
Disclaimer:
Trading foreign exchange (Forex) on margin involves a high level of risk and may not be suitable for all investors. The use of leverage can work both for and against you. Before deciding to participate in the Forex market, you should carefully consider your investment objectives, level of experience, and risk tolerance.
There is a possibility that you may incur a loss of some or all of your initial investment, and therefore, you should not invest money that you cannot afford to lose. Be fully aware of all the risks associated with foreign exchange trading, and seek advice from a licensed and independent financial advisor if you have any doubts.
Past performance is not indicative of future results. Always trade responsibly.
GBPUSD trade ideas

GBPUSD(20250723)Today's AnalysisMarket news:
White House officials plan to visit the Federal Reserve headquarters on Thursday local time.
Technical analysis:
Today's buying and selling boundaries:
1.3507
Support and resistance levels:
1.3578
1.3552
1.3534
1.3480
1.3463
1.3436
Trading strategy:
If it breaks through 1.3534, consider buying, the first target price is 1.3552
If it breaks through 1.3507, consider selling, the first target price is 1.3480

GBP/USD Pair Technical Overview!The GBP/USD pair is trading in a general upward trend after seeing some pullbacks due to the renewed strength of the US dollar. However, it failed to close below the 1.33649 level on both the 4-hour and daily timeframes, thus maintaining a positive outlook.
The next target for this pair is at the 1.3690 level. The bullish scenario will remain valid unless the price breaks below the 1.33649 level and creates a daily candle close beneath it.

GBPUSD CONTINUE?Please be advice what I am writing or making ideas is base only on my understanding on market, were all not the same ideology on how market works. so I am sharing only what I know.
On trading with capital trade only what you can afford to loss.
THis is my view on this pair, I think we see a continuation on the upside to redistribute at higher timeframe.
1.39 for new high. but it would redistribute after this high?
what's your thoughts on this?
THis is not a financial advice.
Trade only at your own understanding.
FOllow for more.
ciaoooooo

GBPUSD Potential UpsidesHey traders, in today's trading session we are monitoring GBPUSD for a buying opportunity around 1.35100 zone, GBPUSD is trading in an uptrend and currently is in a correction phase in which it is approaching the trend at 1.35100 support and resistance area.
Trade safe, Joe.

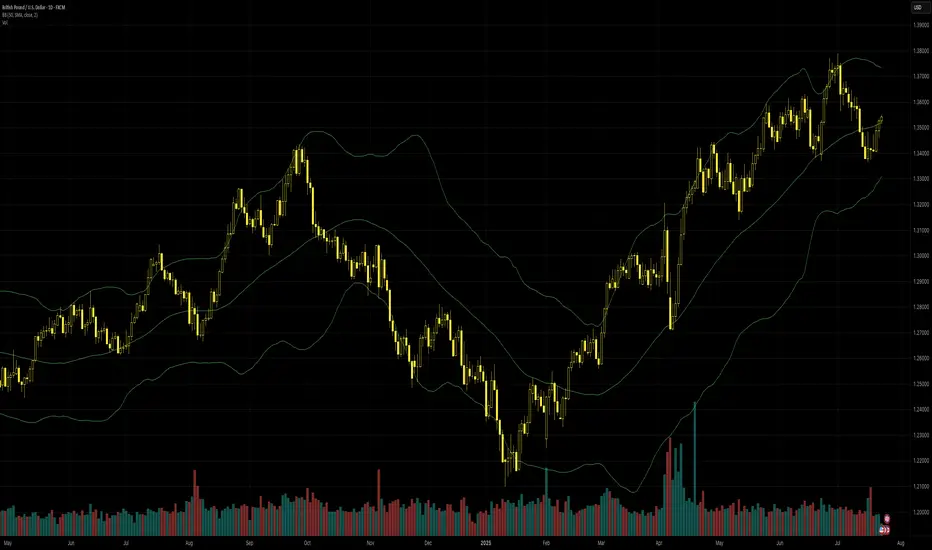
Cable’s bounce seems strongRisk appetite overall improved near the end of June as a series of countries including Japan signed new trade deals with the USA. Recent British data, primarily on inflation, suggest that the Bank of England will continue to be cautious about cutting rates, possibly more so than the Fed. However, the British government’s budget deficit and increased borrowing are negative factors, suggesting that taxes will probably need to be hiked later in the year, which would hit growth.
The bounce appeared to gain momentum around 21 July after an upward crossover of the slow stochastic within the trigger zone and, relatively speaking, higher volume. The combination of these factors would normally suggest a more reliable buy signal but recent highs around $1.375 would probably be very challenging to break.
The 20 SMA is in the process of death crossing the 50 SMA from Bands, so it might also be hard for the price to continue clearly above $1.354 in the immediate future. A retest of the likely support around $1.335 is possible if there’s a significant shift in data, notably jobs and inflation from both countries, or if focus returns to trade tension, but the 100 SMA is likely to be a dynamic support before that.
This is my personal opinion, not the opinion of Exness. This is not a recommendation to trade.
GBPUSD - Buying continuationLooking to keep buying the bullish orderflow on the 15min.
Had a nice sweep of liquidity before creating a new high. Will see how this one plays out over the day
GBPUSD Traders Beware: A Major Drop Could Be ComingThe classic rule says what doesn’t go up must come down. After a failed breakout at 1.3439, GBPUSD is struggling. With longs sitting on big gains from January’s low, a drop toward 1.3361 or even lower looks likely. Watch this key level now.
This content is not directed to residents of the EU or UK. Any opinions, news, research, analyses, prices or other information contained on this website is provided as general market commentary and does not constitute investment advice. ThinkMarkets will not accept liability for any loss or damage including, without limitation, to any loss of profit which may arise directly or indirectly from use of or reliance on such information.

GBP USD longyesterday i gave this idea i think the setup is still viable
Please note: This is for educational purposes only and not a trading signal. These ideas are shared purely for back testing and to exchange views. The goal is to inspire ideas and encourage discussion. If you notice anything wrong, feel free to share your thoughts. In the end, to learn is to share !

GBP/USD PROBABLY !Waiting for confirmation on candles and Real Volume 5min or 15min (power of Real Volume)-without real volume I am like a blind man in a dense forest :)
Tools:
- real volume (proper interpretation)
- Fibonacci expansion ABC (an additional, new goal every day)
- Fibonacci retracement (combined with the real volume, it shows me the real probable movement for the next hours and days)
- volume support and resistance levels (confirmation of the price recovery level)
- oversold/overbought index (focusing on 1H and 4H something is already overvalued or undervalued)
- candlestick patterns (my entry point for 5 minutes or 15 minutes candlestick formations confirmed by particularly increasing volume).

GU 23/07Yesterday our OF changed on the M15 aligning with the H4 trend, I have established H4 as bullish, at the moment in the M15 we have swept a low and broken supply so I want to monitor price as it comes back into my M15 demand in order to look for longs where we start to see LTF OF align with the M15 and H4 trend

GBPUSD H1 I Bearish Reversal Based on the H1 chart analysis, we can see that the price is testing our sell entry at 1.3551, which is an overlap resistance that closes with the 161.8% Fib extension.
Our take profit will be at 1.3499, a pullback support level.
The stop loss will be placed at 1.3584, which is a swing high resistance level.
High Risk Investment Warning
Trading Forex/CFDs on margin carries a high level of risk and may not be suitable for all investors. Leverage can work against you.
Stratos Markets Limited (tradu.com ):
CFDs are complex instruments and come with a high risk of losing money rapidly due to leverage. 66% of retail investor accounts lose money when trading CFDs with this provider. You should consider whether you understand how CFDs work and whether you can afford to take the high risk of losing your money.
Stratos Europe Ltd (tradu.com ):
CFDs are complex instruments and come with a high risk of losing money rapidly due to leverage. 66% of retail investor accounts lose money when trading CFDs with this provider. You should consider whether you understand how CFDs work and whether you can afford to take the high risk of losing your money.
Stratos Global LLC (tradu.com ):
Losses can exceed deposits.
Please be advised that the information presented on TradingView is provided to Tradu (‘Company’, ‘we’) by a third-party provider (‘TFA Global Pte Ltd’). Please be reminded that you are solely responsible for the trading decisions on your account. There is a very high degree of risk involved in trading. Any information and/or content is intended entirely for research, educational and informational purposes only and does not constitute investment or consultation advice or investment strategy. The information is not tailored to the investment needs of any specific person and therefore does not involve a consideration of any of the investment objectives, financial situation or needs of any viewer that may receive it. Kindly also note that past performance is not a reliable indicator of future results. Actual results may differ materially from those anticipated in forward-looking or past performance statements. We assume no liability as to the accuracy or completeness of any of the information and/or content provided herein and the Company cannot be held responsible for any omission, mistake nor for any loss or damage including without limitation to any loss of profit which may arise from reliance on any information supplied by TFA Global Pte Ltd.
The speaker(s) is neither an employee, agent nor representative of Tradu and is therefore acting independently. The opinions given are their own, constitute general market commentary, and do not constitute the opinion or advice of Tradu or any form of personal or investment advice. Tradu neither endorses nor guarantees offerings of third-party speakers, nor is Tradu responsible for the content, veracity or opinions of third-party speakers, presenters or participants.

GBPUSD 4H FRAMEWORK.The British pound starts a new trend to the upside after a long fall against the US dollar, but hopes are still short, as this may be a short-lived move for the pound.
Trade Responsibly.

Bearish reversal off overlap resistance?The Cable (GBP/USD) is rising towards the pivot, which acts as an overlap resistance and could reverse to the 1st support.
Pivot: 1.3611
1st Support: 1.3469
1st Resistance: 1.3693
Risk Warning:
Trading Forex and CFDs carries a high level of risk to your capital and you should only trade with money you can afford to lose. Trading Forex and CFDs may not be suitable for all investors, so please ensure that you fully understand the risks involved and seek independent advice if necessary.
Disclaimer:
The above opinions given constitute general market commentary, and do not constitute the opinion or advice of IC Markets or any form of personal or investment advice.
Any opinions, news, research, analyses, prices, other information, or links to third-party sites contained on this website are provided on an "as-is" basis, are intended only to be informative, is not an advice nor a recommendation, nor research, or a record of our trading prices, or an offer of, or solicitation for a transaction in any financial instrument and thus should not be treated as such. The information provided does not involve any specific investment objectives, financial situation and needs of any specific person who may receive it. Please be aware, that past performance is not a reliable indicator of future performance and/or results. Past Performance or Forward-looking scenarios based upon the reasonable beliefs of the third-party provider are not a guarantee of future performance. Actual results may differ materially from those anticipated in forward-looking or past performance statements. IC Markets makes no representation or warranty and assumes no liability as to the accuracy or completeness of the information provided, nor any loss arising from any investment based on a recommendation, forecast or any information supplied by any third-party.

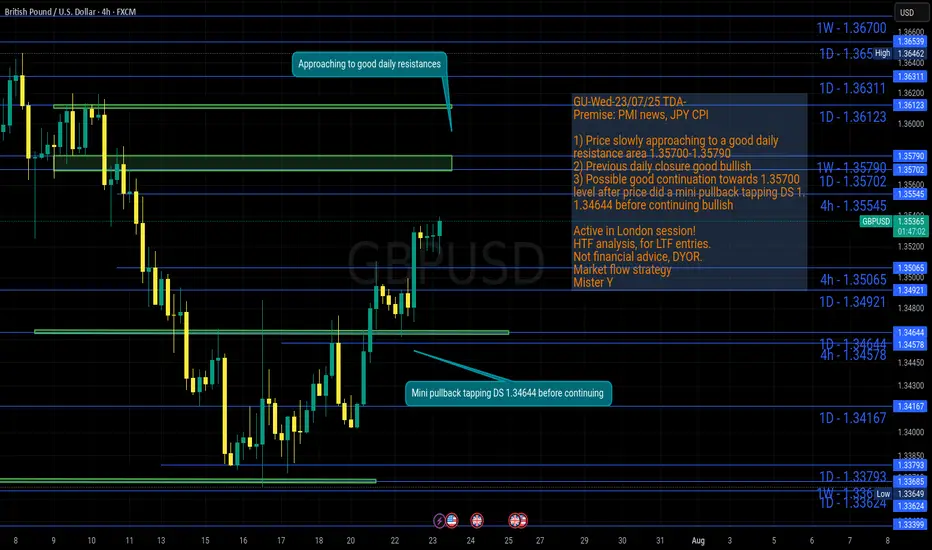
GU-Wed-23/07/25 TDA-GU approaching to a good resistance zoneAnalysis done directly on the chart!
Premise:
A simple idea plan (like Tradingview public posts) won't describe everything.
No one can predict how market will move, it's always good to react to how it moves.
It gives an idea of how price might move, but no one come from FUTURE.
So I always encourage people to openly and actively discuss in real time.
I don't give signals blindly, people should learn
and understand the skill.
Following blindly signals you won't know how to
manage the trade, where precisely put sl and tp,
lot size and replicate the move over time.
That's why you need active real time discussions.
Trading is not get rich quick scheme!
Active in London session!
Not financial advice, DYOR.
Market Flow Strategy
Mister Y
GBPUSD Q3 | D23 | W30 | Y25📊GBPUSD Q3 | D23 | W30 | Y25
Daily Forecast🔍📅
Here’s a short diagnosis of the current chart setup 🧠📈
Higher time frame order blocks have been identified — these are our patient points of interest 🎯🧭.
It’s crucial to wait for a confirmed break of structure 🧱✅ before forming a directional bias.
This keeps us disciplined and aligned with what price action is truly telling us.
📈 Risk Management Protocols
🔑 Core principles:
Max 1% risk per trade
Only execute at pre-identified levels
Use alerts, not emotion
Stick to your RR plan — minimum 1:2
🧠 You’re not paid for how many trades you take, you’re paid for how well you manage risk.
🧠 Weekly FRGNT Insight
"Trade what the market gives, not what your ego wants."
Stay mechanical. Stay focused. Let the probabilities work.
FRGNT

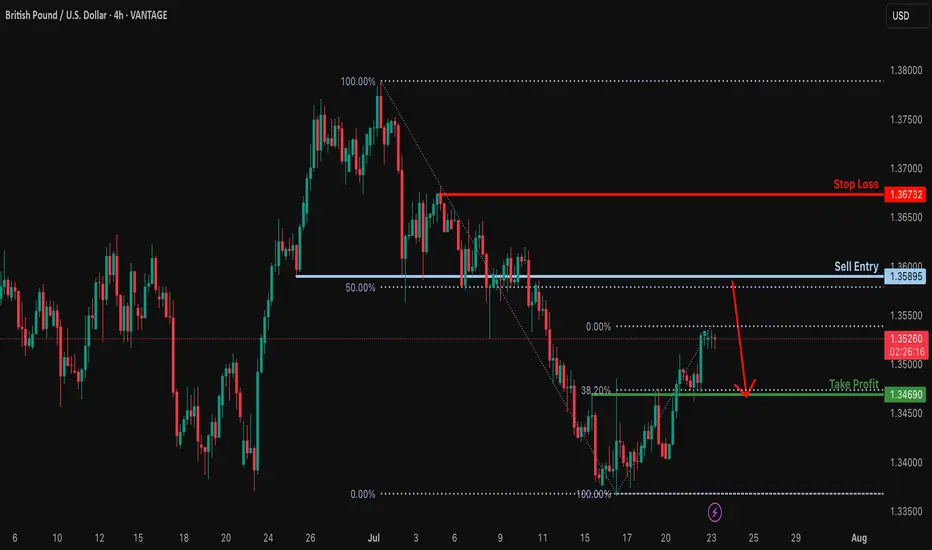
Bearish reversal off 50% Fibonacci resistance?GBP/USD is rising towards the resistance level which his a pullback resistance that lines up with the 50% Fibonacci retracement and could reverse from this level to our take profit.
Entry: 1.3589
Why we like it:
There is a pullback resistance that lines up with the 50% Fibonacci retracement.
Stop loss: 1.3673
Why we like it:
There is a pullback resstance.
Take profit: 1.3469
Why we like it:
There is an overlap support that aligns with the 38.2% Fibonacci retracement.
Enjoying your TradingView experience? Review us!
Please be advised that the information presented on TradingView is provided to Vantage (‘Vantage Global Limited’, ‘we’) by a third-party provider (‘Everest Fortune Group’). Please be reminded that you are solely responsible for the trading decisions on your account. There is a very high degree of risk involved in trading. Any information and/or content is intended entirely for research, educational and informational purposes only and does not constitute investment or consultation advice or investment strategy. The information is not tailored to the investment needs of any specific person and therefore does not involve a consideration of any of the investment objectives, financial situation or needs of any viewer that may receive it. Kindly also note that past performance is not a reliable indicator of future results. Actual results may differ materially from those anticipated in forward-looking or past performance statements. We assume no liability as to the accuracy or completeness of any of the information and/or content provided herein and the Company cannot be held responsible for any omission, mistake nor for any loss or damage including without limitation to any loss of profit which may arise from reliance on any information supplied by Everest Fortune Group.

Fundamental Market Analysis for July 23, 2025 GBPUSDSterling is struggling to hold above 1.35 as fundamentals tilt against it. US CPI has accelerated to 2.7 % y/y, reinforcing expectations that the Fed will delay its easing cycle, whereas in the UK subdued GDP growth and a cooling labour market have revived talk of a Bank of England rate cut as early as August.
Political noise adds to the pressure: London must balance the US’s hard‑line trade stance with the need to mend ties with the EU, heightening uncertainty for businesses. Meanwhile, capital is flowing toward higher‑yielding US Treasuries, sapping demand for UK assets.
The situation is compounded by Britain’s persistent current‑account deficit, which—amid a stronger dollar—requires ever‑higher risk premia to finance. All told, short positions in cable with a tight stop above 1.35750 look attractive in the short run.
Trade recommendation: SELL 1.35250, SL 1.35750, TP 1.34750

EUROUSD NEW OUTLOOKEurousd market is running on both sides
now market looking in bulish trande wait for good opportunity market will touch support zone then ypu can buy from support zone its best for you
TRADE AT YOUR OWN RISK
REGARD ALBERT

GBPUSDReflecting on the loss I took from selling this pair, I realized I had misread the market structure. I'm now anticipating that the uptrend will continue.

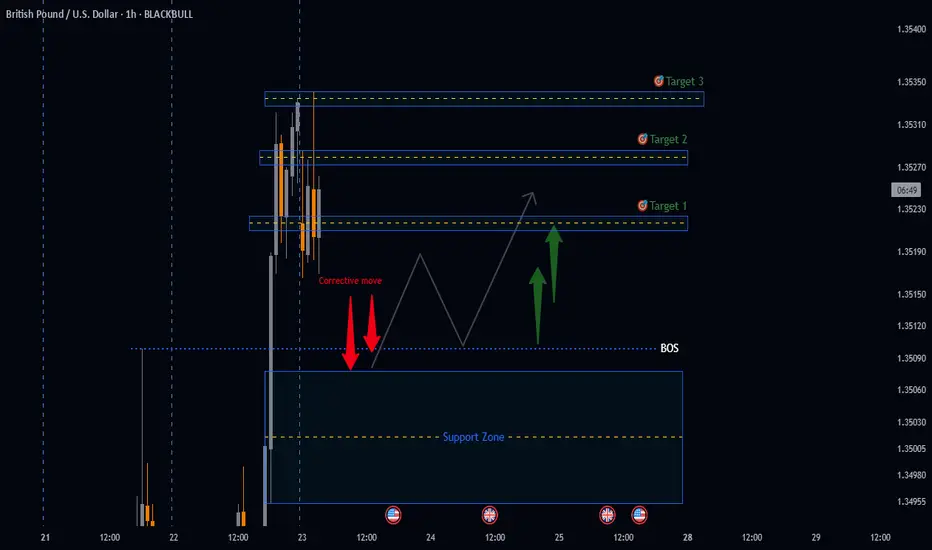
GBPUSD potential BULLISH Setup🚀 GBPUSD UPDATE: BULLISH Setup
Summary:
Analysing price action from yesterday, breakout from the Daily timeframe accumulation zone has materialized with strong conviction.
TRADE SETUP Metrics:
- Entry: ✅
- Stop loss - Below Support Zone
- Target 1: (R:R 1:2)🎯
- Target 2: (R:R 1:3)🎯
- Target 3: (R:R 1:4)🎯
Technical Anticipations:
- Price action to show a Bullish follow-through
- Support zone to hold
Position Management:
- partial profits secured at Target 1
- Stop loss adjusted to breakeven upon reaching Targets
- Final Target 3
LIKE or COMMENT if this idea sparks your interest, or share your thoughts below!
FOLLOW to keep up with fresh ideas.
Tidypips: "Keep It Clean, Trade Mean!"
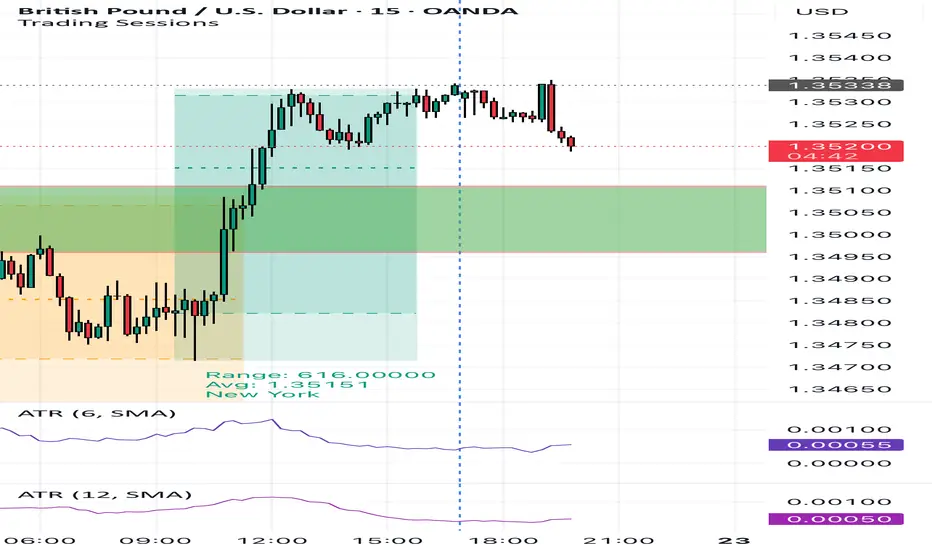
Going shortBreakout from last day high resistance. ATR going up. Sign of short setup. If this breakout and do retest. With confirmation of volume and strong 3rd candle at 15 minutes time frame is strong probability of going short