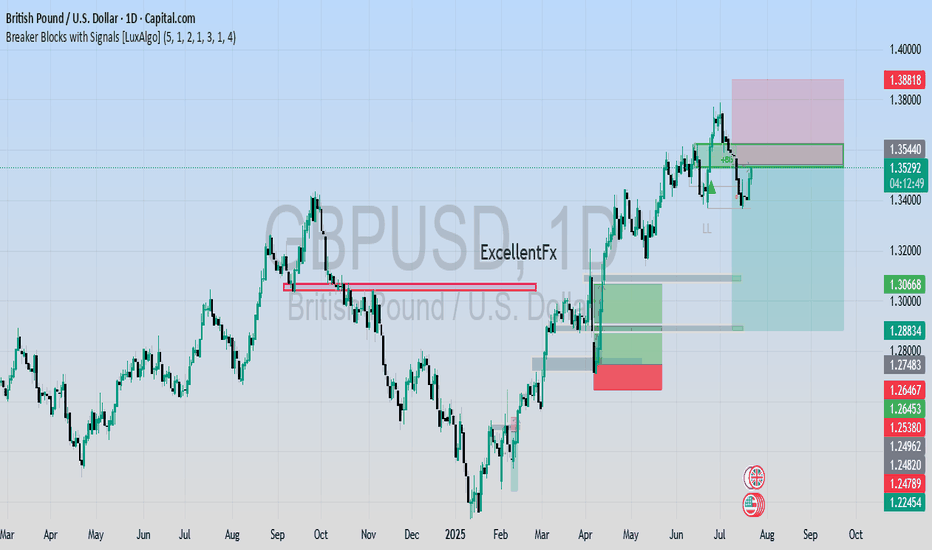
GBPUSD: Mid-Term Analysis💷
Everyone wants to catch the move, but the real edge comes from patience.
🛡️ The Situation:
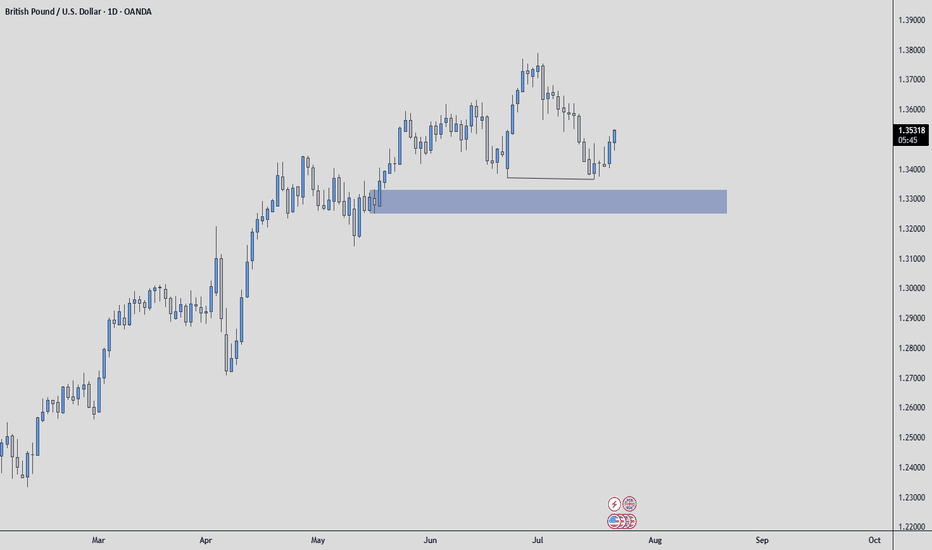
GBPUSD has shown strength, but chasing here isn’t my game.
📍 The Plan:
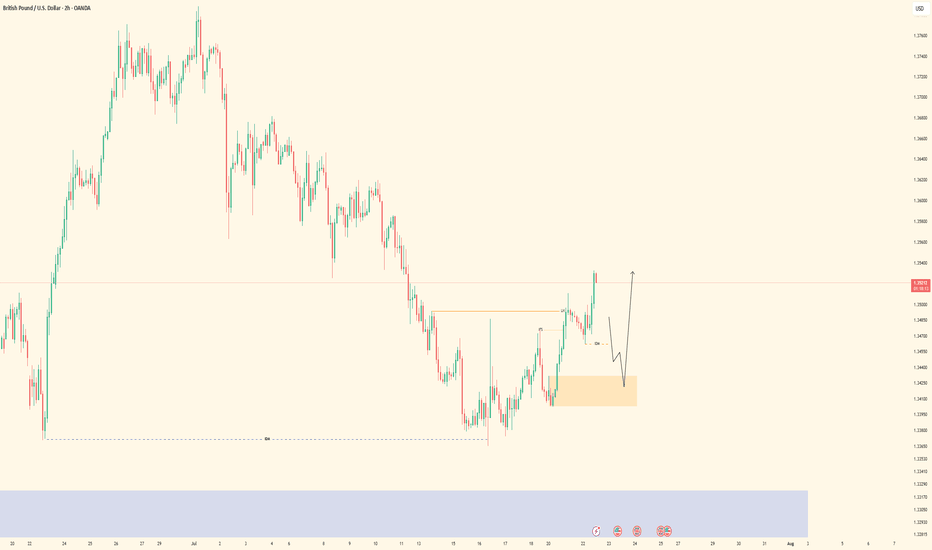
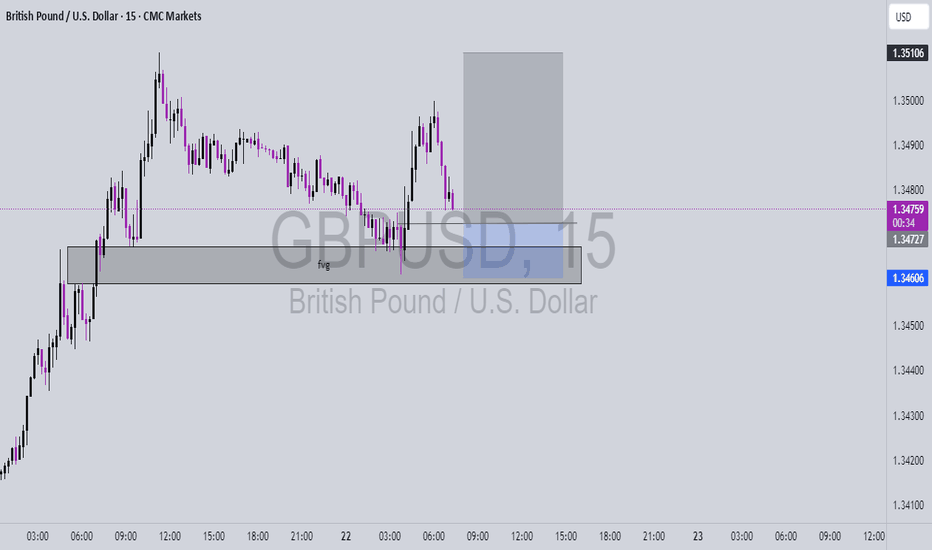
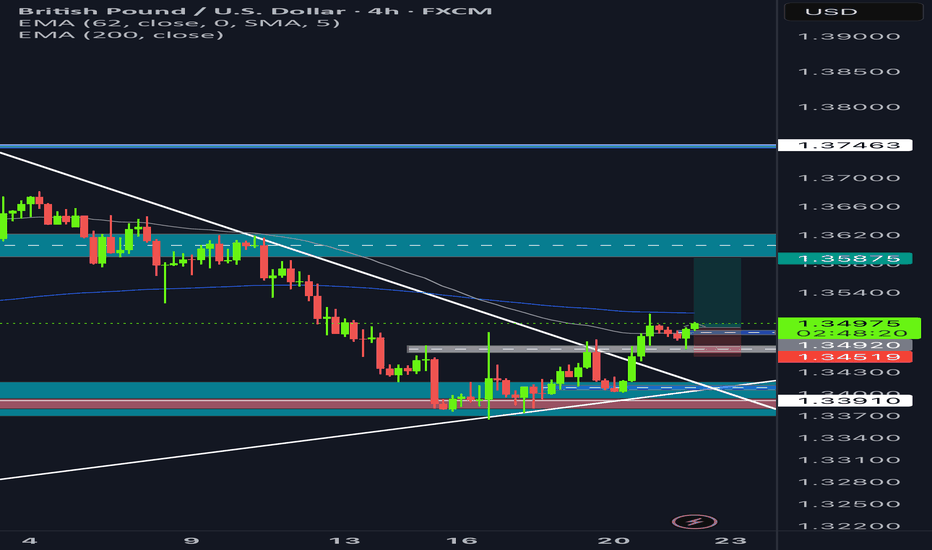
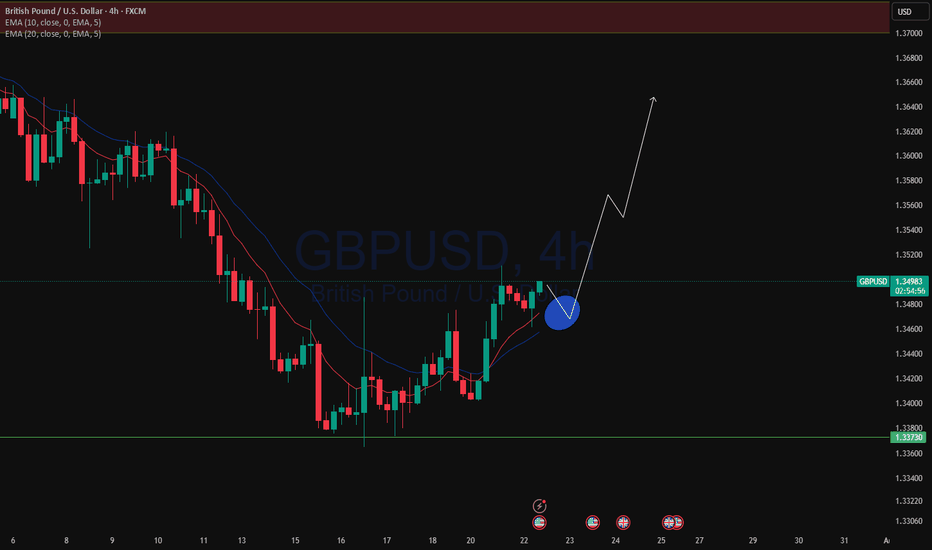
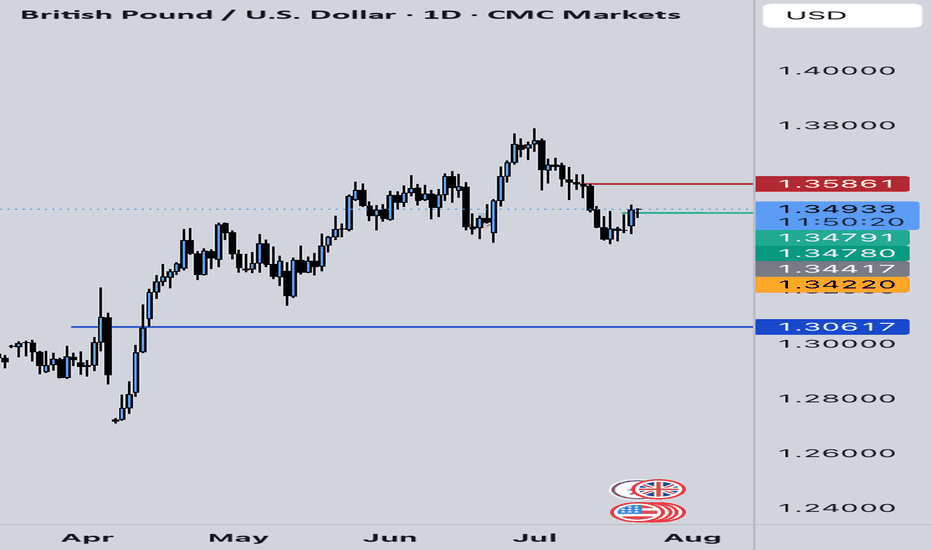
According to orderflow, the next buying point is in the blue box I’ve marked.
That’s where I let the market come to me.
🔎 What I need to see there:
✅ Footprint absorption (clear buyers stepping in)
✅ CDV support or divergence
✅ Structure reclaim for clean confirmation
💡 Why it matters:
Anyone can hit buy, but buying at the right place with confirmation is how you stay in the game.
🎯 What’s next:
If price returns to the blue box and confirms, I will execute with clear risk.
If not, I’ll stay patient and let the market prove itself.
✅ Summary:
Let price come to your level, confirm, and then act decisively.
No chasing. No fear. Just clear, disciplined execution.
GBPUSD trade ideas
GBPUSD| Bullish Structure Intact - Waiting on BSL SweepPair: GBPUSD
Bias: Bullish
Been following price closely while staying in analysis mode — no rush.
Recent structure remains intact and aligned to the upside. Now waiting for a clean BSL sweep to clear liquidity before looking for LTF confirmations to engage in buys.
Momentum is there, structure is clean — I just need price to do its part.
Staying patient. Still in sync.
#GBPUSD #SMC #bullishstructure #orderflow #inducementking #smartmoneytrader
Bless Trading!
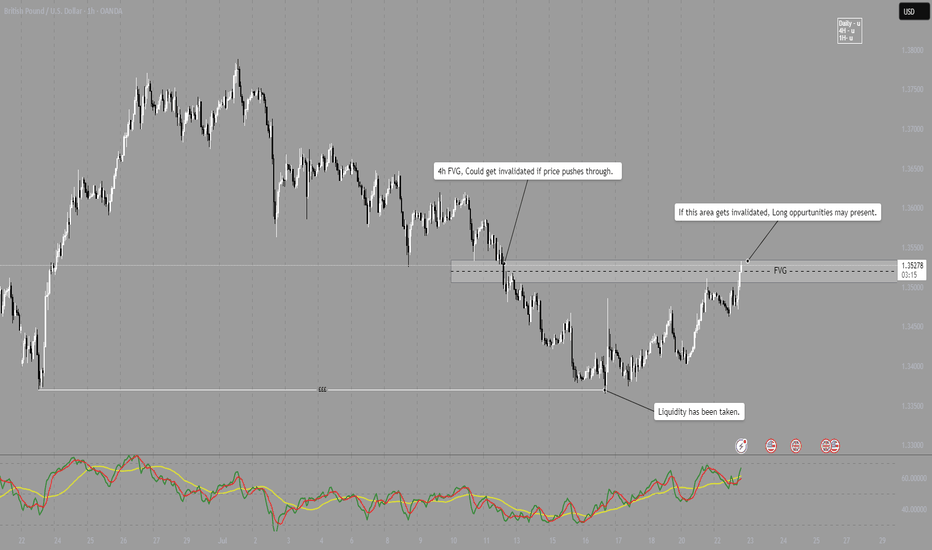
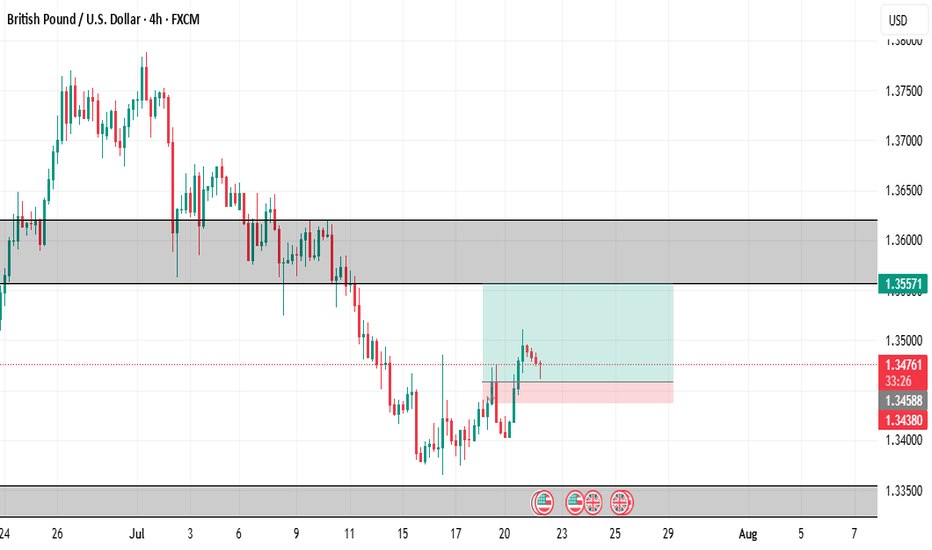
GBP/USD - Potential LONG After sweeping Liquidity last week, GBP/USD has been pushing higher.
Price has now pushed towards a 4H Bearish FVG, if price pushes through this area and its gets invalidated, we can look for Long positions on the lower timeframes.
Note - I only take my trades during London or New York sessions, this is a potential for London open.
GBP/USD — Potential Bullish Reversal Setup | Long Bias Above Sup🧠 Thesis:
GBP/USD is showing early signs of a potential bullish reversal from a key confluence zone. While price has recently tested short-term descending channel, we’re currently testing a strong ascending trendline support and prior demand zone. This setup offers a favorable long-risk scenario — so long as price remains above 1.3335 (invalid level).
🔍 Technical Breakdown:
Descending Channel: Price has been in a corrective downward channel since early July. This pullback appears orderly and corrective rather than impulsive.
Support Zone: We are seeing strong reactions from the 1.3400–1.3440 area, which aligns with:
Previous consolidation zone (mid-May).
200 EMA on the 4H.
Long-term ascending trendline support (from April lows).
Bullish RSI Divergence: RSI is testing oversold territory (~32) with potential for bullish divergence forming — a classic early signal for a bounce.
EMA Cluster: 50 EMA has been breached but price is testing the 200 EMA as last-resort dynamic support. If held, this further adds to the bullish case.
🧭 Scenarios:
✅ Bullish Bias (Preferred)
If price holds above the trendline support and breaks out of the descending channel, we could see a bullish impulse toward:
🎯 TP1: 1.3600 (prior structure)
🎯 TP2: 1.3770 (trendline extension & fib confluence)
Confirmation trigger: Break and close above 1.3500 resistance (channel breakout).
❌ Invalidation:
A decisive break below 1.3335 (marked in red) invalidates this idea and shifts bias back to bearish — potential deeper pullback toward 1.3200s.
⚠️ Risk Management:
Entry zone: 1.3430–1.3450 (near support)
Stop loss: Below 1.3335
Risk-reward: >2.5:1 on a successful breakout
📝 Conclusion:
This is a classic trend-continuation play with clean structure and a logical invalidation point. The market is offering a textbook “buy-the-dip” scenario off strong multi-timeframe support. Patience is key — wait for confirmation before sizing in.
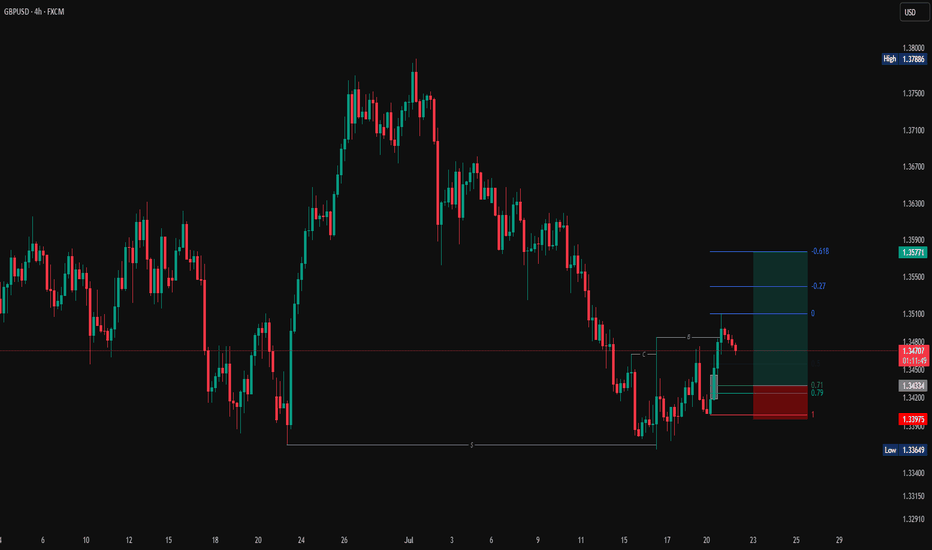
GBPUSD Long📊 Market Structure Overview:
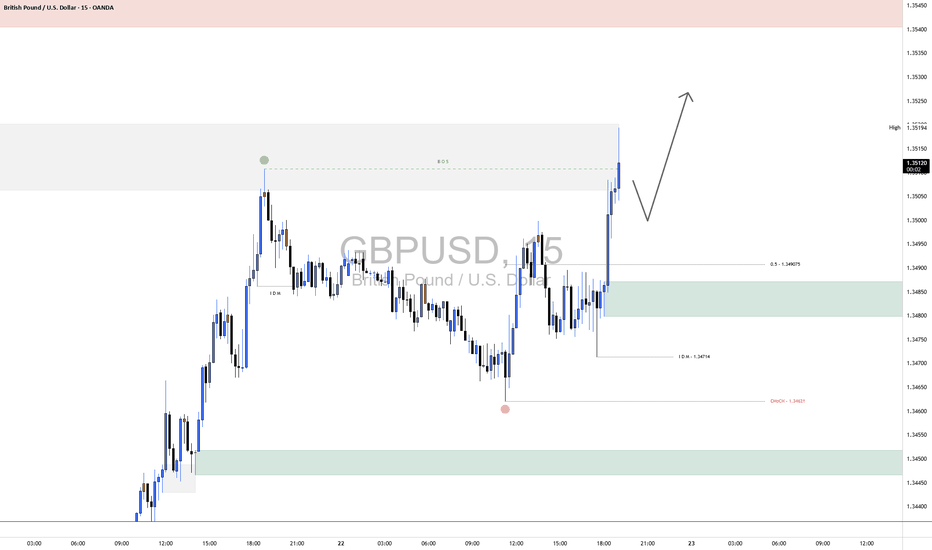
After forming a swing low near 1.3474, GBPUSD respected the demand zone and initiated a strong bullish impulse.
This rally broke above internal market structure, triggering a Break of Structure (BOS) at 1.3519, indicating a momentum shift favoring the bulls.
A short-term retracement is anticipated, offering a potential higher low formation before continuation toward untested higher timeframe liquidity.
📌 Key Zones ("Your Borders"):
🟢 Demand Zone (Support / Re-Entry Area)
Level: 1.3480 – 1.3495
This green demand block is strategically positioned just above the 0.5 Fibonacci retracement level (1.3490) and below the IDM low (1.3474).
This confluence adds strength to the zone, making it a high-probability re-accumulation area where buyers are expected to defend.
If price retests this level after the recent BOS, it may present an ideal long entry opportunity with a bullish continuation target above the local high.
⚪ Mid Supply Zone (Breakout Zone)
Level: 1.3519 – 1.3530 (gray shaded area)
This zone was the prior resistance level before the BOS. Now that price has broken above, it may act as a minor resistance-turned-support if price consolidates or pulls back temporarily.
🔄 Price Expectation:
A pullback into the 1.3480–1.3495 demand zone is anticipated to attract renewed buying pressure.
If bullish structure holds, the market is likely to form a higher low, then resume upward momentum, potentially breaking through the minor supply near 1.3530 and targeting 1.3550–1.3570 as a liquidity draw.
A failure to hold above the IDM low at 1.3474 and the structural CHoCH at 1.3461 would invalidate the bullish scenario and shift bias back to the downside.
GBPUSDHello Traders! 👋
What are your thoughts on GBPUSD?
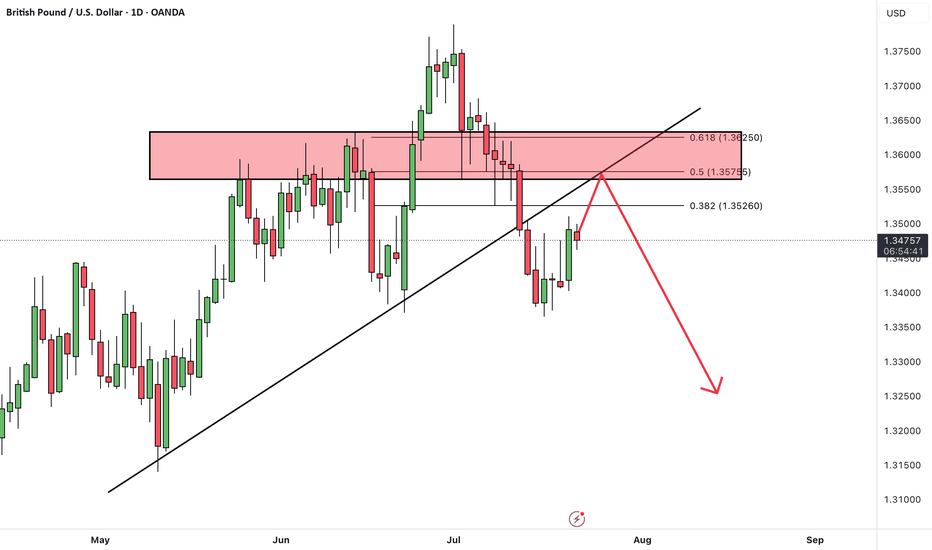
GBP/USD has broken support zone and its ascending trendline, indicating a shift in momentum.
The pair is currently in a pullback phase, retesting the broken support zone, which now acts as resistance.
Once the pullback is complete, we expect further downside toward the next identified support level.
As long as the price remains below the broken zone, the bearish outlook remains valid, and rallies may offer sell opportunities.
Don’t forget to like and share your thoughts in the comments! ❤️
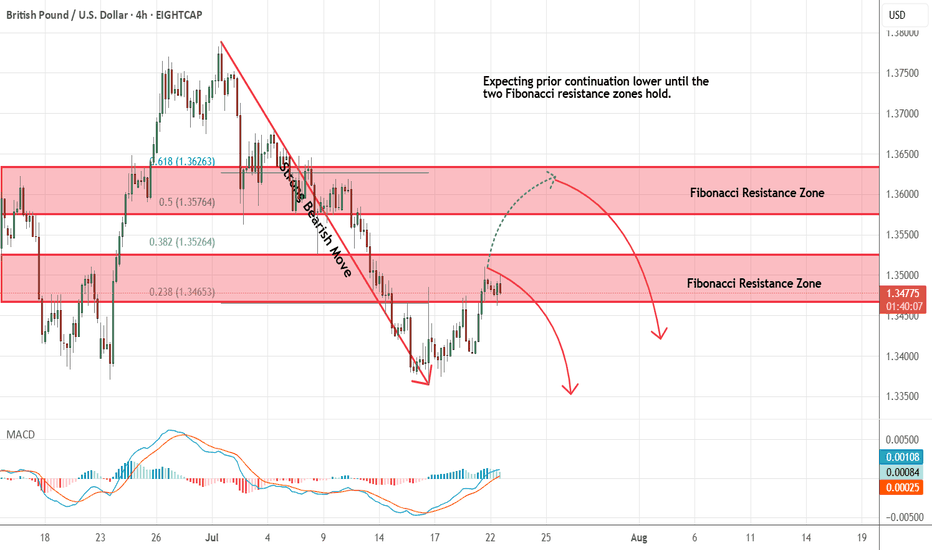
GBPUSD - Looking To Sell Pullbacks In The Short TermH4 - Strong bearish move.
No opposite signs.
Currently it looks like a pullback is happening.
Expecting bearish continuation until the two Fibonacci resistance zones hold.
If you enjoy this idea, don’t forget to LIKE 👍, FOLLOW ✅, SHARE 🙌, and COMMENT ✍! Drop your thoughts and charts below to keep the discussion going. Your support helps keep this content free and reach more people! 🚀
--------------------------------------------------------------------------------------------------------------------
GBPUSDLong opportunity
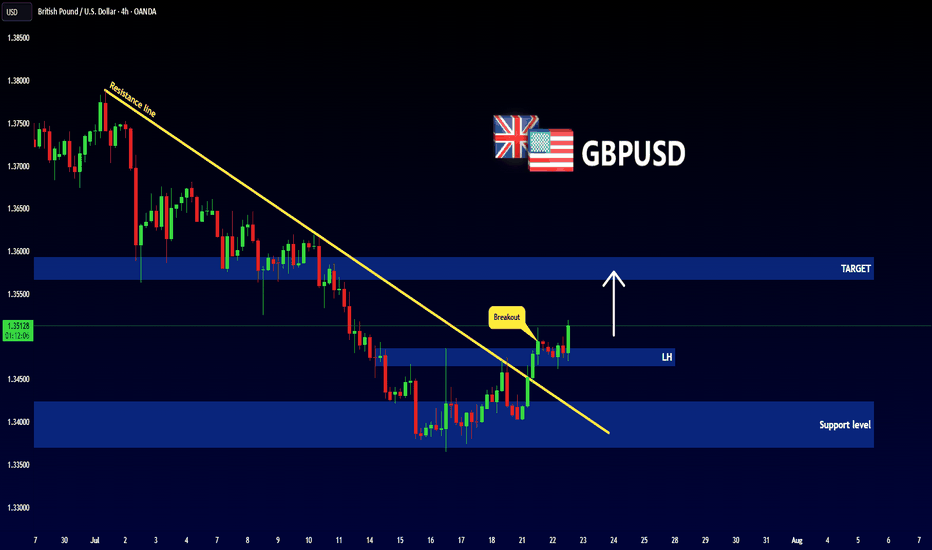
- broke through 4 hr descending trendline
- you can see CHOCH where the grey dashed box is
- continues bullish now
- order block where blue dashed box is
- bullish candle engulfed the previous bearish candle ( this is where i entered )
- SL below demand zone
- TP at major supply zone
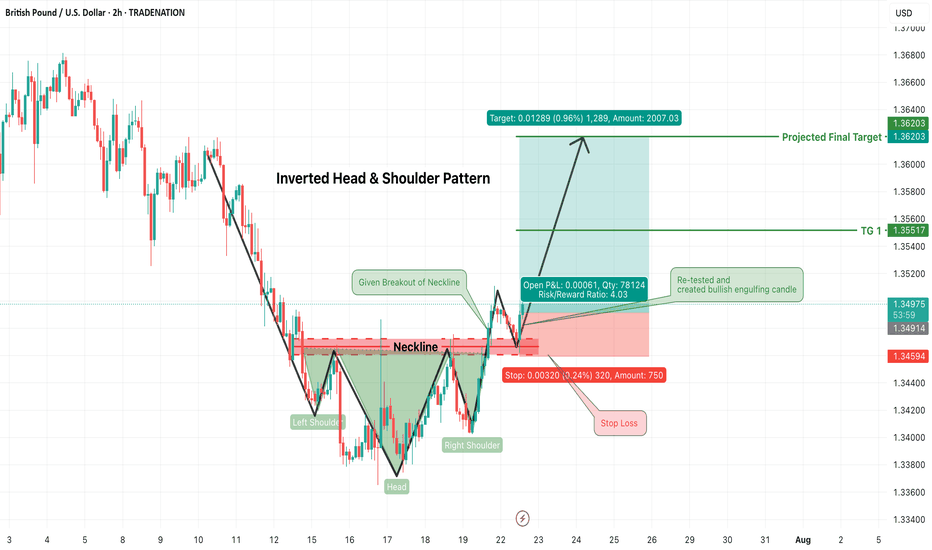
GBPUSD Long Trade Alert – Inverted Head & Shoulders BreakoutGBPUSD has confirmed a classic Inverted Head & Shoulders pattern, signaling a strong bullish reversal opportunity on the 2-hour chart. Price has successfully broken above the neckline resistance zone (~1.3490) and has now retested that zone, forming a bullish engulfing candle — an ideal confirmation for long entries.
🟢 Trade Plan:
Entry: After bullish engulfing candle formed on neckline retest (~1.3490–1.3500)
Stop Loss: Just below the right shoulder low / retest swing low (~1.3455)
Risk/Reward Ratio: ~4:1 (High reward with tightly controlled risk)
🎯 Target Levels:
Target 1: 1.3555
Final Target (Projected): 1.3620
These levels align with structure resistance and measured move of the pattern
📌 Why This Trade Matters:
Pattern confirmed ✅
Retest successful ✅
Bullish confirmation candle ✅
Clean invalidation and upside potential ✅
This is a textbook reversal play, offering solid structure, clear stop placement, and attractive upside. Perfect for swing traders or short-term position setups.
📉 Trade what you see, not what you think. Let price action lead your execution.
=================================================================
Disclosure: I am part of Trade Nation's Influencer program and receive a monthly fee for using their TradingView charts in my analysis.
=================================================================
EURUSD and GBPUSD Analysis todayHello traders, this is a complete multiple timeframe analysis of this pair. We see could find significant trading opportunities as per analysis upon price action confirmation we may take this trade. Smash the like button if you find value in this analysis and drop a comment if you have any questions or let me know which pair to cover in my next analysis.
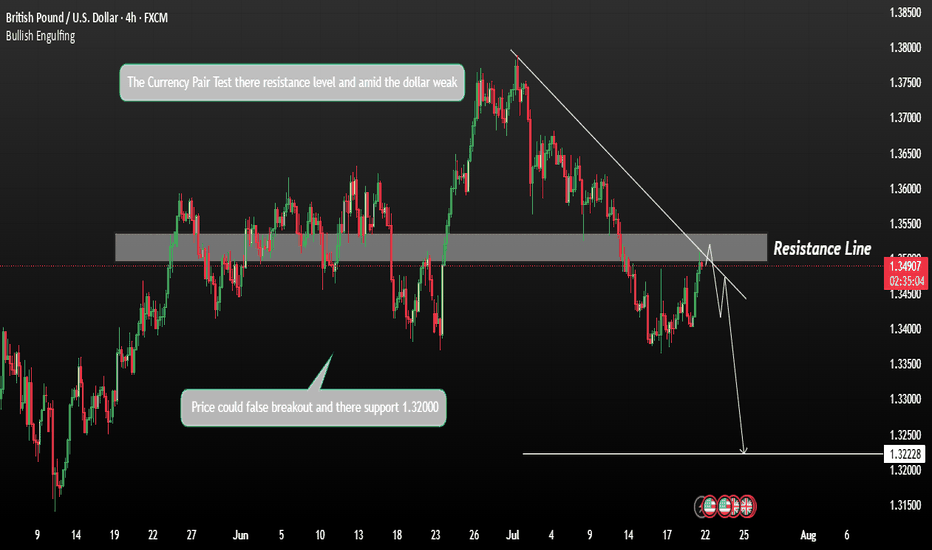
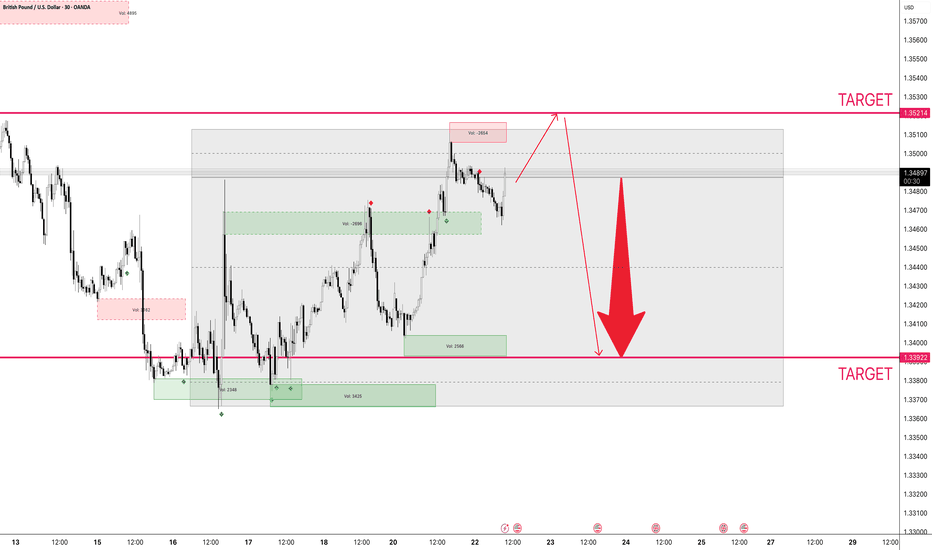
GBPUSD Forming a Fall CorrectionGBPUSD is forming a counter-trend correction and pushing towards a liquidity zone, supported by recent USD weakness.
If price continues to rise amid USD softness, GBPUSD may test the resistance at 1.35500. A rejection or bearish price action from this resistance could trigger a pullback or continuation of the broader downtrend. The downside target remains near 1.32200, aligned with previous demand and potential liquidity zones.
You may find more details in the Chart.
Ps; Support with like and comments for more better analysis.
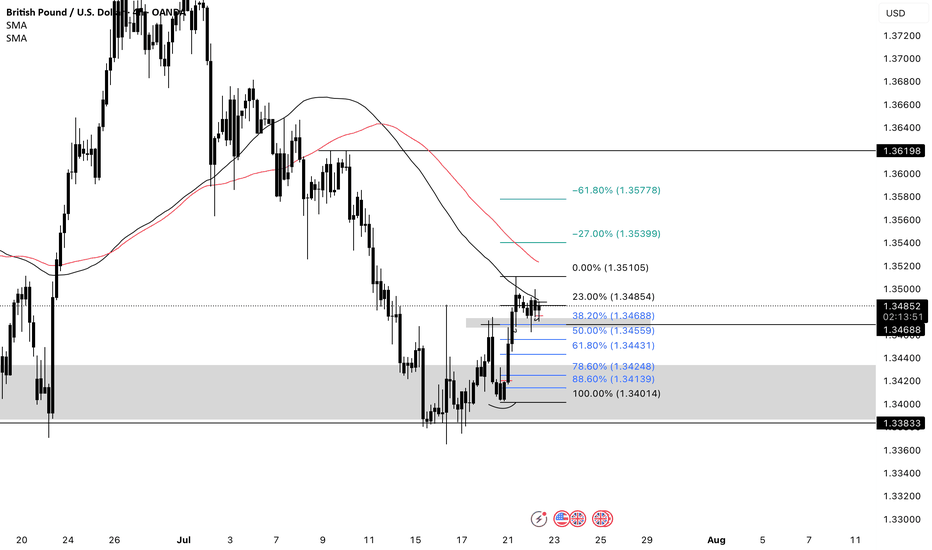
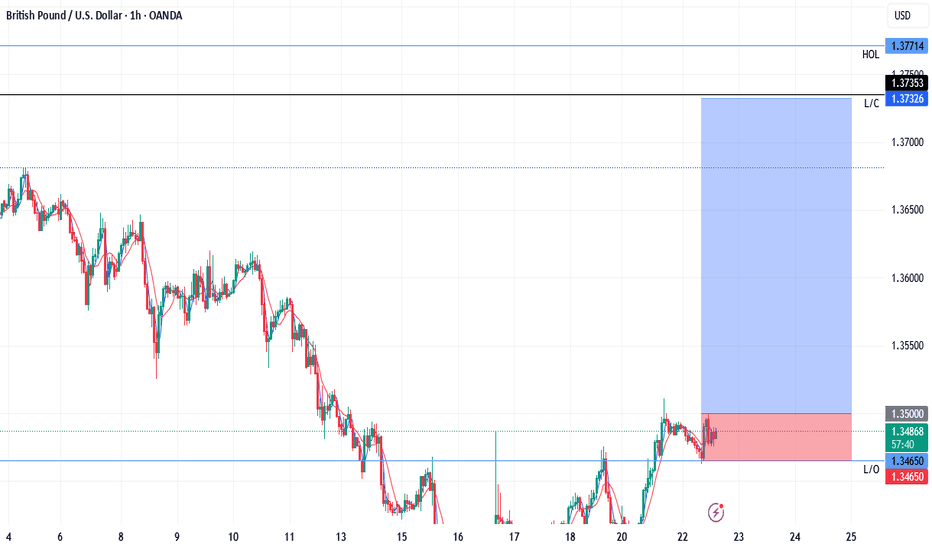
GU 22/07Today I’m looking at potential shorts into the H4 demand zone, we have seen H4 supply break after taking a HTF level of liquidity as marked out by my red line, now I’d like to see H4 demand being respected as our FLOR (first level of respect) to continue higher. Intraday il be wanting to see if the M15 demand fails then supply is retested to look for short opportunities into H4 demand
