GBPUSDBias,to the upside on the CABLE, after,we broke to the upside clearing the Previous Monthly candle Open, price is expected to continue to the upside
GBPUSD trade ideas

GBPUSDThis is the kind of setup I’d get involved in. Whatever happens, happens—this is just my perspective on what might unfold. It may or may not play out, but either way, we grow and learn

GBPUSDOn the 1hr time frame price took sell side liquidity and ran into an FVG, I expect a little push up after the break of internal structure to the area of 1.35060

GBPUSD - Looking To Sell Pullbacks In The Short TermH4 - Strong bearish move.
No opposite signs.
Currently it looks like a pullback is happening.
Expecting bearish continuation until the two Fibonacci resistance zones hold.
If you enjoy this idea, don’t forget to LIKE 👍, FOLLOW ✅, SHARE 🙌, and COMMENT ✍! Drop your thoughts and charts below to keep the discussion going. Your support helps keep this content free and reach more people! 🚀
--------------------------------------------------------------------------------------------------------------------

GBPUSDLong opportunity
- broke through 4 hr descending trendline
- you can see CHOCH where the grey dashed box is
- continues bullish now
- order block where blue dashed box is
- bullish candle engulfed the previous bearish candle ( this is where i entered )
- SL below demand zone
- TP at major supply zone

GBPUSD Long Trade Alert – Inverted Head & Shoulders BreakoutGBPUSD has confirmed a classic Inverted Head & Shoulders pattern, signaling a strong bullish reversal opportunity on the 2-hour chart. Price has successfully broken above the neckline resistance zone (~1.3490) and has now retested that zone, forming a bullish engulfing candle — an ideal confirmation for long entries.
🟢 Trade Plan:
Entry: After bullish engulfing candle formed on neckline retest (~1.3490–1.3500)
Stop Loss: Just below the right shoulder low / retest swing low (~1.3455)
Risk/Reward Ratio: ~4:1 (High reward with tightly controlled risk)
🎯 Target Levels:
Target 1: 1.3555
Final Target (Projected): 1.3620
These levels align with structure resistance and measured move of the pattern
📌 Why This Trade Matters:
Pattern confirmed ✅
Retest successful ✅
Bullish confirmation candle ✅
Clean invalidation and upside potential ✅
This is a textbook reversal play, offering solid structure, clear stop placement, and attractive upside. Perfect for swing traders or short-term position setups.
📉 Trade what you see, not what you think. Let price action lead your execution.
=================================================================
Disclosure: I am part of Trade Nation's Influencer program and receive a monthly fee for using their TradingView charts in my analysis.
=================================================================

EURUSD and GBPUSD Analysis todayHello traders, this is a complete multiple timeframe analysis of this pair. We see could find significant trading opportunities as per analysis upon price action confirmation we may take this trade. Smash the like button if you find value in this analysis and drop a comment if you have any questions or let me know which pair to cover in my next analysis.

GBPUSD Forming a Fall CorrectionGBPUSD is forming a counter-trend correction and pushing towards a liquidity zone, supported by recent USD weakness.
If price continues to rise amid USD softness, GBPUSD may test the resistance at 1.35500. A rejection or bearish price action from this resistance could trigger a pullback or continuation of the broader downtrend. The downside target remains near 1.32200, aligned with previous demand and potential liquidity zones.
You may find more details in the Chart.
Ps; Support with like and comments for more better analysis.

GbpusdI’m looking for bearish movement in pound. It’s a contra trend trade, but I have the right movement in COT

GBP/USD TARGET1 - TARGET2target no. 1, then target no. 2, meaning continued weakening of the GBP against the USD.
Tools:
- real volume (proper interpretation)
- Fibonacci expansion ABC
- Fibonacci retracement
- volume support and resistance levels
- oversold/overbought index
- candlestick patterns

GBPUSD BUY IDEATREND - UPTREND
What's currently happening is a retracement/retest of the previous high for continued buys to the next resistance. H4 close will be confirmation for entries

GU 22/07Today I’m looking at potential shorts into the H4 demand zone, we have seen H4 supply break after taking a HTF level of liquidity as marked out by my red line, now I’d like to see H4 demand being respected as our FLOR (first level of respect) to continue higher. Intraday il be wanting to see if the M15 demand fails then supply is retested to look for short opportunities into H4 demand
bullish reveralThe low has been taken out, and price changed character and broke structure to the upside, we anticipate price to fill the imbalance and test the discount price range before taking off

Could the Cable bounce from here?The price is falling towards the pivot, which lines up with the 50% Fibonacci retracement and could bounce to the 1st resistance.
Pivot: 1.3462
1st Support: 1.3402
1st Resistance: 1.3532
Risk Warning:
Trading Forex and CFDs carries a high level of risk to your capital and you should only trade with money you can afford to lose. Trading Forex and CFDs may not be suitable for all investors, so please ensure that you fully understand the risks involved and seek independent advice if necessary.
Disclaimer:
The above opinions given constitute general market commentary, and do not constitute the opinion or advice of IC Markets or any form of personal or investment advice.
Any opinions, news, research, analyses, prices, other information, or links to third-party sites contained on this website are provided on an "as-is" basis, are intended only to be informative, is not an advice nor a recommendation, nor research, or a record of our trading prices, or an offer of, or solicitation for a transaction in any financial instrument and thus should not be treated as such. The information provided does not involve any specific investment objectives, financial situation and needs of any specific person who may receive it. Please be aware, that past performance is not a reliable indicator of future performance and/or results. Past Performance or Forward-looking scenarios based upon the reasonable beliefs of the third-party provider are not a guarantee of future performance. Actual results may differ materially from those anticipated in forward-looking or past performance statements. IC Markets makes no representation or warranty and assumes no liability as to the accuracy or completeness of the information provided, nor any loss arising from any investment based on a recommendation, forecast or any information supplied by any third-party.

22.07.25 Morning ForecastPairs on Watch -
FX:GBPJPY
FX:AUDUSD
OANDA:XAUUSD
FX:GBPUSD
A short overview of the instruments I am looking at for today, multi-timeframe analysis down to what I will be looking at for an entry. Enjoy!

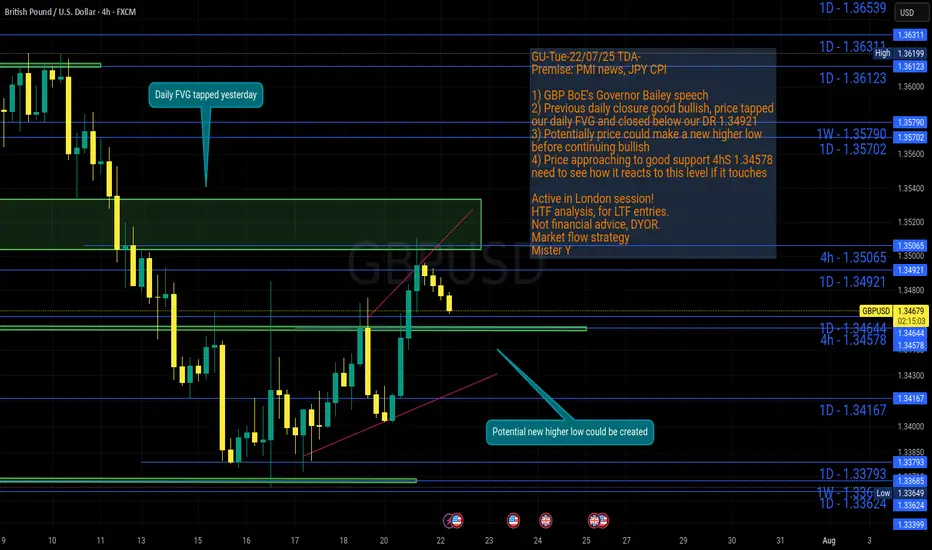
GU-Tue-22/07/25 TDA-Potential new higher low before continue?Analysis done directly on the chart!
Price gave a good bullish closure on daily candle yesterday,
if bullish trend continues, there's a good probability for price
to create a new higher low before continuing up.
Monitor and react to how price move from level to level.
Premise:
A simple idea plan (like Tradingview public posts) won't describe everything.
No one can predict how market will move, it's always good to react to how it moves.
It gives an idea of how price might move, but no one come from FUTURE.
So I always encourage people to openly and actively discuss in real time.
I don't give signals blindly, people should learn
and understand the skill.
Following blindly signals you won't know how to
manage the trade, where precisely put sl and tp,
lot size and replicate the move over time.
That's why you need active real time discussions.
Trading is not get rich quick scheme!
Active in London session!
Not financial advice, DYOR.
Market Flow Strategy
Mister Y
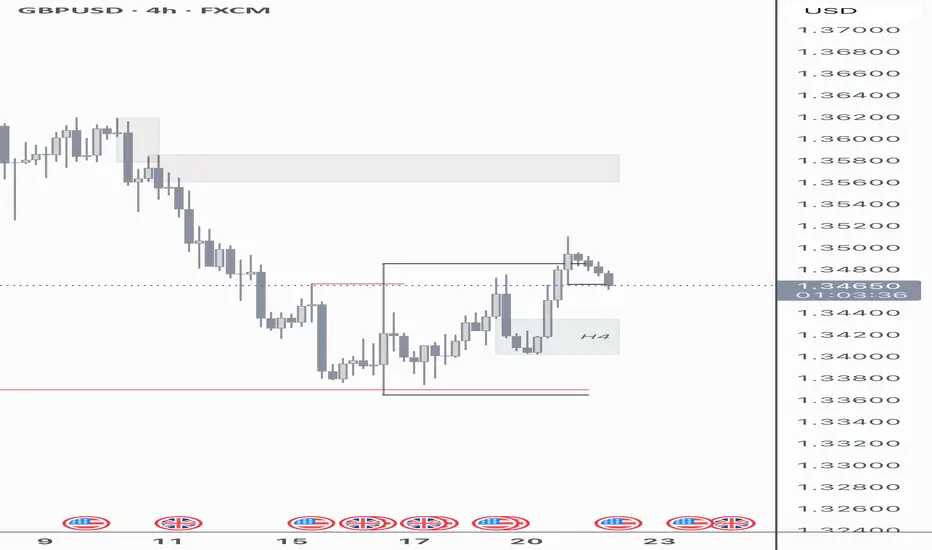
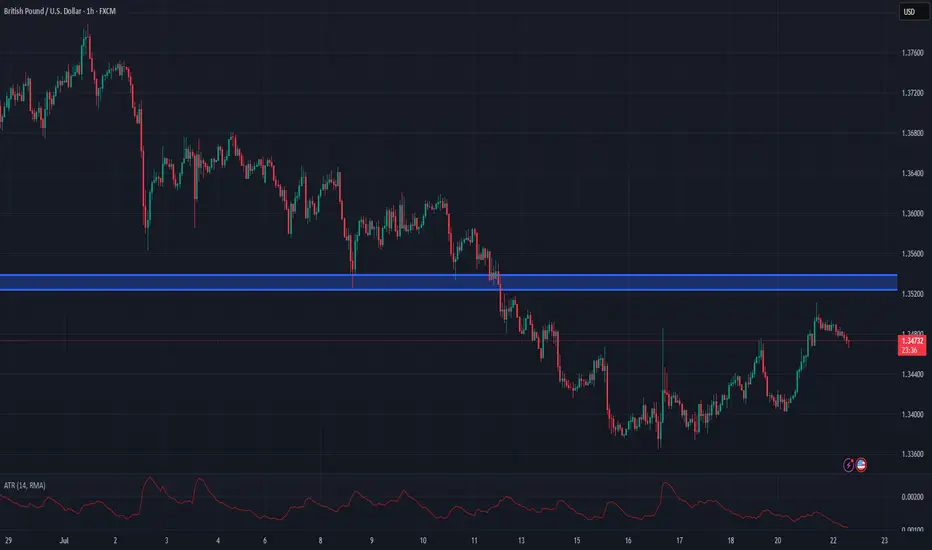
GBPUSD Short on PullbackGBPUSD has been trending down since the start of the July and we can look to get short on retests of the 1.3524-1.3539 area which has acted previously as support and hasn't been retested since we broke down
This area also ties in with the 38.2% retracement from the highs
Stops need to be above 1.3550
Targets can be initially to 1.3450-134.65 with potential to move back to 1.3368-1.3383 and maybe even lower
GBPUSD Short, 21 JulyShort-Term Bearish Bias Despite HTF OB
Even though we sit at a Daily Orderblock (Buy), LTF structure remains bearish, and price respects both D/4H EMA.
📉 Confluence:
Multiple Asia lows unfilled
Clear snap of recent lows
Gap on DXY still open
DXY lacks perfect structure but aligns with 4H EMA and gaps = possible short-term drop
On GU 15m Extreme OB in play
🎯 Entry: Waiting for 1m BOS to confirm sellers stepping in
🛡️ SL: Slight risk, can’t fully cover highs with a 10 pip stop
📌 TP: Focused on completing Asia lows with 1:3 RR target minimum

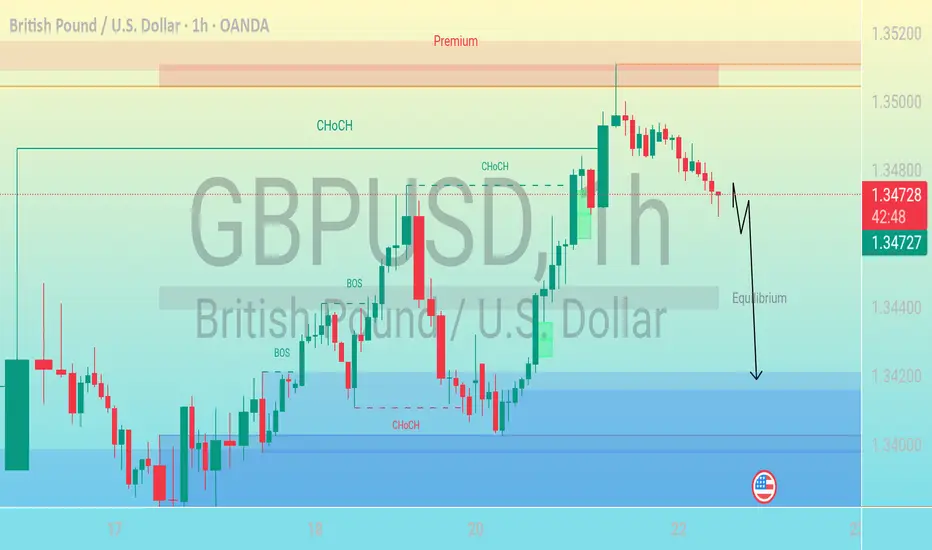
Bearish Move After CHoCH – Targeting Discount Zone"This is a GBP/USD (British Pound / U.S. Dollar) forex trading chart on the 1-hour timeframe, published on TradingView. Let’s break down and describe its key elements:
---
🕒 Timeframe & Pair
Currency Pair: GBP/USD
Timeframe: 1-hour (each candlestick = 1 hour)
Date & Time: July 22, 2025, 06:12 UTC
---
📉 Price Action
Current Price: ~1.34690
The price has recently moved from a premium zone (upper part of the range) and is heading downward.
The red candle at the top shows bearish momentum starting to form after a rally.
---
🔁 Market Structure Labels
CHoCH = Change of Character
Signals a possible reversal or shift in trend (e.g., from bearish to bullish or vice versa).
Several CHoCH points are marked throughout the chart, indicating key shifts.
BOS = Break of Structure
Indicates a significant breach of previous market structure (e.g., support/resistance).
Suggests a trend continuation or momentum confirmation.
---
⚖️ Zones
Premium Zone (Top shaded region):
Price considered overvalued, typically a good area for potential short (sell) positions.
Discount Zone (Bottom shaded region):
Price considered undervalued, potential area for buys.
Equilibrium (Middle horizontal level):
Represents fair value or a midpoint between premium and discount zones.
The price is expected to return here before potentially continuing lower.
---
⬇️ Projected Movement
A downward arrow is drawn from the current price, suggesting:
The analyst expects a pullback to the equilibrium level.
Followed by a further decline into the discount zone around 1.34200 or lower.
---
🇺🇸 News/Event Icon
U.S. flag icon near the expected price drop indicates a potential economic news release or event from the U.S. that could influence the price movement.
GBPUSD Buy at current market priceGBPUSD closed with strong bullish daily candles showing the buyers are stepping in.
Let's ride the wave with current market price.
calculate your own risk & reward.
Good luck

GBPUSD| - Bearish Play Setting UpPair: GBPUSD (GU)
Bias: Bearish
HTF Overview: Bearish structure intact — market has been respecting lower highs and pushing into downside pressure.
Current Zone: Price just mitigated the 30M OB, reacting as expected within the supply zone.
LTF Confirmation: Now waiting for clean confirmations on 5M or 1M — not in trader mode yet, analysis still in control.
Entry Zone: Watching for internal liquidity sweep or inducement followed by structure shift to confirm the sell.
Targets: First target is the next 30M low — extended target based on 1H continuation.
Mindset Note: No chasing — let the LTF tell the story before pulling the trigger. Control the urge, trust the system.
Bless Trading!

GBP USD longpossible scenario for gbp usd
Please note: This is for educational purposes only and not a trading signal. These ideas are shared purely for back testing and to exchange views. The goal is to inspire ideas and encourage discussion. If you notice anything wrong, feel free to share your thoughts. In the end, to learn is to share !

GBPUSD Will Go Down From Resistance! Short!
Here is our detailed technical review for GBPUSD.
Time Frame: 3h
Current Trend: Bearish
Sentiment: Overbought (based on 7-period RSI)
Forecast: Bearish
The market is testing a major horizontal structure 1.347.
Taking into consideration the structure & trend analysis, I believe that the market will reach 1.338 level soon.
P.S
The term oversold refers to a condition where an asset has traded lower in price and has the potential for a price bounce.
Overbought refers to market scenarios where the instrument is traded considerably higher than its fair value. Overvaluation is caused by market sentiments when there is positive news.
Disclosure: I am part of Trade Nation's Influencer program and receive a monthly fee for using their TradingView charts in my analysis.
Like and subscribe and comment my ideas if you enjoy them!
