Short Scalp With Swing OpportunityGBPUSD formed a perfect wedge top, setting up a potential short opportunity in the next days.
1. The move is composed of a clear 3-Push Pattern.
2. The last push/leg is the strongest, indicating a possible exhaustion (Climatic Move).
3. At the top of the last leg, there's a sequence of 5 bars with lots of overlapping - Al Brooks' Final Flag Pattern
With a good bearish signal bar, it's worth scalping part of the position towards to the 20 EMA and swing the rest of it until the Bull TL.
GBPUSD trade ideas

Wednesday Model70% of the time Wednesday is a classic sell
With this Model we take the true Monday high and low(00:00 EST)
Look for a rejection of a Swing high/low from the weekly/monthly TF
4hr CRT and a Market Structure Shift on the 1hr
Entry on the Order Block on the 1hr
Target? the Monday low


Sintra Signals: Central Banks Stay Cautious The ECB Forum in Sintra brought together the heads of the world’s most influential central banks—Lagarde (ECB), Powell (Fed), Bailey (BOE), Ueda (BOJ), and Rhee (BOK).
Across the board, central banks are remaining cautious and data-driven, with no firm commitments on timing for rate changes.
Fed Chair Powell said the U.S. economy is strong, with inflation manageable despite expected summer upticks. He noted tariffs have delayed potential rate cuts and confirmed the Fed is proceeding meeting by meeting.
BOE’s Bailey highlighted signs of softening in the UK economy and said policy remains restrictive but will ease over time. He sees the path of rates continuing downward.
BOJ’s Ueda noted headline inflation is above 2%. Any hikes will depend on underlying core inflation which remains below target.

#GBPUSD: Detailed View Of Next Possible Price Move! GBPUSD exhibited a favourable movement after rejecting a pivotal level previously identified. We anticipate a smooth upward trajectory, potentially reaching approximately 1.45. Conversely, the US Dollar is on the brink of collapse around 90, which will directly propel the price into our take-profit range.
During GBPUSD trading, it is imperative to adhere to precise risk management principles. Significant news is scheduled to be released later this week.
We kindly request your support by liking, commenting, and sharing this idea.
Team Setupsfx_

Short to Long Waiting for the market to reach the poi and wait for reaction to short to the bullish poi
GBPUSDAccording to my Technical analysis GBPUSD pair continue to bearish, i adjust my TP as per price action.
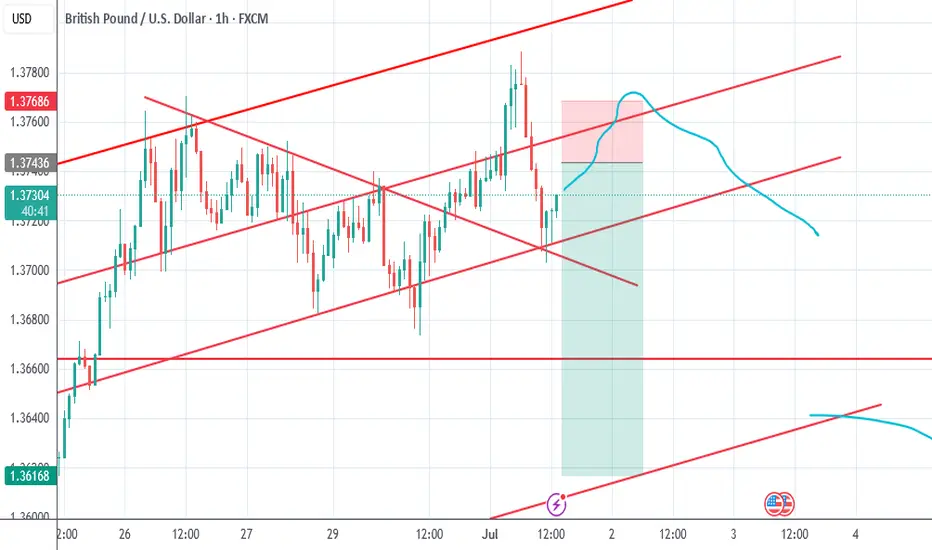
GBPUSD - Bullish Channel (TCB Strategy)📈 GBPUSD – Falling Wedge Breakout Within Bullish Channel (TCB Strategy)
Type: Trend → Countertrend → Breakout
Timeframe: 1H
Status: Trade Running
🔍 Analysis Summary:
GBPUSD is respecting a strong ascending channel, with a recent correction forming a textbook falling wedge pattern. Price has now broken out of the wedge with bullish momentum during the NY session, signaling a potential continuation toward the upper boundary of the channel.
This setup aligns perfectly with my TCB Strategy:
Trend: Bullish market structure intact
Countertrend: Falling wedge correction
Breakout: Clean bullish breakout above wedge resistance
🧠 Trade Plan:
Entry (EP1): 1.37350 (Breakout entry)
SL: 1.36850 (below wedge low)
TP1: 1.37600
TP2: 1.38200 (channel top)
🛠️ Checklist Score: ✅ 100%
All criteria met, including session timing, structure confluence, breakout candle quality, and risk-reward profile.
📌 Watching how price reacts around 1.37600. Clean break above that could open the path to 1.38200+.
Follow for updates.
#GBPUSD #ForexAnalysis #TCBStrategy #BreakoutSetup #FallingWedge #PriceAction

GBPUSD Long, 1 JulyPrice is reacting from a Daily bearish OB, but this setup aims to catch the pullback — making a long valid here despite HTF structure.
LTF gave a clean 15m BOS, followed by reaction from the extreme 15m OB.
Entry was taken after a confirmed 1m BOS + OB retrace, in alignment with structure and location.
🎯 Target: 30 pips (1:3 RR)
⚠️ No clear Asia target, but structure favors this move
📍Entry: 1m OB after BOS
📉 Risk: 0.5%
High-probability pullback play, executed with confirmation and clean structure.

Eurusd And Gbpusd Sell ideas EU 1H
Currently we are in a bulllish trend on EU/GU
And this High might be a short term Top and
EU/GU should sell according to my idea
(This is Counter trend idea And not financial advice
I

GBPUSD GBPUSD will either fall or breakout from the supply roof an ascending trendline ...structure never lies only traders lie.
#gbpusd

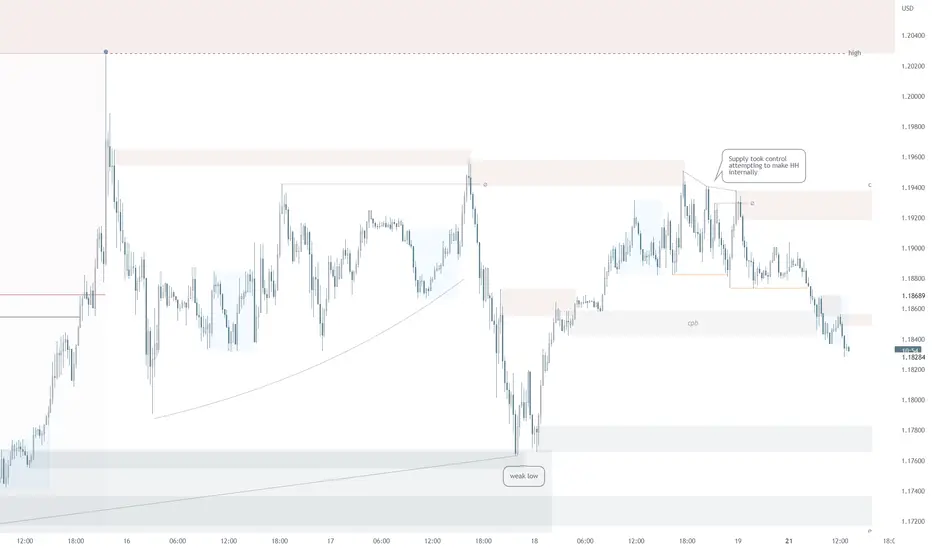
GBPUSD – Short-Term Entry Model (Price Action Based)Education time!
This is a quick-execution on GBPUSD this London session based on a failed breakout and structure shift.
Price initially broke above the previous high but failed to sustain the breakout. The second push failed to print a higher high (HH), signaling potential exhaustion. Once the higher low (HL) that led to the failed HH was broken to the downside, a valid short setup was confirmed.
The trade targets the 161.8% Fibonacci extension of the initial move that failed to hold above the high.
📉 Result: The setup played out cleanly, hitting the target with a +17 pip gain.

GBP/USD Trade Update: Re-Entry After SL Hit – Bullish Bias MaintAfter the initial stop-loss was triggered, price action has realigned with the original bullish outlook. Market structure remains intact, and the recent move appears to be a liquidity sweep rather than a full reversal. I’ve re-entered the buy position at a more favorable level, with a clear invalidation point and defined upside targets.
This re-entry reflects confidence in the broader setup and a commitment to disciplined execution. Sometimes, the best trades require patience and a second entry when the market shakes out weak hands.
📈 Follow for live trade updates, risk management insights, and GBP/USD strategy breakdowns. 💬 Let’s navigate the volatility with precision and purpose.

GBPUSD: Bullish Continuation Ahead.The GBPUSD has established a typical bullish trend following pattern.
Following a significant upward movement, the price entered a correction phase within a bullish flag.
Breaking above the resistance line serves as a strong indicator of continued upward momentum.
I anticipate that the pair could reach the 1.3800 level.

GBPUSDHello traders,
With all news that happening in middle east since yesterday.
I hope ending the war with no humanity loss.
That will affect GBPUSD and GOLD, both of them looks like near the ups.
active now,
Good luck for me and you

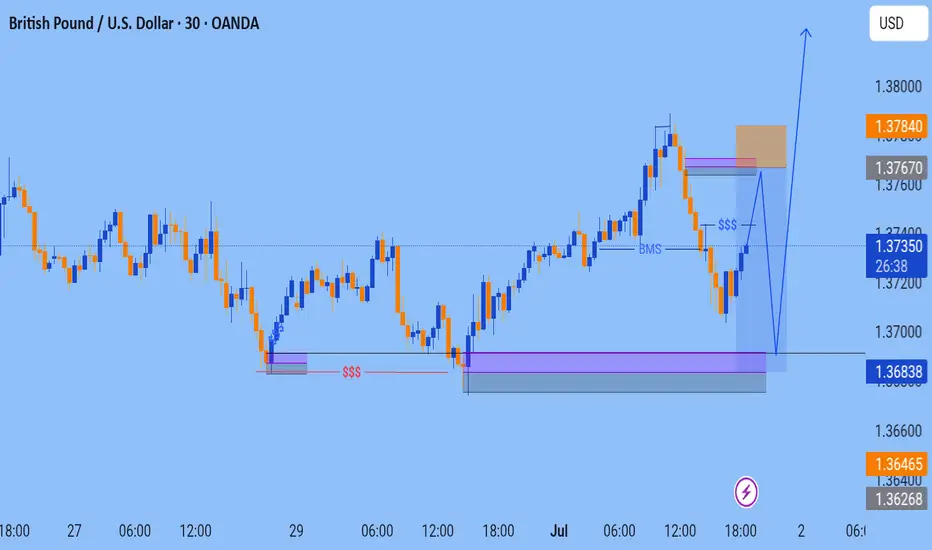
GBP/USD – Bullish Bias Holding Above Demand Zones (1H Chart)📈 GBP/USD – Bullish Bias Holding Above Demand Zones (1H Chart)
The pair is consolidating above key demand zones after a strong bullish move. Price structure suggests buyers are still active.
🔹 First Demand Zone: 1.36561–1.36683
🔹 Secondary Demand Zone: 1.35908–1.36226
🔹 Current Price: 1.37375
📍 As long as price holds above 1.36561, bullish continuation remains on the table. A clean rejection from demand with LTF confirmation could offer fresh long setups.
⚠️ No need to rush — let price test the zone and show intent before buying.
#GBPUSD #FXFOREVER #DemandZone #SmartMoneyTrading #PriceAction #ForexForecast #BullishScenario #StructureSupport


GU-Tue-01/07/25 TDA-Strong resistance area approaching 1.37500Analysis done directly on the chart
Follow for more, possible live trades update!
I often share my live trades in Tradingview public chat in London session, stay tuned!
Timing!
You might ask yourself why sometimes your
trade idea was good but still ended up hitting your sl before it moves to your direction.
The reason is simple: Timing.
price is just not ready to push at that time
and needed extra liquidity and structure before it finally has the force to push.
Understanding when the market is ready is one of the most difficult thing for a trader to do but with experience you start to understand better and improve.
If you like the way I present and analyze, make sure to boost,
share and follow me for more future posts, ideas and useful informations.
Active in London session!
Not financial advice, DYOR.
Market Flow Strategy
Mister Y

GBPUSD D1 LongD1 Long GBPUSD
Based on trend and candle structure
80% probability
TP on next PSYchological level not far at all

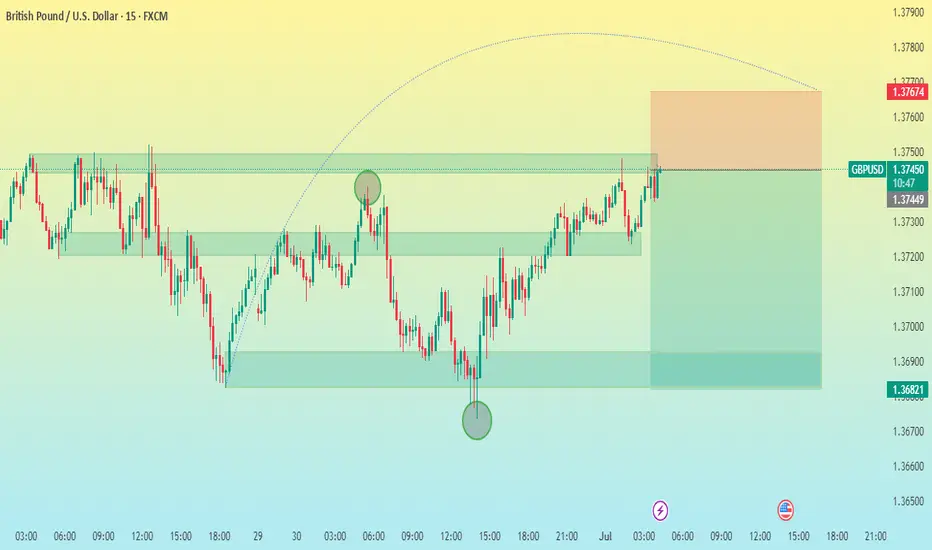
GBP/USD 15M CHART PATTERNHere's a clear summary of your GBP/USD sell trade setup:
---
Trade Type: Sell
Entry Price: 1.37440
✅ Take Profit Targets:
1. TP1: 1.37240
2. TP2: 1.37032
3. TP3: 1.36821
❌ Stop Loss:
SL: 1.37674
---
Risk-Reward Overview:
Risk (SL): 1.37674 - 1.37440 = +23.4 pips
Reward:
TP1: 1.37440 - 1.37240 = 20 pips
TP2: 1.37440 - 1.37032 = 40.8 pips
TP3: 1.37440 - 1.36821 = 61.9 pips
So the best-case reward-to-risk ratio is approximately 2.6:1.
Let me know if you’d like a risk management calculator, trailing stop plan, or chart visualization for this setup.
Updated GBP/USD Trade Idea: New Setup If Price Reaches Key LevelAfter successfully executing the previous trade, I’m now monitoring GBP/USD for a fresh opportunity. If the price reaches this point, it aligns with a high-probability zone where market structure suggests a potential reaction. This area has historically acted as a decision point, and I’ll be watching closely for confirmation before entering the next position.
This updated idea reflects a disciplined, price-action-based approach—focused on timing, structure, and market behavior. Whether you're a day trader or swing trader, this setup offers a clean risk-to-reward profile and fits well within an intraday strategy.
📈 Stay tuned for real-time updates, trade management insights, and detailed breakdowns. 💬 Follow for more GBP/USD strategies and actionable forex content.

GBP/USD Tactical Shift: Long Closed, Short Bias ActivatedAfter successfully capturing the upside move on GBP/USD, price has now reached a key resistance zone where bullish momentum appears to be fading. The recent price action shows signs of exhaustion, with lower highs forming near the top and a noticeable slowdown in buying pressure.
This shift in structure suggests a potential reversal opportunity. I'm now positioning for a short setup, anticipating a corrective move as sellers begin to step in. The risk is clearly defined above the recent highs, with downside targets aligned with previous reaction zones and intraday support levels.
This transition from long to short reflects a dynamic response to evolving market conditions—focused, disciplined, and opportunity-driven.
