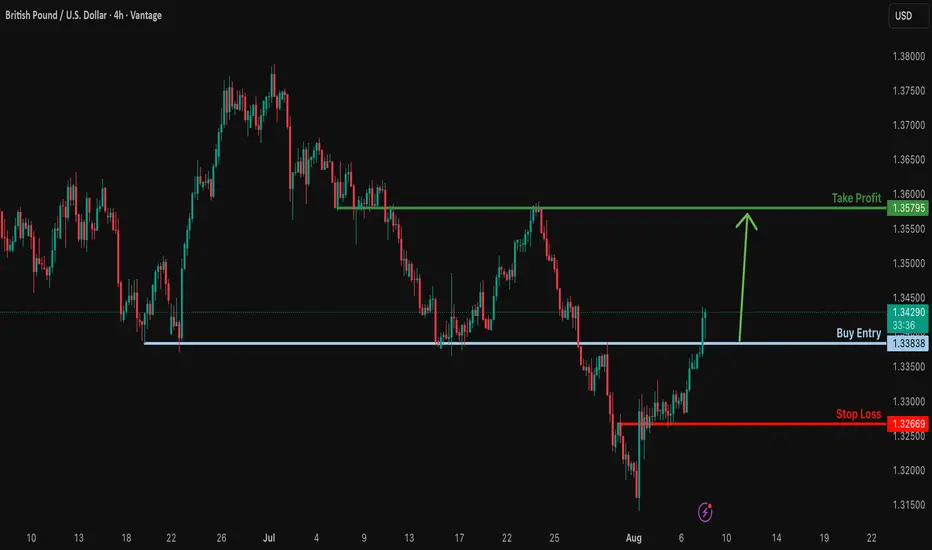
Bullish rise?GBP/USD is reacting off the support level which is an overlap support and could bounce from this level to our take profit.
Entry: 1.3383
Why we like it:
There is an overlap support.
Stop loss: 1.3266
Why we like it:
There is a pullback support.
Take profit: 1.3579
Why we like it:
There is a pullback resistance.
Enjoying your TradingView experience? Review us!
Please be advised that the information presented on TradingView is provided to Vantage (‘Vantage Global Limited’, ‘we’) by a third-party provider (‘Everest Fortune Group’). Please be reminded that you are solely responsible for the trading decisions on your account. There is a very high degree of risk involved in trading. Any information and/or content is intended entirely for research, educational and informational purposes only and does not constitute investment or consultation advice or investment strategy. The information is not tailored to the investment needs of any specific person and therefore does not involve a consideration of any of the investment objectives, financial situation or needs of any viewer that may receive it. Kindly also note that past performance is not a reliable indicator of future results. Actual results may differ materially from those anticipated in forward-looking or past performance statements. We assume no liability as to the accuracy or completeness of any of the information and/or content provided herein and the Company cannot be held responsible for any omission, mistake nor for any loss or damage including without limitation to any loss of profit which may arise from reliance on any information supplied by Everest Fortune Group.
GBPUSD trade ideas
AUDUSD TRADE RECAPIn this video I explained the reasons as to why I didn't take AUDUSD and why I opted to trade GBPUSD! This can be the video that you need to watch before you close up the week. Wishing a good weekend guys

GBPUSD- 4/8/25 - Bearish There was a clear BoS on the HTF with ended with near equal low liquidity as marked below.
Looking for a slightly higher risk bearish trade, i identified the zone that broke structure and placed a sell limit at this zone.
My TP is the equal low liquidity - but i may hold it a little longer but keep trailing my SL.
+ve:
1. HTF BoS to bearish
2. Zone that broke structure clearly identified
3. Equal low liquidity that will draw price back to it soon
-ve:
1. Imbalance above zone that broke structure
2. Large bullish candle formed during last friday that indicates big momentum towards bullish movement for awhile

Sell gbpusdStrong selling expected
Strong buy trend already broken
Lower support also breaks now and monthly still overbought
Ready for the more bearish correction

Sell gbpusd Still remain bearish continuation
Trend buy already broken , lower low also broken
Respecting down trend structure

A Simple Structure Trading Opportunity I like to keep my trading simply and it doesn't get any simpler than this.
IF price action can break & closes beyond the current level of structure resistance, THEN I would expect that price will travel higher... Yeah, that's pretty much it.
If you have any questions or comments, please leave them below.
Akil

GBPUSD 4H: retest done - bearish continuation beginsOn the 4H chart, GBPUSD has completed a textbook head and shoulders pattern. The neckline has already been broken, and the price is now finalizing a retest around 1.3365–1.3380, where the 0.5 Fibo level also lies. This confirms a trend reversal, with the market preparing for the next leg down.
MA and EMA are above the current price, adding pressure to the downside. RSI remains neutral, and volume is shifting in favor of bears. The key resistance zone at 1.3365 has been tested from below, and the price is beginning to roll over - a classic bearish continuation signal.
Targets: 1.3240 first, then 1.3150 and potentially 1.2 870 if momentum builds. The invalidation point is a close above 1.3365, which is not likely at this stage.
Fundamentals support the move: the dollar remains strong as the Fed holds its hawkish stance, while the UK economy continues to show weakness across services and manufacturing.
Neckline broken ✅
Retest done ✅
Momentum building ✅
The setup is complete — time to follow the structure.

Back down to complete H&S pattern? Following on from my last idea, we've completed an ascending triangle right up to the resistance line.
Would like to see it come down now (possible fake out first) to complete the typical H&S rule of thumb.
The rate cut was expected (ie already priced in) hence the pump.
I think a few reasons:
BoE was less dovish than previously thought.
USD is weak due to soft US data (like recent PMI etc).
Break of key resistance levels triggered short covering + momentum buying - but I'm not sure how long it will last, we'll see.
We'll likely see some consolidation now for the next trading week, before making further moves down.
We've got:
CPI + UK unemployment rate acting as potential catalysts the nnext trading week.
Rising US inflation data could trigger USD strength and drag GBPUSD lower.
Higher UK unemployment or weaker wage growth could add downside pressure on GBPUSD.
Positive UK employment surprises or weaker US inflation could give GBPUSD some upside.
So yeah, let's see how this idea pans out...
I have got a conflicting idea just to be prepared, which I'll post in the coming trading days.
Comments always welcome (I'm sure I've missed something).

Sell GBP/USD into trend line to resume recent trend.Sell GBP/USD into recent trend line to resume the trend into 200 Daily MA.
Please note : Adjust profit target as 200 Daily MA will change everyday.
Sell : 1.3460 Trend line
Stop : 1.3552 Above 50 Daily MA
Profit : 1.3000 ( 200 Daily MA ) changes everyday
Risk 1:5

GBP/USD: Fake Breakout Reloads the Channel Play—Bounce Like Ping📉 **
The GBP/USD pair just pulled a classic market move: after cruising in a **descending channel**, complete with reliable support and resistance bounds, it teased traders with a **false breakout**… and then dived right back into the channel. Now that’s what we call a bluff.
🎯 **Trading Insight**
This setup opens the door for a high-probability trade:
- The price is behaving like a **ping-pong ball**, rebounding between the channel floor and ceiling.
- The **fake breakout** wasn't a true escape—just a head-fake to trap early buyers.
- We spot an **ideal entry opportunity**, aiming for a bounce toward the **channel's resistance line**.
🛡️ **Risk Management**
- Set your **stop-loss just below the breakout zone** to stay safe from further fakeouts.
- Target the **upper channel boundary**—where the candlesticks are likely to kiss resistance.
✨ **Why This Chart Pops**
It’s a clean technical play with dramatic flair: structure, trap, return, and momentum. Perfect for traders who love setups that scream precision but come with a twist.
---

Possible sell on GbpUsdPrice is currently reacting on a 15 minutes OB and FVG. Signaling a possible sell trade on GbpUsd

GBPUSD: Is The Market Shifting Bearish Next Week?Welcome back to the Weekly Forex Forecast for the week of Aug 11 - 15th.
In this video, we will analyze the following FX market:
GBPUSD
The Monthly TF chart shows a very bearish engulfment of the June candle by July's candle. August has retraced 50% of that Friday. Prices are now in premium of the range.
- Pound holds gains as markets price out September BoE easing
- US Fed leadership speculation and mixed central bank signals dominate sentiment
Price has stalled with Friday's retracement higher. It's likely to range until Tuesday's CPI Data.
Wait for valid sell setups, as there was a shift in the market from bullish to bearish.
Enjoy!
May profits be upon you.
Leave any questions or comments in the comment section.
I appreciate any feedback from my viewers!
Like and/or subscribe if you want more accurate analysis.
Thank you so much!
Disclaimer:
I do not provide personal investment advice and I am not a qualified licensed investment advisor.
All information found here, including any ideas, opinions, views, predictions, forecasts, commentaries, suggestions, expressed or implied herein, are for informational, entertainment or educational purposes only and should not be construed as personal investment advice. While the information provided is believed to be accurate, it may include errors or inaccuracies.
I will not and cannot be held liable for any actions you take as a result of anything you read here.
Conduct your own due diligence, or consult a licensed financial advisor or broker before making any and all investment decisions. Any investments, trades, speculations, or decisions made on the basis of any information found on this channel, expressed or implied herein, are committed at your own risk, financial or otherwise.

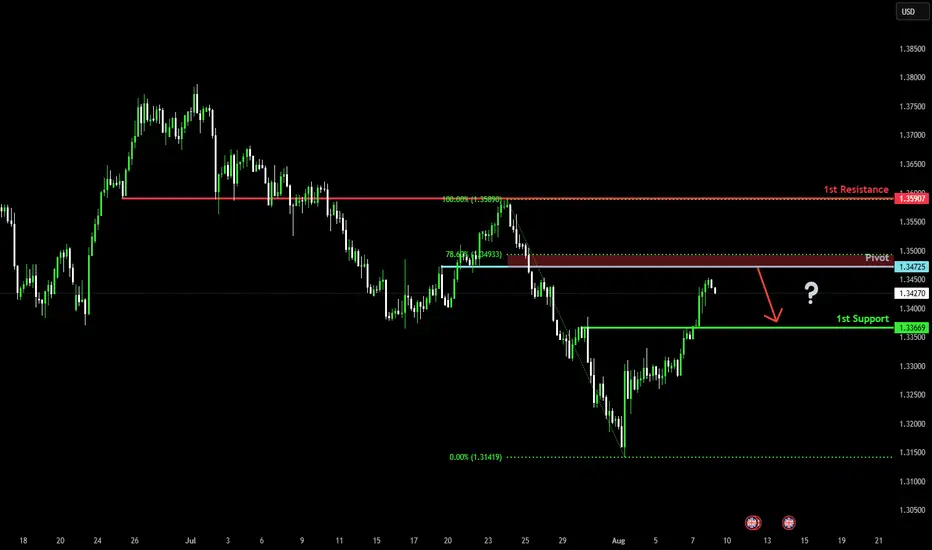
Could the Cable reverse from here?The price is rising towards the pivot and could reverse to the 1st support, which has been identified as a pullback support.
Pivot: 1.3472
1st Support: 1.3366
1st Resistance: 1.3590
Risk Warning:
Trading Forex and CFDs carries a high level of risk to your capital and you should only trade with money you can afford to lose. Trading Forex and CFDs may not be suitable for all investors, so please ensure that you fully understand the risks involved and seek independent advice if necessary.
Disclaimer:
The above opinions given constitute general market commentary, and do not constitute the opinion or advice of IC Markets or any form of personal or investment advice.
Any opinions, news, research, analyses, prices, other information, or links to third-party sites contained on this website are provided on an "as-is" basis, are intended only to be informative, is not an advice nor a recommendation, nor research, or a record of our trading prices, or an offer of, or solicitation for a transaction in any financial instrument and thus should not be treated as such. The information provided does not involve any specific investment objectives, financial situation and needs of any specific person who may receive it. Please be aware, that past performance is not a reliable indicator of future performance and/or results. Past Performance or Forward-looking scenarios based upon the reasonable beliefs of the third-party provider are not a guarantee of future performance. Actual results may differ materially from those anticipated in forward-looking or past performance statements. IC Markets makes no representation or warranty and assumes no liability as to the accuracy or completeness of the information provided, nor any loss arising from any investment based on a recommendation, forecast or any information supplied by any third-party.
Sell gbpusdOur last selling idea already running 500+ pips in selling
More drop expected as USD gonna stronger all cross pairs
Daily support already breaks and also breaks the lower higher low

STRONG SELL BIAS FOR GPBUSD TO 1.32500Buying power from the market is weakening. A STRONG SELL BIAS FOR GPBUSD.
From the chart: H1
The RSI is currently 72.87, above the 70 overbought threshold → indicating that buying momentum is overstretched.
In such conditions, the probability of a pullback or reversal increases,
GBPUSD is touching a previous supply zone / order block (highlighted in red).
This area acted as a strong resistance before, where heavy selling pressure pushed the price down.
Now price has returned to retest it → sellers may step in again.
RSI overbought + Price at supply/resistance = high-probability short setup.
Both an indicator (RSI) and price action (resistance zone) align to give the same SELL bias.
Trade Plan
Entry: SELL Around 1.3450 – 1.3460 (as price is reacting to the resistance zone)
Stop Loss (SL): Above the resistance at 1.3495 (to avoid being stopped out by a small fakeout)
Take Profit (TP):
TP1: 1.3330 (nearest support)
TP2: 1.3210 (major support / green zone in your chart)

GBPUSD-Trade Plan 11/08/2025 +500 Pips !!!Dear Trader ,
Price Almost Hit Top of Descending channel , and I expect the price to enter a corrective phase from the range of 1.34500-1.35000 towards targets of 1.32000, 1.3000, and 1.27000. A good selling opportunity will arise.
Sell Area : 1.34500 - 1.35000
TP : 1.32200
TP : 1.30000
TP : 1.27000
SL : Above 1.36200
regards,
Alireza
Ask ChatGPT

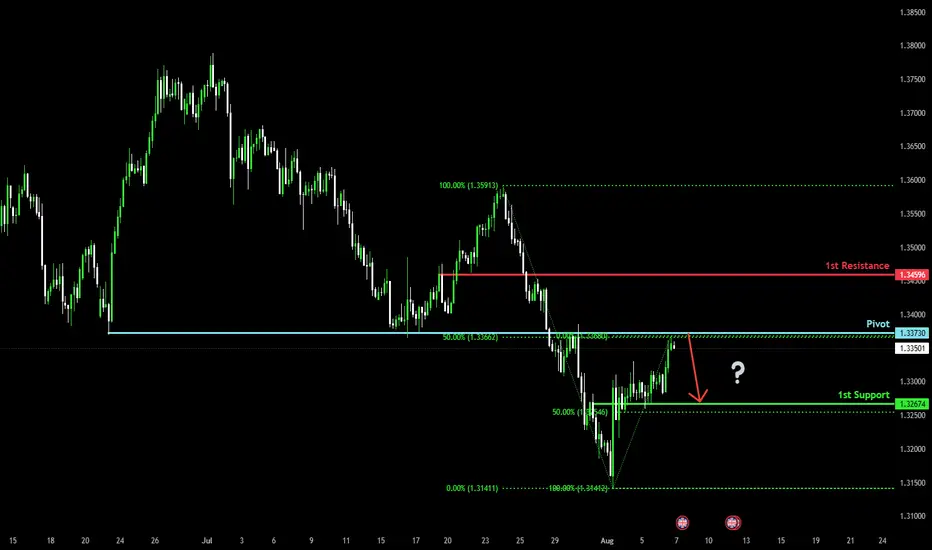
Bearish reversal?The Cable (GBP/USD) is rising towards the pivot which acts as an overlap resistance that lines up with the 50% Fibonacci retracement and could drop to the 1st support.
Pivot: 1.3373
1st Support: 1.3267
1st Resistance: 1.3459
Risk Warning:
Trading Forex and CFDs carries a high level of risk to your capital and you should only trade with money you can afford to lose. Trading Forex and CFDs may not be suitable for all investors, so please ensure that you fully understand the risks involved and seek independent advice if necessary.
Disclaimer:
The above opinions given constitute general market commentary, and do not constitute the opinion or advice of IC Markets or any form of personal or investment advice.
Any opinions, news, research, analyses, prices, other information, or links to third-party sites contained on this website are provided on an "as-is" basis, are intended only to be informative, is not an advice nor a recommendation, nor research, or a record of our trading prices, or an offer of, or solicitation for a transaction in any financial instrument and thus should not be treated as such. The information provided does not involve any specific investment objectives, financial situation and needs of any specific person who may receive it. Please be aware, that past performance is not a reliable indicator of future performance and/or results. Past Performance or Forward-looking scenarios based upon the reasonable beliefs of the third-party provider are not a guarantee of future performance. Actual results may differ materially from those anticipated in forward-looking or past performance statements. IC Markets makes no representation or warranty and assumes no liability as to the accuracy or completeness of the information provided, nor any loss arising from any investment based on a recommendation, forecast or any information supplied by any third-party.

Get ready to sell GBPUSDWaiting for the third touch around our (FVG) and Fibonacci levels and then we go short 👇

GBPUSD at make or break level ahead of a split BOEThe BOE faces a pivotal moment as it prepares to announce its latest interest rate decision.
With MPC members split between hawkish concerns about stubborn inflation and dovish worries over a weakening job market, expectations are swirling about the path forward.
Will the BOE signal a pause after this cut, or will inflation surprises force a more cautious, hawkish stance going into the end of the year?
Traders are watching for clues in the updated forecasts, as even a minor shift could spark major volatility in GBP/USD.
If the BOE sounds hawkish—maybe they raise their inflation forecasts, or the vote split shows strong resistance to further cuts, or they signal a pause in easing—then GBPUSD might have found a bottom for now.
On the flip side, if the BOE puts more emphasis on economic risks, reduces its GDP outlook, or if the vote split shows a strong push for even bigger cuts, then the pound could come under pressure.
On the charts, Cable is clinging to 1.3375, with a potential developing head and shoulders pattern threatening a deeper move lower if the neckline breaks.
Will the upcoming BOE decision be the make-or-break catalyst for the pound?
This content is not directed to residents of the EU or UK. Any opinions, news, research, analyses, prices or other information contained on this website is provided as general market commentary and does not constitute investment advice. ThinkMarkets will not accept liability for any loss or damage including, without limitation, to any loss of profit which may arise directly or indirectly from use of or reliance on such information.

BUY GBPUSDGBPUSD will continue higher. Price looks strong ahead of the highly anticipated BoE statement. A bullish flag further confirms this trade.
GBPUSD Volatility in Focus Ahead of Thursday's BoE Rate DecisionIt’s a new week and GBPUSD is attempting to rebound from a 2-month low that it hit at 1.3140 on Friday. So far, the recovery has been relatively minor, with a high of 1.3308 registered yesterday. Whether the up move can extend from this point or new downside price action is seen may now depend on several factors specifically impacting the UK (GBP) and US (USD) sides of the currency pair.
The bounce in GBPUSD from the lows on Friday began because of the shock weaker than expected US Non-farm Payrolls print, which has called into question the strength of the US economy, leading to a dramatic market repricing of Federal Reserve interest rate expectations and a small reversal of the dollar strength seen through July.
Today sees the release of the US ISM Services PMI at 1500 BST, and FX traders may be looking at this reading to either confirm or disprove the theory that the US economy may now be in a weaker state than thought only several days ago. A reading below 50 = economic contraction and above 50 = economic expansion. Service activity has been the main driver of growth in the US economy and June’s reading was 50.8, so any print below this number could lead to renewed dollar selling and push GBPUSD higher again.
Then on Thursday, the Bank of England (BoE) interest rate decision is released at 1200 BST, quickly followed by the press conference led by Governor Bailey at 1230 BST. The UK central bank is expected to cut rates by 25bps (0.25%), so anything else could be a surprise. The breakdown of the vote between the 9-member decision making committee could also be important given there seems to be a split between those policymakers worried about the strength of UK inflation and those worried about a stuttering UK economy. This is where the comments of Governor Bailey on inflation, growth and future rate cuts could be pivotal for the direction of GBPUSD into the weekend.
Technical Update: Assessing the Trend
Within the technical analysis technique of Fibonacci retracements, after a phase of price strength, the significant price low and significant price high of the move are used to calculate 3 set percentages of the price advance, they are 38.2%, 50% and 61.8%. If price weakness develops after the period of strength, these retracement levels are viewed as potential support to price declines.
In the GBPUSD chart above, we have used 1.2100, posted on January 13th 2025, as the significant price low and 1.3789 registered on July 1st as the significant price high, and have calculated the 3 retracements on this price advance. As you can see, the 38.2% Fibonacci retracement stands at 1.3142 and last Friday’s session low was 1.3140, from which a recovery in price is currently materialising.
Of course, there is no guarantee that 1.3142, the 38.2% Fibonacci retracement support level in GBPUSD will be able to hold or even reverse the current price weakness back to the upside, but it can be helpful to assess what may be the potential support and resistance levels to monitor, particularly if events this week influence price action and lead to an increase in volatility.
Possible Support Levels:
Having seen last week’s price decline held by the 38.2% retracement level at 1.3142, traders could suggest this is now the first support focus, so closing breaks below 1.3142, may lead to a more extended phase of price weakness.
Within Fibonacci techniques, a closing break under a 38.2% retracement support suggests possibilities for a deeper decline in price to the 50% level, and if this in turn is broken towards the deeper 61.8% retracement.
As the chart above shows, in the case of GBPUSD, if closes below 1.3142 support are seen, this might be an indication of the potential for further price weakness to 1.2944 (50% level), even 1.2745 (62% retracement).
Possible Resistance Levels:
Having seen the 1.3142 Fibonacci retracement support limit price declines last week, it is possible traders will now be trying to pinpoint possible resistance levels that if broken on a closing basis, might result in a more extended price recovery.
Within a period of price declines, it is often the declining Bollinger mid-average that is a potential resistance level, and as the chart above shows, in GBPUSD, this currently stands at 1.3413.
Closing breaks above 1.3413 may now be needed to suggest that a more extended phase of strength might be possible, with the next resistance then marked by 1.3589, the July 24th session high, and if this point is broken to the upside, the 1.3789 level which is the July 1st failure high in price.
The material provided here has not been prepared accordance with legal requirements designed to promote the independence of investment research and as such is considered to be a marketing communication. Whilst it is not subject to any prohibition on dealing ahead of the dissemination of investment research, we will not seek to take any advantage before providing it to our clients.
Pepperstone doesn’t represent that the material provided here is accurate, current or complete, and therefore shouldn’t be relied upon as such. The information, whether from a third party or not, isn’t to be considered as a recommendation; or an offer to buy or sell; or the solicitation of an offer to buy or sell any security, financial product or instrument; or to participate in any particular trading strategy. It does not take into account readers’ financial situation or investment objectives. We advise any readers of this content to seek their own advice. Without the approval of Pepperstone, reproduction or redistribution of this information isn’t permitted.

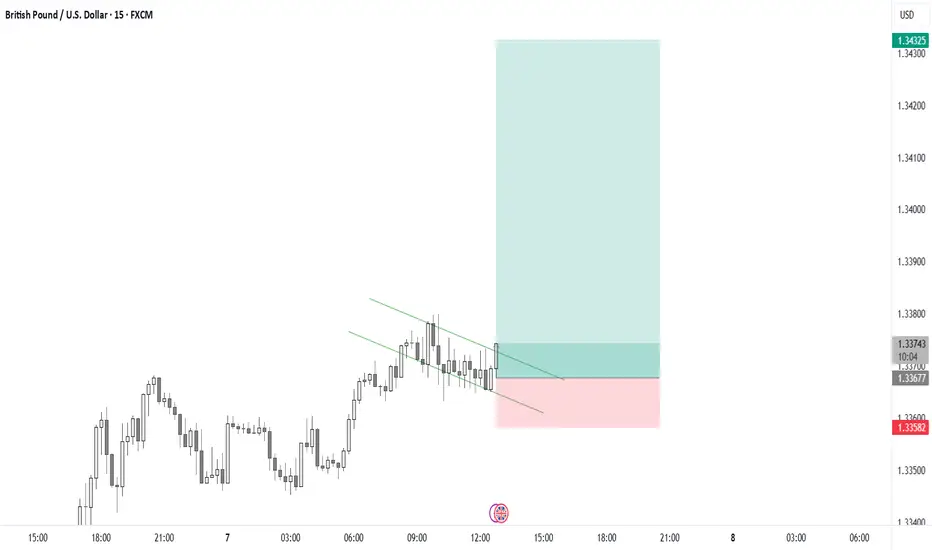
#GBPUSD: Pullback Trade Confirmed?!📈GBPUSD rebounded from the highlighted key support level,
As a confirmation signal i observed a strong bullish Change of Character (CHoCH) on the 4-hour timeframe following its test.
The target is set at 1.3350.
