GBPUSD H4 | Bullish Bounce Off the SupportBased on the H4 chart analysis, the price is falling toward our buy entry level at 1.3507, a pullback support.
Our take profit is set at 1.3577, a pullback resistance.
The stop loss is placed at 1.3449, a pullback support.
High Risk Investment Warning
Trading Forex/CFDs on margin carries a high level of risk and may not be suitable for all investors. Leverage can work against you.
Stratos Markets Limited (tradu.com ):
CFDs are complex instruments and come with a high risk of losing money rapidly due to leverage. 63% of retail investor accounts lose money when trading CFDs with this provider. You should consider whether you understand how CFDs work and whether you can afford to take the high risk of losing your money.
Stratos Europe Ltd (tradu.com ):
CFDs are complex instruments and come with a high risk of losing money rapidly due to leverage. 63% of retail investor accounts lose money when trading CFDs with this provider. You should consider whether you understand how CFDs work and whether you can afford to take the high risk of losing your money.
Stratos Global LLC (tradu.com ):
Losses can exceed deposits.
Please be advised that the information presented on TradingView is provided to Tradu (‘Company’, ‘we’) by a third-party provider (‘TFA Global Pte Ltd’). Please be reminded that you are solely responsible for the trading decisions on your account. There is a very high degree of risk involved in trading. Any information and/or content is intended entirely for research, educational and informational purposes only and does not constitute investment or consultation advice or investment strategy. The information is not tailored to the investment needs of any specific person and therefore does not involve a consideration of any of the investment objectives, financial situation or needs of any viewer that may receive it. Kindly also note that past performance is not a reliable indicator of future results. Actual results may differ materially from those anticipated in forward-looking or past performance statements. We assume no liability as to the accuracy or completeness of any of the information and/or content provided herein and the Company cannot be held responsible for any omission, mistake nor for any loss or damage including without limitation to any loss of profit which may arise from reliance on any information supplied by TFA Global Pte Ltd.
The speaker(s) is neither an employee, agent nor representative of Tradu and is therefore acting independently. The opinions given are their own, constitute general market commentary, and do not constitute the opinion or advice of Tradu or any form of personal or investment advice. Tradu neither endorses nor guarantees offerings of third-party speakers, nor is Tradu responsible for the content, veracity or opinions of third-party speakers, presenters or participants.
GBPUSD trade ideas

GBPUSD buy opportunity It is time to buy GBPUSD with 1% risk. it is coming from a strong support area and nice rejection as well.

GBPUSD Bank of England (BoE) Bank Rate
Current Rate: 4.25% ,the 10 year bond yield GB10Y =4.632%
The BoE reduced its base rate from 4.50% to 4.25% in May 2025 and has maintained it at 4.25% since then (including the June 19, 2025 meeting).
The Monetary Policy Committee (MPC) has signaled a likely gradual easing path with expectations of a 25 basis point cut possibly at the August 7, 2025 meeting, potentially bringing the rate down to around 4.00%.
The BoE’s decision reflects easing inflation pressures as inflation stands at 3.4% but remains cautious due to ongoing economic uncertainties and inflation still above target.
Federal Reserve (Fed) Funds Rate
Current Rate: Approximately 4.50%-4.25% (mid-2025 consensus)
The united state 10 year government bond yield US10Y=4.407%
The Fed has held rates steady at around 4.50% -4.25%, with markets expecting a cautious approach to rate cuts amid inflation concerns and economic data.
The Fed’s policy remains more restrictive compared to the BoE, though some easing is anticipated later in 2025 depending on inflation and growth.
Context
bond yield differential
GB10Y-US10Y=4.632%-4.407%= 0.225% advantage for carry traders in favour GBP.
Interest rate differential
GBP IRT-USD IRT= 4.25%-4.5%=-0.25% ,The Fed rate is about 0.25 percentage points higher than the BoE rate, giving a slight interest rate advantage to the USD over GBP at the short-term policy rate level.
Carry Trade Impact
The carry trade involves borrowing in a currency with a lower interest rate and investing in a currency with a higher rate to earn the spread.
Despite the Fed’s slightly higher policy rate, the BoE’s historically higher rates earlier in 2025 and expectations of a slower pace of Fed cuts have supported GBP carry trades.
The interest rate differential is relatively narrow, so carry trade flows are moderate but still contribute to demand for GBP assets.
The bond yield differential slightly favors GBP at 4.632% gb10y as against USD 4.407% , attracting fixed-income capital to uk treasury giving gbp short term advantage.
#GBPUSD

Intraday Drop into Support Zone — Can GBP/USD Bounce?Hi everyone,
GBP/USD continues to consolidate below the 1.36850 level. Price failed to break above and moved lower into the 1.35300–1.34600 zone, providing us with a clean intraday trade setup.
A drop into this area was highlighted as the more probable short‑term path, and we’re now looking for GBP/USD to find support in this region; and more importantly, to hold above the 1.33800 level to form the base for another push higher.
As previously noted, a decisive break above 1.37500 would renew our expectation for further upside, with the next key target around 1.38400. We'll be monitoring price action closely to see how it unfolds.
We’ll continue to provide updates on the projected path for GBP/USD as price approaches this target.
The longer-term outlook remains bullish, and we expect the rally to continue extending further from the 1.20991 January low towards 1.40000 and 1.417000.
We’ll be keeping you updated throughout the week with how we’re managing our active ideas. Thanks again for all the likes/boosts, comments and follows — we appreciate the support!
All the best for the week ahead. Trade safe.
BluetonaFX

GBP/USD Under Bearish Pressure – Key Levels to WatchThe GBP/USD pair is currently facing sustained bearish pressure as market sentiment shifts in favor of the US dollar. After a period of consolidation, sellers have regained control, pushing the pair lower and challenging recent support zones.
This move reflects broader macroeconomic dynamics, including renewed demand for safe-haven assets and cautious risk sentiment across global markets. The pound’s weakness is further amplified by concerns over the UK’s economic outlook, including sluggish growth prospects and fiscal uncertainty.
From a price action perspective, the pair has broken below a key structural level, confirming bearish momentum. The recent lower highs and lower lows suggest that sellers are firmly in control, and any short-term retracements may be viewed as opportunities to rejoin the downtrend.
What to Watch:
Price reaction near recent swing lows for potential continuation
Any signs of exhaustion from buyers on intraday pullbacks
Volatility around upcoming economic releases that could fuel further downside
Traders should remain cautious and manage risk appropriately, especially with increased volatility during major sessions. The bearish narrative remains intact unless the pair reclaims significant resistance levels with strong conviction.

short idea!hi all. after hitting to a WA and reversing, market needs an LOZ to go lower more. be careful and use your conformation before entering. be happy(wink)

GBPUSD INTRADAY LONG TRADE PLANThe pair is trading near a strong key zone. Expecting a bullish impulse from this zone.
Please do your own analysis before placing any trades.
Cheers and Happy Trading !!!!

Bullish bounce?The Cable (GBP/USD) has bounced off the pivot and oculd rise to the 1st resistance which is a an overlap resistance.
Pivot: 1.3531
1st Support: 1.3423
1st Resistance: 1.3675
Risk Warning:
Trading Forex and CFDs carries a high level of risk to your capital and you should only trade with money you can afford to lose. Trading Forex and CFDs may not be suitable for all investors, so please ensure that you fully understand the risks involved and seek independent advice if necessary.
Disclaimer:
The above opinions given constitute general market commentary, and do not constitute the opinion or advice of IC Markets or any form of personal or investment advice.
Any opinions, news, research, analyses, prices, other information, or links to third-party sites contained on this website are provided on an "as-is" basis, are intended only to be informative, is not an advice nor a recommendation, nor research, or a record of our trading prices, or an offer of, or solicitation for a transaction in any financial instrument and thus should not be treated as such. The information provided does not involve any specific investment objectives, financial situation and needs of any specific person who may receive it. Please be aware, that past performance is not a reliable indicator of future performance and/or results. Past Performance or Forward-looking scenarios based upon the reasonable beliefs of the third-party provider are not a guarantee of future performance. Actual results may differ materially from those anticipated in forward-looking or past performance statements. IC Markets makes no representation or warranty and assumes no liability as to the accuracy or completeness of the information provided, nor any loss arising from any investment based on a recommendation, forecast or any information supplied by any third-party.

Bullish bounce?GBP/USD has bounced off the support level which is a pullback support that aligns with the 61.8% Fibonacci retracement and could rise from this level too ur take profit.
Entry: 1.3531
Why we like it:
There is a pullback support level that aligns with the 61.8% Fibonacci retracement.
Stop loss: 1.3450
Why we like it:
There is a pullback support level that lines up with the 78.6% Fibonacci retracement.
Take profit: 1.3688
Why we like it:
There is an overlap resistance level that aligns with the 61.8% Fibonacci retracement.
Enjoying your TradingView experience? Review us!
Please be advised that the information presented on TradingView is provided to Vantage (‘Vantage Global Limited’, ‘we’) by a third-party provider (‘Everest Fortune Group’). Please be reminded that you are solely responsible for the trading decisions on your account. There is a very high degree of risk involved in trading. Any information and/or content is intended entirely for research, educational and informational purposes only and does not constitute investment or consultation advice or investment strategy. The information is not tailored to the investment needs of any specific person and therefore does not involve a consideration of any of the investment objectives, financial situation or needs of any viewer that may receive it. Kindly also note that past performance is not a reliable indicator of future results. Actual results may differ materially from those anticipated in forward-looking or past performance statements. We assume no liability as to the accuracy or completeness of any of the information and/or content provided herein and the Company cannot be held responsible for any omission, mistake nor for any loss or damage including without limitation to any loss of profit which may arise from reliance on any information supplied by Everest Fortune Group.

GBPUSD - 2 potential selling opportunitiesLooking at GBPUSD
We have 2 potential selling POI's.
The first one being a point in which we will need to sit on our hands for a little bit to see what price does at there is no inducement in the push down in the impulse leg. With that being the case we will need to see some sort of inducement built before we enter that POI
IF we clear the first POI I think I will take a more aggressive entry on the secondary POI that sits a little bit higher. This is due to us having already put in some sort of liquidity in and around that POI before pushing lower.
Will wait and see what happens.
Tomorrow could be a very good trading day

GBPUSD"My current expectation is that the price will continue to move within the descending channel on the 1-hour timeframe. I'm waiting for the price to retest the upper boundary of the channel. If a valid bearish confirmation signal (such as a reversal candlestick pattern) forms at that level, I plan to enter a short position."

A Good Trade & An Even Better Trading LessonA good trading idea on the GBPUSD, looking at a potential bearish trend continuation trade using a breakout & pullback technique. But an even better trading lesson on the importance of having rules for how to analyze the market so that you can avoid confusion and/or conflicting signals.
If you have any questions or comments please leave them below.
Akil

GBPUSD – Bullish Setup within Ascending ChannelGBPUSD is showing bullish potential after rebounding from support inside the ascending channel.
🎯 Targets:
TP1: 1.36124
TP2: 1.36711
⚠️ Invalidation if price drops below 1.34803

Gbpusd long scalpWaiting confirmation with close above 1.35565, entry will at retest of that level for trade #7.
So far 6 out of 100 trades.
5 losses 1 win.

GBPUSD Expected Growth! BUY!
My dear friends,
GBPUSD looks like it will make a good move, and here are the details:
The market is trading on 1.3557 pivot level.
Bias - Bullish
Technical Indicators: Supper Trend generates a clear long signal while Pivot Point HL is currently determining the overall Bullish trend of the market.
Goal - 1.3657
Recommended Stop Loss - 1.3503
About Used Indicators:
Pivot points are a great way to identify areas of support and resistance, but they work best when combined with other kinds of technical analysis
Disclosure: I am part of Trade Nation's Influencer program and receive a monthly fee for using their TradingView charts in my analysis.
———————————
WISH YOU ALL LUCK

GBP/USD30 Mins Frame
🧠 Technical Overview:
Price is currently testing a strong resistance zone after a gradual upward movement, with signs of a potential bearish reversal.
A rising wedge pattern is forming — typically a bearish reversal pattern, especially if broken to the downside.
🧩 Key Technical Elements:
1. Supply Zone:
Defined between 1.3675 and 1.3717 — a previously strong resistance area.
Price is currently facing rejection within this zone, showing weakening bullish momentum.
2. Entry Point:
Sell at 1.36560, triggered by rejection from the resistance zone and a potential breakdown below the ascending support (blue line).
3. Stop Loss:
1.37177, placed above the supply zone — a logical level that invalidates the bearish setup if reached.
4. Targets:
First Target: 1.35602 – a clear previous support level and logical profit-taking zone.
Second Target: 1.34207 – a stronger, more significant support zone, likely to be tested if bearish momentum continues.
📉 Expected Price Action:
The chart shows a weak rising wedge pattern, indicating potential buyer exhaustion.
A break below the ascending trendline (blue) may trigger strong downside movement.
The expected move is illustrated with the red arrow on the chart, indicating a bearish trajectory.
🔥 Risk-to-Reward Ratio (R:R):
First Target:
Potential Reward: ~95 pips
Risk (SL): ~61 pips
→ R:R ≈ 1.56:1
Second Target:
Potential Reward: ~235 pips
→ R:R ≈ 3.85:1
✅ Very favorable, especially toward the second target.
✅ Conclusion:
The short setup is technically valid and supported by price structure and resistance confirmation.
The supply zone has proven strong, and price is struggling to break above it.
A solid trade opportunity for short- to medium-term traders with clearly defined risk and reward.


GBP/USD - Bearish Channel (07.07.2025)The GBP/USD Pair on the M30 timeframe presents a Potential Selling Opportunity due to a recent Formation of a Bearish Channel Pattern. This suggests a shift in momentum towards the downside in the coming hours.
Possible Short Trade:
Entry: Consider Entering A Short Position around Trendline Of The Pattern.
Target Levels:
1st Support – 1.3545
2nd Support – 1.3485
🎁 Please hit the like button and
🎁 Leave a comment to support for My Post !
Your likes and comments are incredibly motivating and will encourage me to share more analysis with you.
Best Regards, KABHI_TA_TRADING
Thank you.
Disclosure: I am part of Trade Nation's Influencer program and receive a monthly fee for using their TradingView charts in my analysis.

GBP/USD💰Symbol: { GBP/USD }
🟩Price: { 1.36990 }
🟥Stop: { 1.37826 }
1️⃣profit: { 1.36536 }
2️⃣profit: { 1.35912 }
3️⃣profit: { 1.35116 }
4️⃣profit: { 1.34483 }
5️⃣profit: { 1.33859 }
📊Check your chart before entering.
🚨Check before use to make sure there is no important news.🚨

Gbpusd long scalp Same idea as previous post, I want to see a close above 1.35832 and a return into that level would be my entry. 3 targets as depicted.

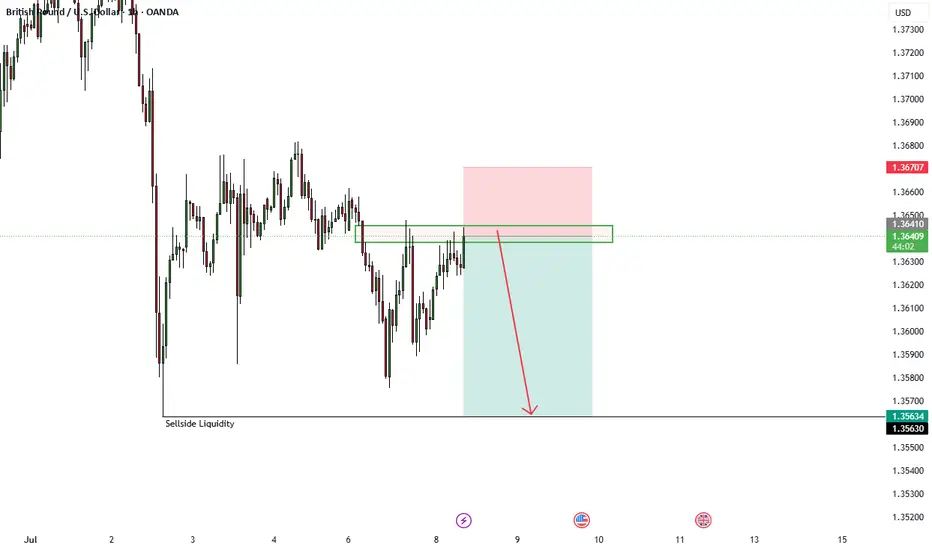
GBPUSD 1:2.64 R Trade Idea - 1hr Liquidity Sweep - ICTBeautiful 1:2.64 Trade Idea for a short on GPBUSD, aiming for the 1hr low to take out the 1hr SS Liquidity
GBPUSD Sell analysis/ideaThis analysis is based on the daily and 4-hour timeframes and executed using reversal trading and trend formation. Complete explanation in the video!

Gbpusd long scalpWe've taken some sellside liquidity. I am expecting price revert back into the range. Simulated trade #6 already triggered at 1.35792 any return into this level would be a good entry or near this level allowing 3 pips.
