GU Bearish Correction, Bullish TrendLower lows set up suitable r:r for a 400pip bearish move.
Higher highs setup timing needed to confirm rejoining the bigger bullish trend.
GBPUSD trade ideas

GBPUSD TRADE RECAP AND ANALYSISFrom the previous day we can see the market had a slight retrace and sold into key support area. will price break this area or not? we will have to wait to find out

GBP/USD Drop: Something Big BrewingGBP/USD is cratering, hitting 1.3550 as weak UK economic data and a soaring dollar dominate. Markets look grim with supports shattered. A liquidity drop could trigger wild swings and wider spreads. Global news adds heat: Trump’s 35% tariff threats on Canada and BRICS nations stir trade war fears, crushing GBP. Stay alert, tighten risk.

GBP USD long After a long run, this could become a setup. To be more certain, you should identify another resistance level above the current price. Once the price breaks above that level, you can consider opening the trade.

GBPUSD: Price Action at Critical JunctureApproaching a Deciding Level : GBPUSD is currently trading near a critical "Deciding Level" (highlighted in grey) around 1.33927. This zone appears to be a crucial pivot point, where the market will likely determine its next significant move.
Uptrend Line as Dynamic Support : An ascending trendline (light blue) originating from January 2025 has consistently provided dynamic support for the price. The current price action is testing this trendline, making its integrity vital for the continuation of the bullish structure.
Identified First Resistance Level Above : A "1st Resistance Level" (highlighted in red) is clearly marked around 1.36000. This level has proven to be a ceiling for recent upward movements and represents the immediate hurdle for bulls.
Strong First Support Level Below : Below the current price, a "1st Support Level" (highlighted in green) is identified between approximately 1.31000 and 1.32000. This zone previously acted as strong support in late April/early May and could serve as a significant demand area if the price breaks below the "Deciding Level" and the trendline.
Disclaimer:
The information provided in this chart is for educational and informational purposes only and should not be considered as investment advice. Trading and investing involve substantial risk and are not suitable for every investor. You should carefully consider your financial situation and consult with a financial advisor before making any investment decisions. The creator of this chart does not guarantee any specific outcome or profit and is not responsible for any losses incurred as a result of using this information. Past performance is not indicative of future results. Use this information at your own risk. This chart has been created for my own improvement in Trading and Investment Analysis. Please do your own analysis before any investments.

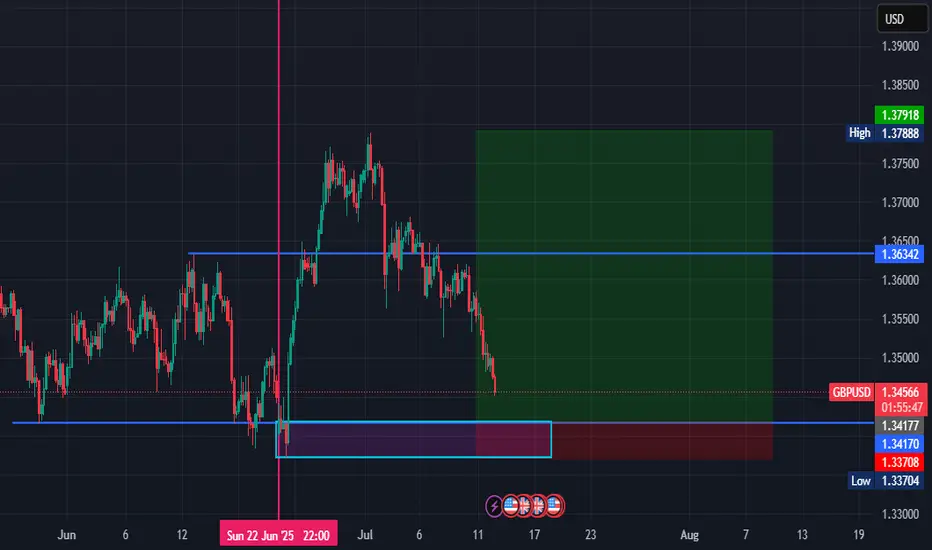
GBPUSD is Nearing the Daily Trend!!!Hey Traders, in tomorrow's trading session we are monitoring GBPUSD for a buying opportunity around 1.34100 zone, GBPUSD is trading in an uptrend and currently is in a correction phase in which it is approaching the trend at 1.34100 support and resistance area.
Trade safe, Joe.
GBPUSD BULLISH ANALYSISGBP/USD is on a gradual recovery from three-week lows, testing 1.3450 in Tuesday's European trading. A cautiously optimistic market mood combined with a broadly weaker US Dollar underpins the pair ahead of the critical US CPI data and BoE Governor Bailey's speech.

Cable looking for a new high with Ending DiagonalCable found some support in the last 24 hours and it looks like we may still see a retest of the high, so apparently this 5th wave is still in progress but unfolding with an ending diagonal with subwave five on the way up to 1.37–1.38, which could be the key resistance for this reversal pattern. So despite some recovery that is happening right now, we still think that the impulse from January is in late stages, which is also confirmed by divergence on the RSI and overlapping price action that clearly suggests that bulls are losing strength up here.
GH

GBPUSD Will Explode! BUY!
My dear friends,
My technical analysis for GBPUSD is below:
The market is trading on 1.3409 pivot level.
Bias - Bullish
Technical Indicators: Both Super Trend & Pivot HL indicate a highly probable Bullish continuation.
Target - 1.3535
Recommended Stop Loss - 1.3347
About Used Indicators:
A pivot point is a technical analysis indicator, or calculations, used to determine the overall trend of the market over different time frames.
Disclosure: I am part of Trade Nation's Influencer program and receive a monthly fee for using their TradingView charts in my analysis.
———————————
WISH YOU ALL LUCK
GBPUSD London PlayWhat I see and what I am in, already 1:3RR and will keep an eye for news in 2 hours as well as the lower levels marked
GBPUSD Possible buy moveWeekly break of structure, signifying a possible bullish trend. Price formed a demand zone on the weekly, also signifying a strong bullish trend. Price retracing to the 4hr demand zone for possible entry for a buy.
Note: Risk Management Very Important.
GBP/USD still under pressure despite slightly weaker US core CPIThe US dollar, which had gained ground last week, was under a bit of pressure earlier today. And following a mixed inflation report, the greenback spiked before returning to pre-CPI levels. The inflation report hasn’t changed market’s perception about the likely path of interest rates.
US CPI comes in mixed
June’s CPI rose 0.3% MoM and 2.7% YoY—hotter than the prior 2.4% and above the 2.6% consensus. However, core CPI was a touch weaker, rising 0.2% m/m instead of 0.3%, while the y/y rate was 2.9% as expected.
The mixed CPI report means concerns that inflation may persist longer haven’t changed. The Fed may still delay or reduce the scope of any rate cuts, even if a September move is still on the table.
Adding to the dollar’s appeal, President Trump floated steep tariffs—35% on some Canadian goods and up to 30% on imports from Mexico and the EU—if deals aren’t reached by August 1. These protectionist signals and Trump’s expansive fiscal stance could further stoke inflation, supporting the greenback if confidence in US monetary policy holds.
Pound under pressure
Sterling has had a rough start to the week, extending last week’s 1% drop in GBP/USD before rebounding slightly earlier today. The pound's slide follows a run of soft UK economic data, boosting expectations for a Bank of England rate cut—likely in August. On Friday, data confirmed a second consecutive monthly contraction in the UK economy, driven by a worsening manufacturing slump. This has added to speculation that weakening growth and a stronger pound could help ease imported inflation, especially ahead of Wednesday’s UK CPI release.
Technical picture and key data ahead for GBP/USD
GBP/USD has broken below important support zones (1.3630 and 1.3530–1.3550), now turned resistance. It is currently testing the 1.3434 level, aligned with a key trendline. A breakdown here could open the door to deeper losses toward 1.3370 and potentially the low 1.30s.
Two major data points will guide the pair this week:
• UK CPI (July 16): A soft print would likely reinforce rate cut bets.
• US Retail Sales (July 17): After a May decline, a rebound could highlight US resilience and strengthen the dollar further.
By Fawad Razaqzada, market analyst with FOREX.com
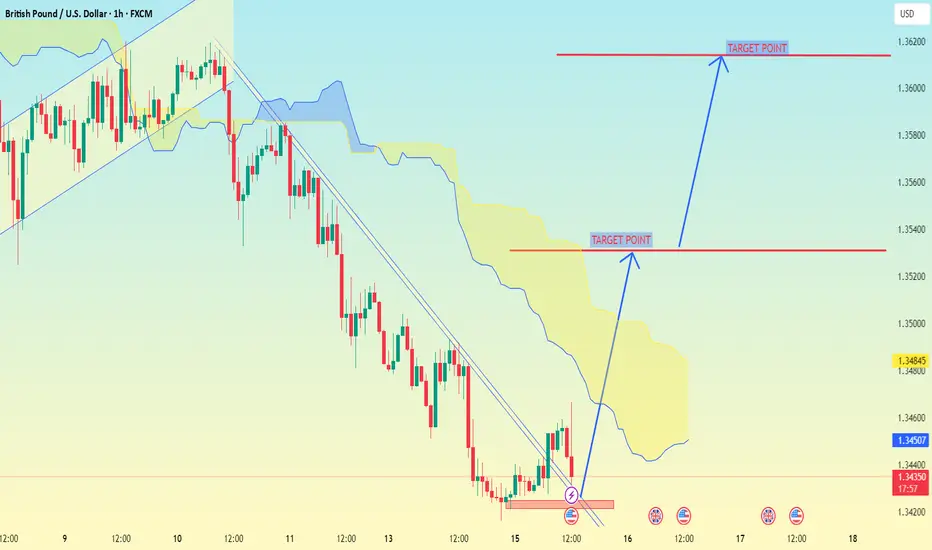
GBP/USD on the 1-hour timeframeGBP/USD on the 1-hour timeframe, here’s a breakdown of the target points indicated:
---
📍 Target Points (as marked on the chart):
1. First Target Point: Around 1.35200
2. Second Target Point: Around 1.36200
---
🧠 Analysis Notes (based on My setup):
Im used Ichimoku Cloud and a trendline breakout, which suggests a bullish reversal.
The price has broken out above a descending trendline and is possibly targeting the top of the cloud and further if momentum sustains.
The two target points represent:
First resistance level (likely top of the Ichimoku cloud).
Second resistance level (recent high before the downtrend began).
---
📌 Summary:
Immediate target: 1.35200
Next potential target: 1.36200
Let me know if you want stop-loss suggestions or a risk-reward analysis.
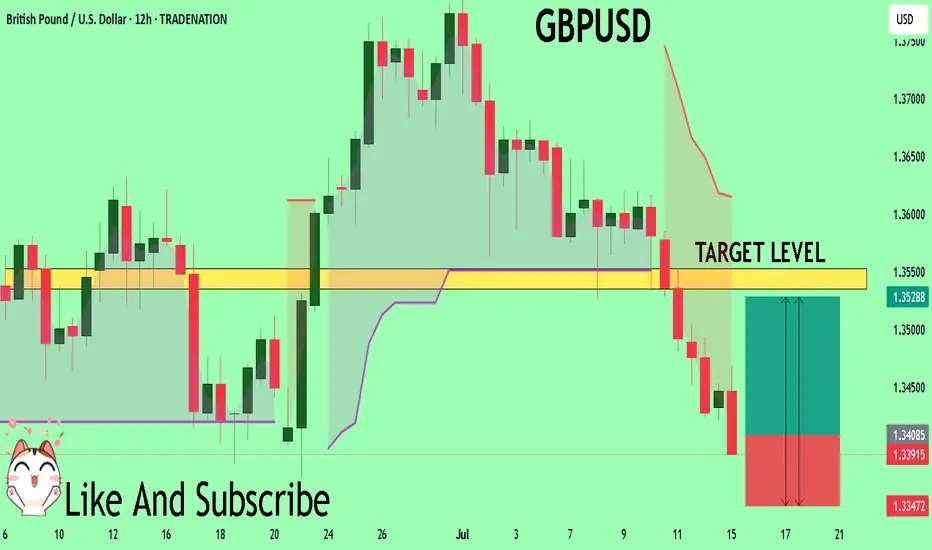
GBPUSD Pauses After Hitting First Target Amid USD-Driven TurbuleGBPUSD Pauses After Hitting First Target Amid USD-Driven Turbulence
Following our previous analysis, GBPUSD reached its first downside target and is currently experiencing a brief pause.
The U.S. has begun sending letters to multiple trading partners, stirring market uncertainty. This diplomatic disruption is strengthening the USD, giving it a tactical edge.
Should GBPUSD correct back toward 1.3600, there's potential for renewed downside movement in the coming days—particularly if market clarity improves.
🎯 Next key targets:
1.3435
1.3330
You may find more details in the chart!
Thank you and Good Luck!
PS: Please support with a like or comment if you find this analysis useful for your trading day
Disclosure: I am part of Trade Nation's Influencer program and receive a monthly fee for using their TradingView charts in my analysis.

LONG ON GBP/USDGU is currently in its pullback phase of its uptrend.
We have a nice sell side Liquidity sweep being completed at this moment.
Price should now tap into previous demand that broke a high to repeat history and rise again.
Very Nice Setup over 300 pips on the table to the previous high/supply zone.

Pound under pressure ahead of US, UK inflation reportsThe British pound has edged up higher on Tuesday. In the European session, GBP/USD is trading at 1.3453, up 0.21% on the day. Earlier, GBP/USD touched a low of 1.3416, its lowest level since June 23.
All eyes will be on the UK inflation report for June, which will be released on Wednesday. Headline CPI is expected to remain unchanged at 3.4% y/y, as is core CPI at 3.5%. Monthly, both the headline rates are expected to stay steady at 0.2%.
Has the BoE's battle to lower inflation stalled? The BoE was looking good in March, when inflation eased to 2.6%, but CPI has rebounded to 3.4%, well above the BoE's inflation target of 2%. Services data has been especially sticky, although it dropped to 4.7% in May, down from 5.4% a month earlier.
At 3.4%, inflation is stuck at its highest level since February 2024 and that will complicate plans at the BoE to renew interest rate cuts in order to kick-start the weak UK economy. The central bank has lowered rates twice this year and would like to continue trimming the current cash rate of 4.25%. The Bank meets next on Aug. 7 and Wednesday's inflation data could be a significant factor in the rate decision.
In the US, if June inflation data rises as is expected, fingers will quickly point to President Trump's tariffs as finally having an impact. Recent inflation reports have not shown a significant spike higher due to the tariffs, which were first imposed in April. However, the tariffs may have needed time to filter throughout the economy and could be felt for the first time in the June inflation reading.
The Fed meets next on July 30, with the markets pricing in a 95% chance of a hold, according to CME's FedWatch. For September, the odds of a rate cut stand at 59%. Today's inflation report could cause a shift in these numbers.
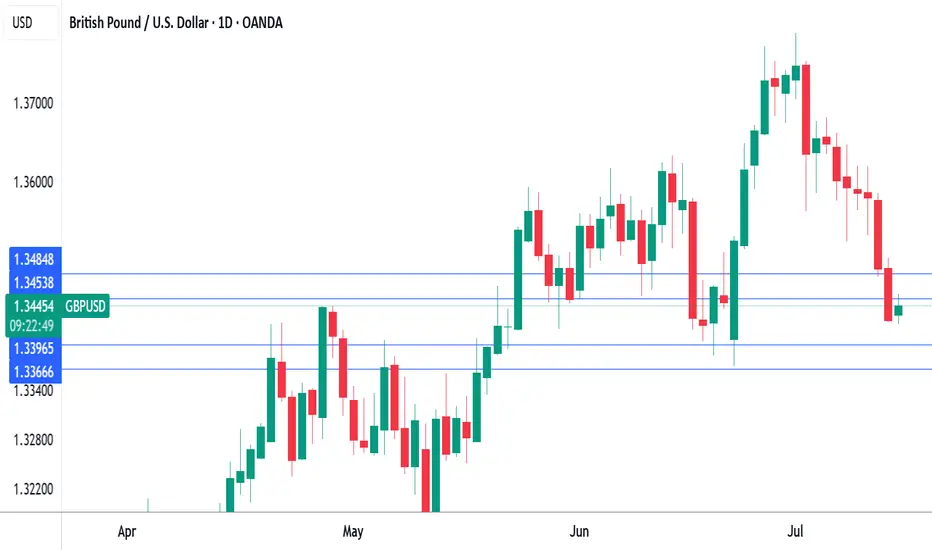
GBP/USD tested resistance at 1.3454 earlier. Above, there is resistance at 1.3484
1.3396 and 1.3366 are the next support levels
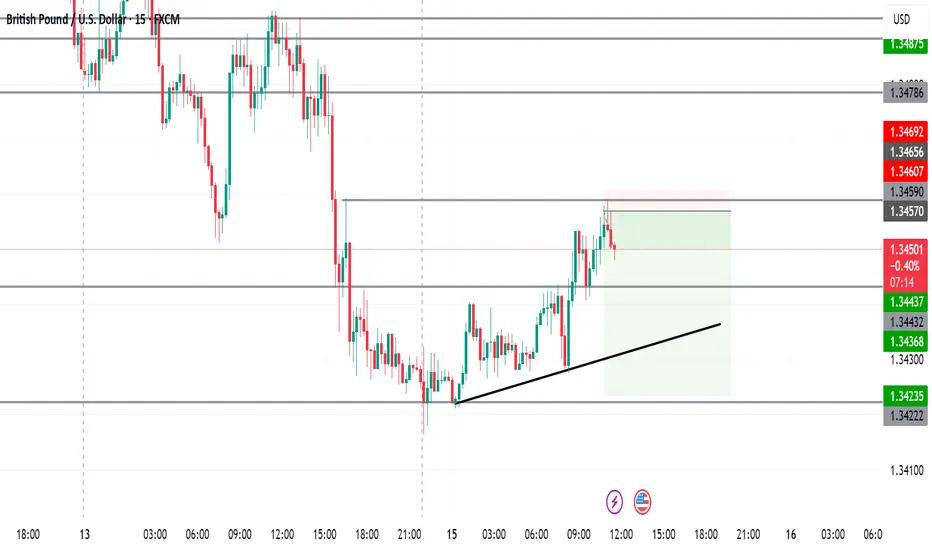
GBP/USD – Falling Wedge Breakout & Bullish Reversal Setup
🔹 1H Chart by PULSETRADESFX
Cable has broken out of a clean falling wedge pattern within a broader descending channel. Price respected key demand at 1.34060 – 1.34456, followed by a bullish breakout and retest of the wedge resistance.
With momentum now favoring the bulls, a recovery toward 1.35724 is on the cards as long as price sustains above 1.3445.
📌 Trade Plan:
Entry: 1.34507
Stop Loss: 1.34060 (Below demand zone)
Take Profit: 1.35724 (Channel midline resistance)
This setup highlights early reversal signals backed by structure, demand reaction, and wedge breakout.
---
✅ Technical Highlights:
Falling wedge breakout
Retest confirmation
Demand zone bounce
Risk-to-reward > 2:1
📅 July 15, 2025
📊 FOREX.com feed via TradingView
#GBPUSD #ForexSignals #ChartAnalysis #BullishSetup #PriceAction #TradingView #PULSETRADESFX

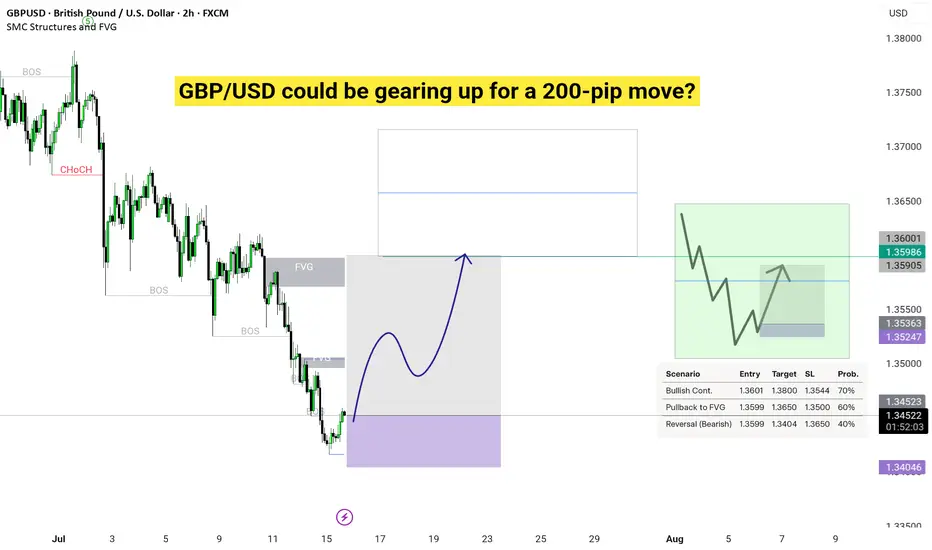
GBP/USD could be gearing up for a 200-pip move?Start: We jump in at 1.3601 if it’s going up or filling the gap, or 1.3599 if it might drop.
Goal: We aim for 1.3800 if it goes up, or 1.3404 if it goes down.
Safety Stop: Like a safety net, we stop if it drops to 1.3544 (up plan) or rises to 1.3650 (down plan).
Chance: These are best guesses based on the chart’s clues!

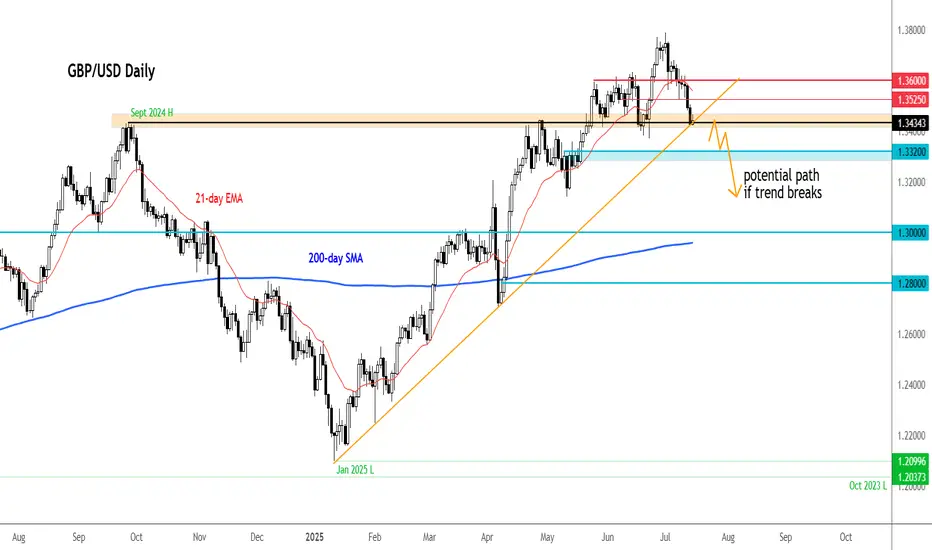
GBPUSD – Potential Short Term Volatility Ahead This WeekSo far, the month of July has not been a good one for GBPUSD, undermined by the precarious state of the UK Labour government’s finances, a deteriorating growth backdrop, and shifting interest rate differentials back in favour of the US dollar. This has seen a liquidation of stale long positioning and a steady decline from a 40 month high of 1.3789 registered on July 1st to a low of 1.3419 seen earlier today.
Looking forward, it could be another challenging week for FX traders to navigate. There are several economic data releases in the US and UK to digest, starting with the latest US CPI release later this afternoon (1330 BST), followed by the UK CPI update tomorrow (0700 BST) and then the UK Employment release on Thursday (0700 BST). All of these may have the potential to shift trader thinking on the next interest rate moves from the Federal Reserve (Fed), who are currently expected to keep rates unchanged when they next meet on July 31st, and the Bank of England (BoE), who are expected to cut by 25bps (0.25%) on August 7th.
When the outcome of these events is combined with the uncertain backdrop for global trade as President Trump’s new tariff deadline approaches on August 1st, alongside his ability to drop market moving social media headlines on a whim, this week has the potential to be a volatile one for GBPUSD.
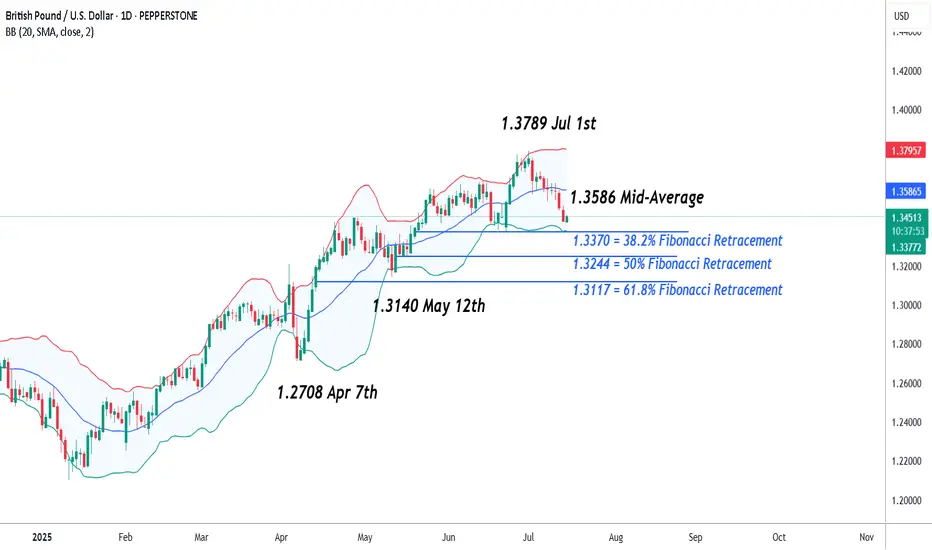
Technical Update: Watching Closing Defence of 38.2% Retracement Support
So far, July has seen GBPUSD enter a correction phase, as prices have sold off from the 1.3789 July 1st session high into Tuesday’s current 1.3419 low. As the chart below shows, this 2.7% decline, seen over little more than a 10 session period, is now approaching what some might class as a support focus at 1.3370.
This level is equal to the 38.2% Fibonacci retracement of the April 7th to July 1st phase of strength, and could be one that traders are now monitoring on a closing basis over coming sessions. While this level remains intact, some might argue there is still a positive uptrend pattern in place.
However, it is also important to consider what are the support and resistance levels on which to focus, if either 1.3370 is broken to the downside, or it continues to stem the current phase of weakness, even helps prompt fresh attempts at price strength.
Possible Support Levels:
As we’ve suggested, it could be the 1.3370 retracement level that represents the first support, with closing breaks below this level opening potential for a more extended phase of price declines.
While much will depend on future market sentiment and price trends, closes below 1.3370 may represent possibilities of further weakness towards 1.3244, which is equal to the lower 50% retracement level. This giving way, may in time result in tests of 1.3140, the May 12th session low.
Possible Resistance Levels:
While the 1.3370 retracement continues to hold current price declines, it might be successful in prompting fresh attempts at price strength.
With that in mind, if moves back higher do materialise, a resistance point to monitor on a closing basis could be 1.3586. This is the current level of the Bollinger mid-average and this giving way on a closing basis may in turn lead to further attempts at price strength to challenge 1.3789, the July 1st high again.
The material provided here has not been prepared accordance with legal requirements designed to promote the independence of investment research and as such is considered to be a marketing communication. Whilst it is not subject to any prohibition on dealing ahead of the dissemination of investment research, we will not seek to take any advantage before providing it to our clients.
Pepperstone doesn’t represent that the material provided here is accurate, current or complete, and therefore shouldn’t be relied upon as such. The information, whether from a third party or not, isn’t to be considered as a recommendation; or an offer to buy or sell; or the solicitation of an offer to buy or sell any security, financial product or instrument; or to participate in any particular trading strategy. It does not take into account readers’ financial situation or investment objectives. We advise any readers of this content to seek their own advice. Without the approval of Pepperstone, reproduction or redistribution of this information isn’t permitted.
DeGRAM | GBPUSD broke down the channel📊 Technical Analysis
● Cable’s bounce stalled at the channel base (≈1.3500); price is now carving a bear flag beneath that rail and the prior wedge-break line, signalling failure to regain trend support.
● A 4 h close under 1.3415 confirms channel loss, opening the mid-May pivot 1.3271; flag top at 1.3470 caps risk while lower-high sequence stays intact.
💡 Fundamental Analysis
● Friday’s firm US consumer-sentiment and Fed Gov. Waller’s “no urgency to cut” comments nudged 2-yr yields back toward 4.80 %, reviving dollar demand.
● UK June payrolls contracted for a third month and wage growth cooled, boosting August BoE-cut odds and weighing on sterling.
✨ Summary
Sell 1.3460-1.3490; sustained trade below 1.3415 targets 1.3271. Short view void on a 4 h close above 1.3470.
-------------------
Share your opinion in the comments and support the idea with a like. Thanks for your support!

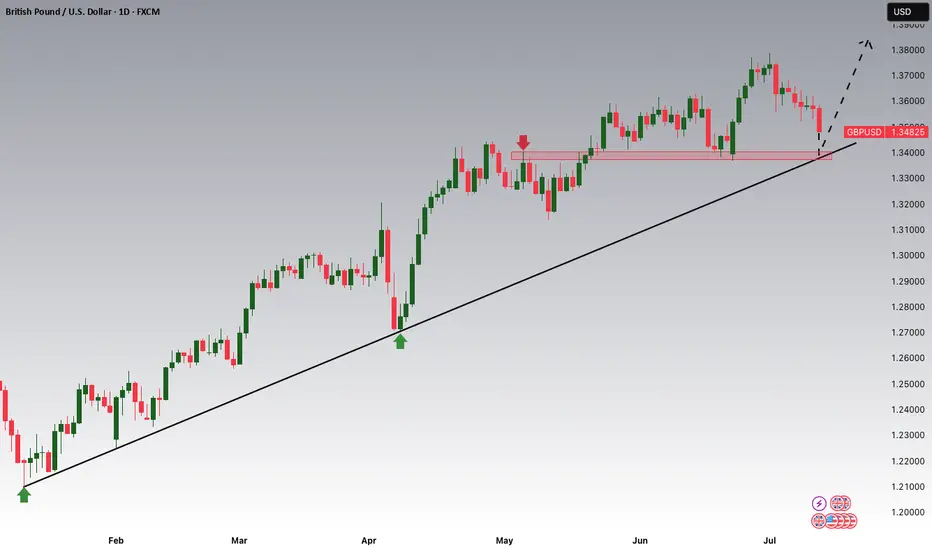
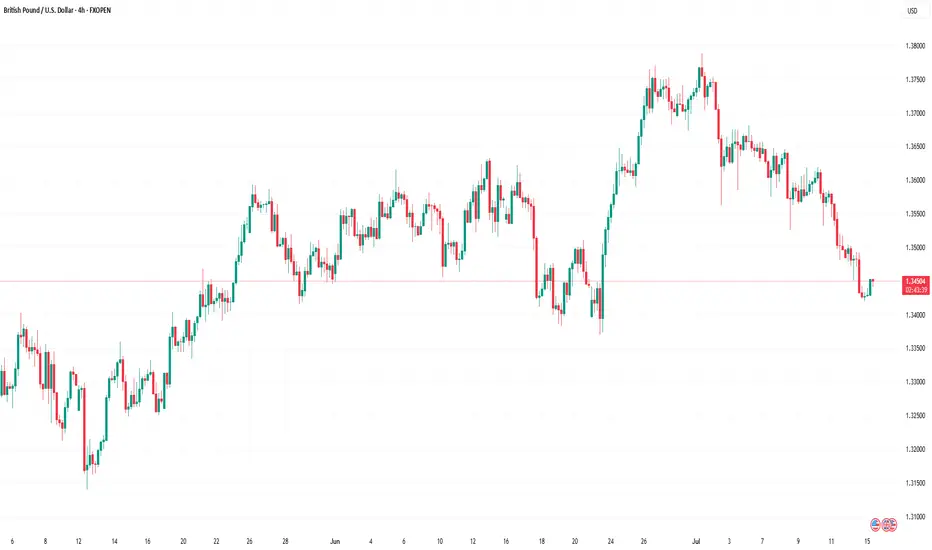
GBP/USD Rate Falls to Key Support LevelGBP/USD Rate Falls to Key Support Level
As of today, the GBP/USD chart indicates that the British pound has declined by more than 2% against the US dollar since the beginning of July. Notably, the pace of the decline accelerated on Friday and continued into Monday.
According to Reuters, the pound is under pressure due to market concerns over a potential economic slowdown amid an escalating trade war. Last week’s data confirmed a contraction in UK GDP, which could have far-reaching implications. In this context, criticism of the UK government’s failure to reduce public spending is becoming more pronounced.
What’s next for GBP/USD?
Technical Analysis of the GBP/USD Chart
From a bullish perspective, it is worth noting that the pair has fallen to a significant support level around 1.3425. This level previously acted as resistance in the spring, but after a breakout, it has now turned into support (as indicated by arrows on the chart). Additionally, the RSI indicator shows strong oversold conditions, which suggests a potential short-term rebound.
From a bearish standpoint, it is concerning that the sharp rally from point A to point B has been entirely erased by the July decline. This indicates that despite significant gains by the bulls, they failed to hold them—casting doubt on GBP/USD's ability to sustain growth in the medium term.
Ongoing pressure may lead to an attempt by bears to push GBP/USD below the June low at point A. However, it is also possible that bearish momentum will weaken thereafter, potentially leading to a recovery within the developing downward channel (marked in red).
This article represents the opinion of the Companies operating under the FXOpen brand only. It is not to be construed as an offer, solicitation, or recommendation with respect to products and services provided by the Companies operating under the FXOpen brand, nor is it to be considered financial advice.
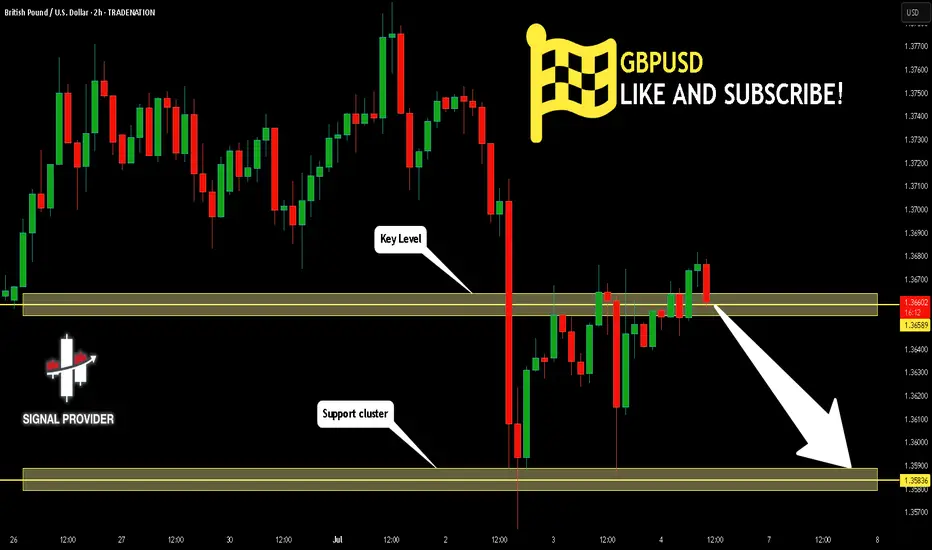
GBPUSD Will Go Lower! Sell!
Take a look at our analysis for GBPUSD.
Time Frame: 2h
Current Trend: Bearish
Sentiment: Overbought (based on 7-period RSI)
Forecast: Bearish
The market is testing a major horizontal structure 1.365.
Taking into consideration the structure & trend analysis, I believe that the market will reach 1.358 level soon.
P.S
Overbought describes a period of time where there has been a significant and consistent upward move in price over a period of time without much pullback.
Disclosure: I am part of Trade Nation's Influencer program and receive a monthly fee for using their TradingView charts in my analysis.
Like and subscribe and comment my ideas if you enjoy them!