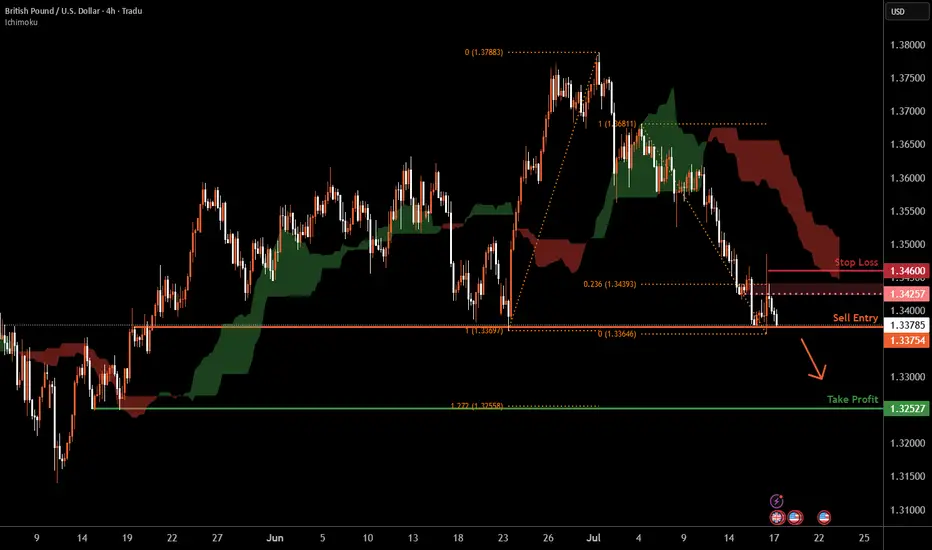
Cable H4 | Potential bearish breakout?Cable (GBP/USD) is falling toward a potential breakout level, where the bearish momentum could cause the price to drop lower from this level.
Sell entry is at 1.3375 which is a potential breakout level.
Stop loss is at 1.3460 which is a level that sits above the 23.6% Fibonacci retracement and an overlap resistance.
Take profit is at 1.3252 which is a multi-swing-low support that aligns with the 127.2% Fibonacci extension.
High Risk Investment Warning
Trading Forex/CFDs on margin carries a high level of risk and may not be suitable for all investors. Leverage can work against you.
Stratos Markets Limited (tradu.com ):
CFDs are complex instruments and come with a high risk of losing money rapidly due to leverage. 66% of retail investor accounts lose money when trading CFDs with this provider. You should consider whether you understand how CFDs work and whether you can afford to take the high risk of losing your money.
Stratos Europe Ltd (tradu.com ):
CFDs are complex instruments and come with a high risk of losing money rapidly due to leverage. 66% of retail investor accounts lose money when trading CFDs with this provider. You should consider whether you understand how CFDs work and whether you can afford to take the high risk of losing your money.
Stratos Global LLC (tradu.com ):
Losses can exceed deposits.
Please be advised that the information presented on TradingView is provided to Tradu (‘Company’, ‘we’) by a third-party provider (‘TFA Global Pte Ltd’). Please be reminded that you are solely responsible for the trading decisions on your account. There is a very high degree of risk involved in trading. Any information and/or content is intended entirely for research, educational and informational purposes only and does not constitute investment or consultation advice or investment strategy. The information is not tailored to the investment needs of any specific person and therefore does not involve a consideration of any of the investment objectives, financial situation or needs of any viewer that may receive it. Kindly also note that past performance is not a reliable indicator of future results. Actual results may differ materially from those anticipated in forward-looking or past performance statements. We assume no liability as to the accuracy or completeness of any of the information and/or content provided herein and the Company cannot be held responsible for any omission, mistake nor for any loss or damage including without limitation to any loss of profit which may arise from reliance on any information supplied by TFA Global Pte Ltd.
The speaker(s) is neither an employee, agent nor representative of Tradu and is therefore acting independently. The opinions given are their own, constitute general market commentary, and do not constitute the opinion or advice of Tradu or any form of personal or investment advice. Tradu neither endorses nor guarantees offerings of third-party speakers, nor is Tradu responsible for the content, veracity or opinions of third-party speakers, presenters or participants.
GBPUSD trade ideas
GBP/USD Daily Outlook: At a Pivotal JunctureLong-Term Trend Dynamics
The Pound-Dollar pair has largely maintained an upward trajectory since April, guided by a robust long-term rising trendline. This enduring bullish structure has consistently provided dynamic support, illustrating a sustained period of higher lows and gradual appreciation over several months.
The Immediate "Deciding Level"
GBP/USD currently finds itself at a critical confluence point, labeled the "Deciding Level." This horizontal zone of significance is being tested precisely where it intersects with the established long-term rising trendline, making the present price action absolutely pivotal for determining the pair's short-term direction.
Potential Downside Acceleration
A decisive break and sustained trading below this "Deciding Level" would signal a significant shift in market sentiment, opening the door for "More immediate Downside." Such a move would likely accelerate the existing bearish momentum (indicated by the steep red downtrend line), with the "1st Support Level" becoming the primary downside target where strong buying interest might re-emerge.
Key Resistance Zones to Watch
Should the "Deciding Level" successfully hold as support, the pair could attempt to reverse its recent decline. Any potential rebound, however, would first encounter resistance from the short-term red downtrend line, followed by the formidable "1st Resistance Level," an overhead supply zone that has historically capped bullish advances.
Disclaimer:
The information provided in this chart is for educational and informational purposes only and should not be considered as investment advice. Trading and investing involve substantial risk and are not suitable for every investor. You should carefully consider your financial situation and consult with a financial advisor before making any investment decisions. The creator of this chart does not guarantee any specific outcome or profit and is not responsible for any losses incurred as a result of using this information. Past performance is not indicative of future results. Use this information at your own risk. This chart has been created for my own improvement in Trading and Investment Analysis. Please do your own analysis before any investments.

GBPUSD ANALYSIS After seeing the market react to key are of support yesterday and a retrace of a 100% on the Fibonacci seller are still in control of the market a break below support and retest for further sells could occur

GBP USD LONG RESULT Price broken down the support of the falling bearish wedge it was in and then formed a minor falling wedge pattern indicating signs for upward movement, but I knew price would still move to the demand zone before further upsides, which is why I setup the entry at the order block to the Rising channel Support (Schematics) and price moved just as Predicted to Profit.
_THE_KLASSIC_TRADER_.🔥🤲🙏

GBPUSD(20250717)Today's AnalysisMarket news:
The annual rate of PPI in the United States in June was 2.3%, lower than the expected 2.5%, the lowest since September 2024, and the previous value was revised up from 2.6% to 2.7%. Federal Reserve Beige Book: The economic outlook is neutral to slightly pessimistic. Manufacturing activity declined slightly, and corporate recruitment remained cautious.
Technical analysis:
Today's buying and selling boundaries:
1.3423
Support and resistance levels:
1.3544
1.3499
1.3470
1.3377
1.3348
1.3303
Trading strategy:
If it breaks through 1.3423, consider buying, and the first target price is 1.3470
If it breaks through 1.3377, consider selling, and the first target price is 1.3348

GBPUSD InsightWelcome to all our subscribers.
Please feel free to share your personal thoughts in the comments.
Don't forget to like and subscribe!
Key Points
- According to CBS and other U.S. media outlets, former President Trump asked Republican lawmakers during a closed-door meeting whether they supported removing Federal Reserve Chair Jerome Powell. It was reported that many lawmakers showed support for the idea. However, in a meeting with the Prime Minister of Bahrain, Trump stated that unless Powell is involved in a scandal related to renovations of the Federal Reserve building, the likelihood of his dismissal is very low.
- President Trump is actively lobbying lawmakers to pass three stalled cryptocurrency bills in the House of Representatives. Optimism about the bills' passage has resurfaced. In particular, the potential strategic use of stablecoins to strengthen the dominance of the U.S. dollar and boost demand for U.S. Treasuries has brought renewed attention to these legislative efforts.
- The U.K.’s Consumer Price Index (CPI) for June came in at 3.6%, exceeding the market expectation of 3.4%. As a result, the possibility of a Bank of England rate cut in July has significantly diminished.
Key Economic Schedule This Week
+ July 17: Eurozone June Consumer Price Index (CPI)
GBPUSD Chart Analysis
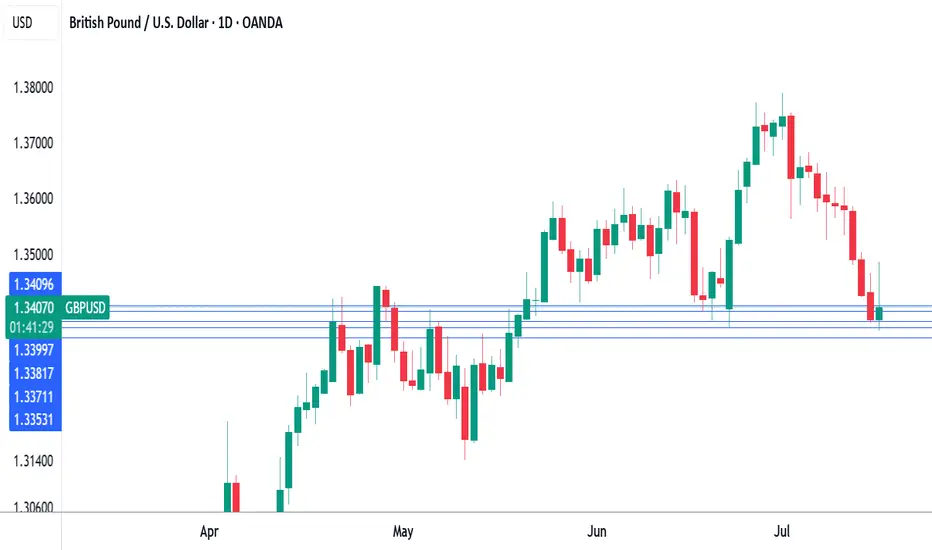
The GBPUSD pair failed to break above the 1.38000 level and fell through the trendline after facing resistance in that zone. Currently, it is testing support near the 1.34000 level. If the pair successfully rebounds from this area, we could expect another potential rally toward the 1.40000 level. However, if the support is broken, a further decline toward the 1.31500–1.32000 range is likely.

GBPUSD - Is it Ready? Looking at GBPUSD
We have had a Market shift to the upside from a HTF Point of Interest. I am now waiting for price to come back into a 15min demand area and hopefully price will take off to the upside from here.
We have also swept liquidity before a drastic move to the upside.
Lets see how this one plays out
GBPUSD TRADE We had a full pullback to our Fibonacci level on GBPUSD for a continuation to the upside.
We await to see how the market does it's thing.

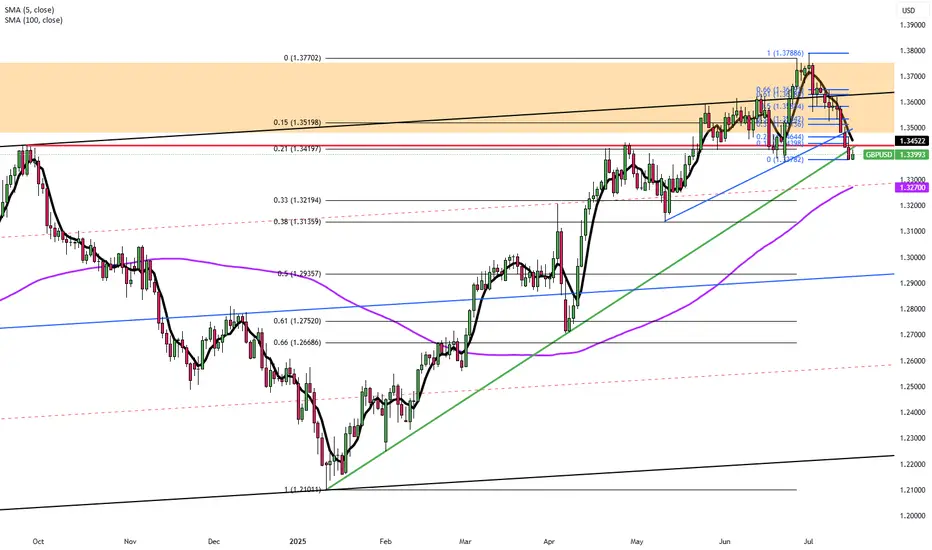
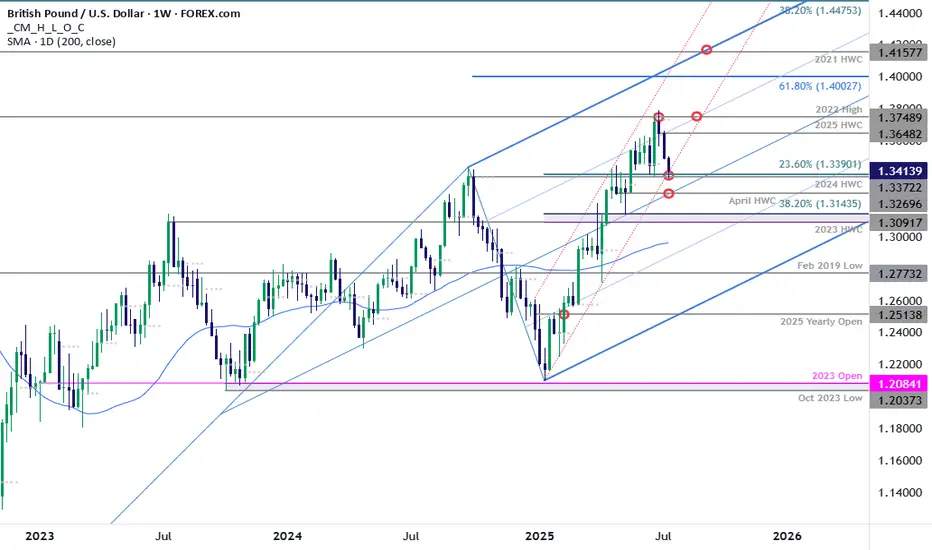
GBP/USD Plunges to Make-or-Break SupportSterling is poised to mark a third consecutive weekly decline after turning from resistance at multi-year highs. The decline takes price into critical support at the yearly trendline- this is a make-or-break level for the bulls.
GBP/USD is testing confluent support today at 1.3372/90- a region defined by the 2024 high-week close (HWC) and the 23.6% retracement of the yearly range. Looking for a reaction off this mark with a weekly close below the April HWC / median-line at 1.3270 ultimately needed to suggest a more significant high is in place / invalidate the yearly uptrend. Subsequent support rests with the 2023 HWC / 38.2% retracement at 1.3091-1.3143 and the 52-week moving average, currently near ~1.2980.
Weekly resistance now eyed at the yearly high-week reversal close at 1.3648 with a breach / close above the 2022 high at 1.3749 still needed to mark resumption of the broader Sterling up trend. Subsequent resistance objectives eyed at the 61.8% extension of the 2022 advance at 1.4003 and the 2021 HWC at 1.4158.
Bottom line: Sterling is attempting to break below the yearly uptrend and the focus is on the weekly close with respect to 1.3372/90- risk for price inflection here. From a trading standpoint, a good zone to reduce portions of short-exposure / lower protective stops- rallies should be limited to 1.3648 IF price is heading lower on this stretch with a close below 1.3270 needed to suggest a reversal is underway.
-MB
UK inflation heats up, Pound shrugsThe British pound has stabilized on Wednesday and is trading at 1.3389 in the European session, up 0.07% on the day. This follows a four-day losing streak in which GBP/USD dropped 1.5%. On Tuesday, the pound fell as low as 1.3378, its lowest level since June 23.
Today's UK inflation report brought news that the Bank of England would have preferred not to hear. UK inflation in June jumped to 3.6% y/y, up from 3.4% in May and above the market estimate of 3.4%. This was the highest level since January 2024 and is a stark reminder that inflation is far from being beaten. The main drivers of inflation were higher food and transport prices. Services inflation, which has been persistently high, remained steady at 4.7%. Monthly, CPI ticked up to 0.3% from 0.2%, above the market estimate of 0.2%.
It was a similar story for core CPI, which rose to 3.7% y/y from 3.5% in May, above the market estimate of 3.5%. Monthly, core CPI climbed 0.4%, above 0.2% which was also the market estimate.
The hot inflation report will make it more difficult for the BoE to lower interest rates and the money markets have responded by paring expectations of further rate cuts. Still, expectations are that the BoE will cut rates at the August 7 meeting, with a probability of around 80%, despite today’s higher-than-expected inflation numbers.
The UK releases wage growth on Thursday, which is the final tier-1 event prior to the August meeting. Wage growth has been trending lower in recent months and if that continues in the May reading, that could cement an August rate cut.
GBP/USD CONFIRM ANALYSISGBP/USD picks up pace and advances to daily peaks in the 1.3470 zone on the back of the increasing downward pressure on the US Dollar after President Trump asked politicians if he can fire Fed Chief Powell.

VMS STRATEGYI hate the days when I get beat up… but I love the days when the wins come in.
What I’ve learned over time is that you need a system you can trust through both.
Here’s a basic overview of the VMS strategy I created through countless good and bad days. It’s a rule-based swing trading strategy I use on the 4-hour chart, and after studying thousands of patterns, I’ve found these setups repeat themselves consistently — across 22 Forex pairs.
VMS Strategy (Created by Darl Wright)
PULLBACK SETUPS:
Must have made a previous high/low before the pullback
Pullback must enter a strong Support/Resistance zone
Must produce an engulfing candle in trend direction
Price action must be near the 50 EMA
Volume trigger must be:
– Stronger than previous opposite candle or
– Two same-color volume candles in a row
Momentum must be above/below 0 and hooking in trend direction
If the setup is valid, drop to the 1H chart to mark SL and TP
SL: Just outside the swing high/low ± ATR (to avoid “equity grabs”)
TP: Previous price level (subjective), but always 2:1 R/R minimum
Feel free to backtest the VMS and make it your own.
I’ll keep posting live trades — wins and losses — using only this system.
If this helps even one person gain clarity or consistency, mission accomplished.
Wishing all of you success — whatever your strategy may be.
— Darl Wright

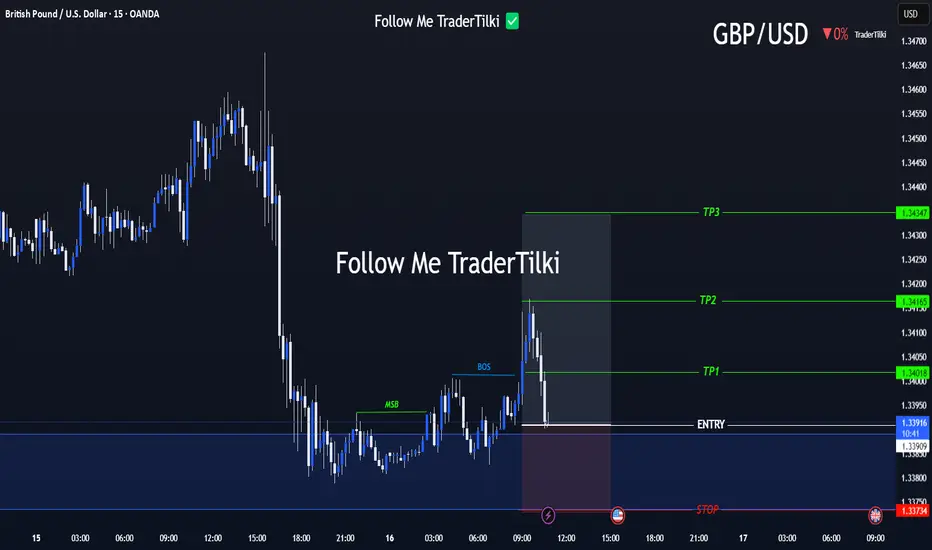
Strategic Entry, Clear Targets: The GBPUSD Game Plan Is Set📢 Hello Guys,
I've prepared a fresh GBPUSD signal for you:
🟢 Entry Level: 1.33918
🔴 Stop Loss: 1.33734
🎯 TP1: 1.34018
🎯 TP2: 1.34165
🎯 TP3: 1.34347
📈 Risk/Reward Ratio: 2,40
------
Your likes and support are what keep me motivated to share these analyses consistently.
Huge thanks to everyone who shows love and appreciation! 🙏
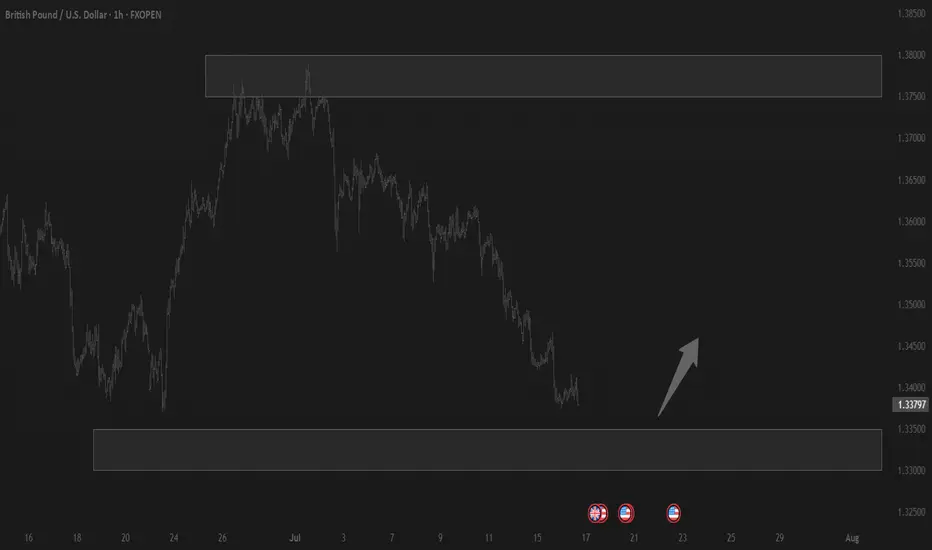
GBPUSD RE-ACCUMULATION TYPESee the arrow on charts, I recommend on shorts at this level.
This is just an redistribute above again. but for now, I only share on short idea.
I will update once idea works.
This is not a financial advice.
Trade wisely.
follow for more.
ciaooo.

GBPUSD BUY IDEAI am anticiting for a stronger bullish move after a break in the trendline+c change in market structure.
On the financial standpoint,Dxy might start dipping as a result of the fed decision to cut rate plus Trump rift with Fed chair,Jerome Powell.
This is not a financial advise

GBPUSD – Levels, Adjustments, and Scenario PlanningAs mentioned in our pinned analysis, we had two levels on GBPUSD —
✅ Both of them were broken.
📉 After the break of the first level, we shorted the pullback and took a great profit.
📍 Now after the second level has also broken, I’ve adjusted the level slightly —
There’s a chance price retraces to 1.35774 before continuing its drop.
🟢 Below, there’s a solid buy zone.
🔁 My Updated Scenarios:
✅ If price pulls back to the short level before hitting the buy zone → I’ll take the short.
⚠️ But if price touches the buy zone first, then any short afterward will just be partial or used for pyramiding — not a major trade.
Let’s stay patient and let the market tell us what to do.
📌 All previous scenarios are still valid.

Scalp Buy!Hello all. after failed my last position on GBPUSD I think an LBR Move will happen right here and it is time to scalp it. be happy and have a great day(wink)

GBP USD shortIf the trend is bearish, who am I to go against it?
Fun fact: the moment I'm sure about something is usually the moment I make a mistake.
By the way, I’m finding this setup interesting. These analyses aren’t based on a well-defined strategy — they’re experimental. Years of failing and testing have only taught me 87 ways that don’t work, not one that definitely does.
Lately, I’m trying something I call the "bombard strategy." If you feel strongly about a trade, you just go for it. Sometimes you might even have both short and long positions open on the same pair at the same time. The only real trick is to make sure your take-profit (TP) is at least twice as big as your stop-loss (SL).
News events are so unpredictable. Most of the time, you won’t even reach your TP — you’ll have to manually close the trade early, or you risk losing your gains. It’s like a mathematical game.
In this chaotic market, to master it, you have to master chaos.
How? I don’t know yet. I’m just going with my gut feeling… backed by five years of experience watching the charts.
Please note: This is for educational purposes only and not a trading signal. These ideas are shared purely for back testing and to exchange views. The goal is to inspire ideas and encourage discussion. If you notice anything wrong, feel free to share your thoughts. In the end, to learn is to share !


Trading balanceTrading balance The price of the asset has rebounded from the balance zone. With the prospect of growth into the resistance zone.
GBPUSD Under PressureGBP/USD decline is driven by dovish UK central bank tone, disappointing UK data, a firming US Dollar, and global risk aversion. The pair is range‑bound between 1.3360–1.3445, with the next significant downside target at 1.3BoE hints at rate cuts amid weak UK GDP, fueling Pound weakness. possibly 1.3000 if bearish momentum sustains.
Stronger USD + global risk-off adds pressure.
Support: 1.3360 | Bias: Bearish unless UK data surprises.
#GBPUSD

16.07.2025 #GBPUSDBUY 1.34000 | STOP 1.33600 | TAKE 1.34500 | ⏳ Close the trade in profit or move Stop Loss to breakeven after the price passes +25 pips.

Pound Pressured by BoE Dovish ToneGBP/USD held around 1.3430–1.3435, just above a three-week low, with traders awaiting US CPI data for further clues on dollar direction. UK economic data remains soft, and BoE Governor Bailey signaled that deeper rate cuts may be on the table if the labor market weakens further. He emphasized growing economic slack, which could help bring inflation down. Meanwhile, a slight dollar pullback provided limited relief to the pair.
Resistance is at 1.3500, while support holds at 1.3380.