GBPUSD trade ideas
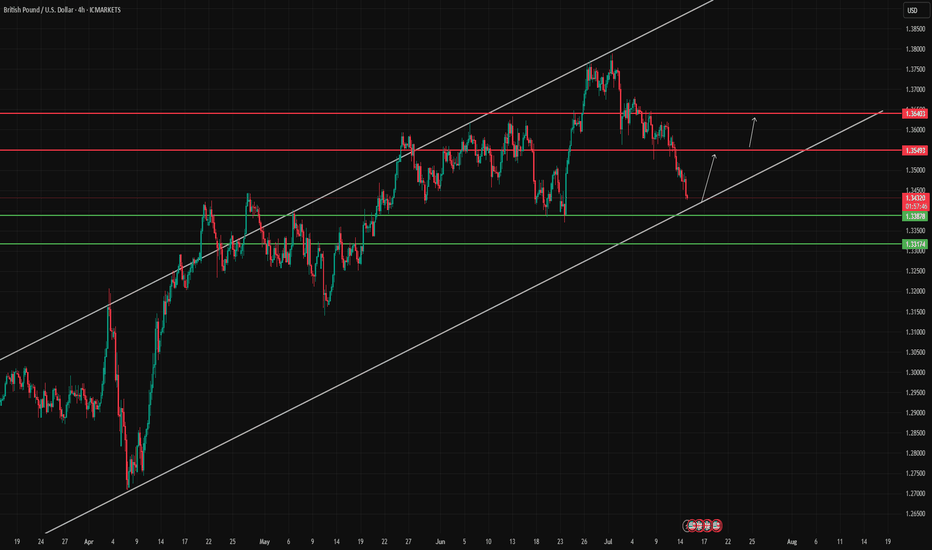
Falling towards major support?The Cable (GBP/USD) is falling towards the pivot which has been identified as an overlap support that lines up with the 61.8% Fibonacci retracement and could reverse to the 1st resistance.
Pivot: 1.3400
1st Support: 1.3319
1st Resistance: 1.3594
Risk Warning:
Trading Forex and CFDs carries a high level of risk to your capital and you should only trade with money you can afford to lose. Trading Forex and CFDs may not be suitable for all investors, so please ensure that you fully understand the risks involved and seek independent advice if necessary.
Disclaimer:
The above opinions given constitute general market commentary, and do not constitute the opinion or advice of IC Markets or any form of personal or investment advice.
Any opinions, news, research, analyses, prices, other information, or links to third-party sites contained on this website are provided on an "as-is" basis, are intended only to be informative, is not an advice nor a recommendation, nor research, or a record of our trading prices, or an offer of, or solicitation for a transaction in any financial instrument and thus should not be treated as such. The information provided does not involve any specific investment objectives, financial situation and needs of any specific person who may receive it. Please be aware, that past performance is not a reliable indicator of future performance and/or results. Past Performance or Forward-looking scenarios based upon the reasonable beliefs of the third-party provider are not a guarantee of future performance. Actual results may differ materially from those anticipated in forward-looking or past performance statements. IC Markets makes no representation or warranty and assumes no liability as to the accuracy or completeness of the information provided, nor any loss arising from any investment based on a recommendation, forecast or any information supplied by any third-party.
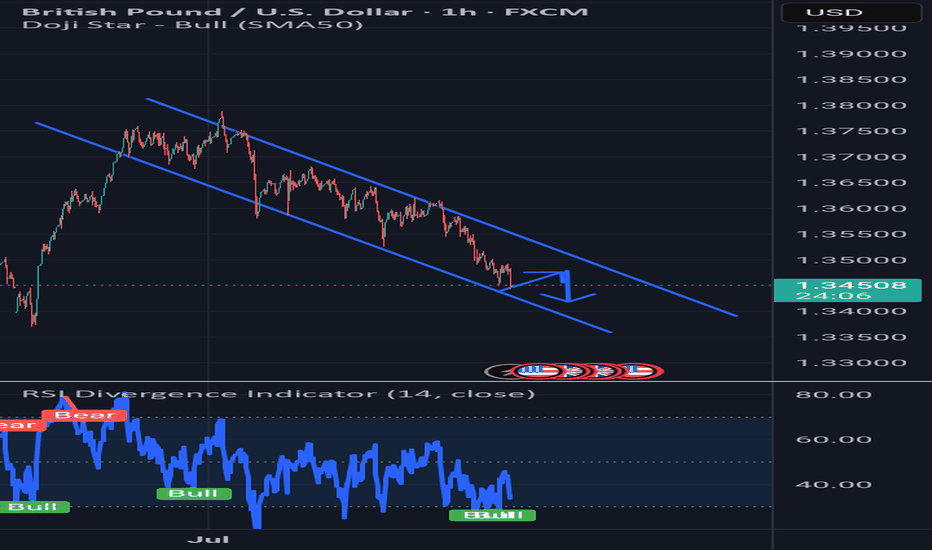
SHORT and SHORT in GBPUSDHello Fellow traders,
I am sharing my short position in GBP/USD today.
I have decided to go short on GBP/USD, following the announcement of steep U.S. tariffs. Fundamentally, this aligns with my outlook: the USD is acting as a safe haven, while the GBP remains more risk-sensitive amidst global uncertainty.
From a technical standpoint—though I keep things simple—my analysis supports the bearish sentiment, and I have entered a short position accordingly.
Good luck, everyone, and trade safe!
What Happens the Day Jerome Powell Is Fired or Quits?A sudden exit by Fed Chair Jerome Powell would create both a political and monetary shock.
While the Chair is technically protected from arbitrary removal. Recent reports confirm that President Trump and his allies are scrutinising the Fed’s $2.5 billion renovation project—potentially laying the groundwork for a “for cause” dismissal.
A surprise departure would undermine confidence in the Fed’s independence. The U.S. dollar could fall sharply across major pairs.
USD/JPY could fall toward ¥145, with safe-haven demand favouring the yen. However, the reaction may be less severe than in pairs like Swiss franc which we have noted in the past is the potentially preferred safe haven. A panic selloff could extend to 142.20—a prior consolidation floor.
GBP/USD could surge as traders anticipate a more dovish Fed stance under the new Trump-stooge Fed Chair. From a technical perspective, GBP/USD is maybe already oversold and potentially poised for a potential rebound anyway—Powell’s resignation or firing could potentially exacerbate this. The first level to watch being a return to 1.3700, assuming the likely expectation of Fed rate cuts rise.
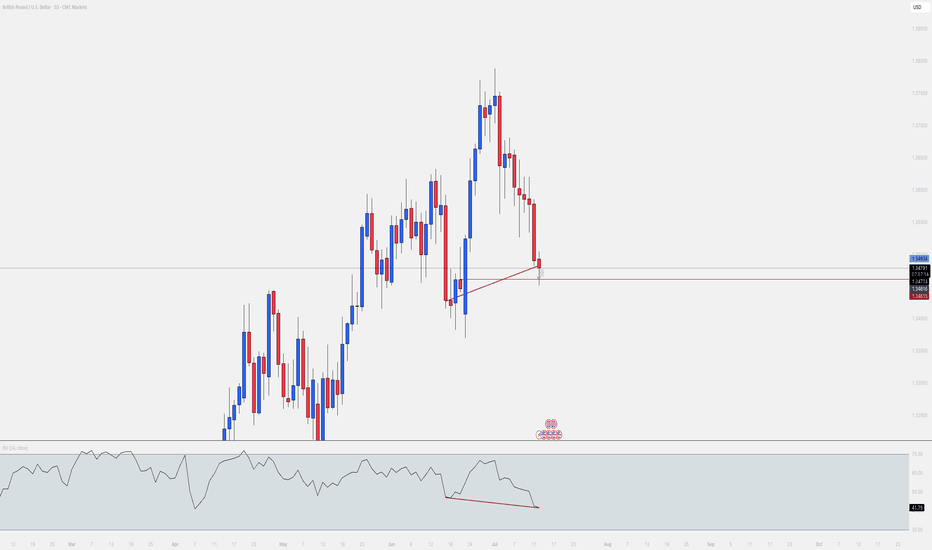
GBPUSD Swing Outlook 14-07-2025Hello Traders!
It's been a while since my last post on the market.
Here's a breakdown of GBPUSD.
Daily Timeframe:
1. We have been in a bullish trend, price forming HH and respecting HL. (impulsive phase)
2. By dragging our Fibonacci level from swing low to swing high, we can clearly see potential discounted levels where we can look for buying opportunities again.
3.(Corrective phase) Current price action indicates to us that price has a potential of closing below our last HL, which will indicate MMS/CHOCH and a start of a bearish trend.
4. What we know is that in a bearish trend price respects LH and breaks LL, and we should be looking for selling opportunities.
5. By using the H4 timeframe we can look for internal swing points where we can drag our Fibonacci to identify best-selling opportunities at a premium level. (This will be counter trend trading, and we can capitalize on it until we are in discounted levels again)
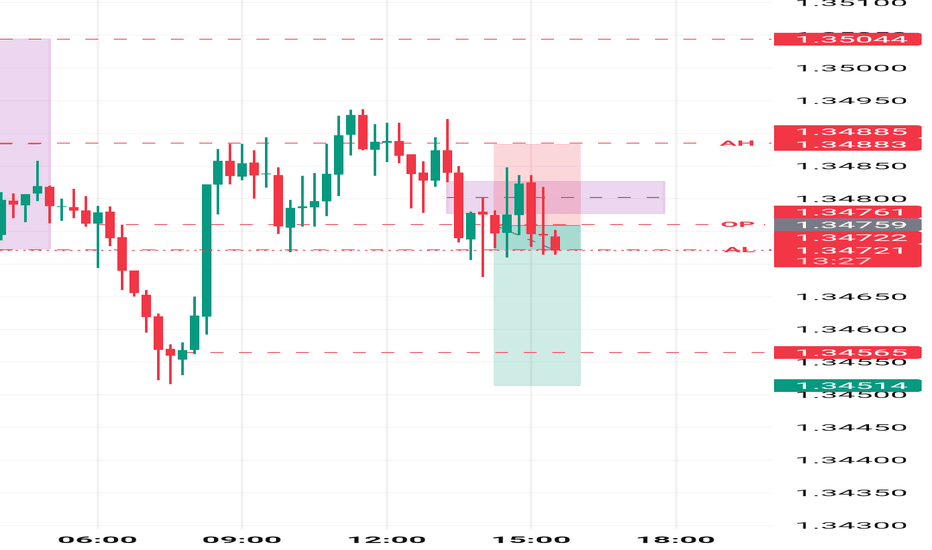
GBP/USD Breakdown Using BullTrading Easy Tops & BottomsIn this setup, GBP/USD broke down through a dynamic red zone printed by the BullTrading Easy Tops & Bottoms indicator (💥 Free for the entire community!).
This zone had previously acted as a potential resistance level, but price showed no respect on approach — instead, we saw strong acceleration through the level, confirming momentum and a liquidity imbalance.
🔍 Why This Mattered:
This indicator doesn’t predict — it highlights true dynamic support and resistance zones based on stop clustering and price behavior.
When price doesn’t respect a zone and breaks through it with strength, that alone tells a story:
When a support zone is broken, price will often rebalance ABOVE the same number of points/pips as the size of the zone itself — that’s your opportunity.
Smart money may be engineering a continuation move
The reaction after the zone is broken is key
In this case, the cleanest play was to use a SELL LIMIT above the broken support zone, and the market gave us clear bearish confirmation
📌 Educational Insight:
The edge isn’t just in the zones — it’s in how price reacts around them.
When a zone fails, it becomes a trigger point for directional bias.
Here, it offered a clean bearish confirmation to short the retest, with a precise stop-loss placed just above the broken structure.
✅ Lot sizing was adjusted based on the stop distance, usually 1:2 RR is optimal
Tighter SL = higher lot size
Wider SL = lower lot size
That keeps risk consistent and manageable.
GBPUSD(20250714)Today's AnalysisMarket news:
① Fed's Goolsbee: The latest tariff threat may delay rate cuts. ② The Fed responded to the White House's "accusations": The increase in building renovation costs partly reflects unforeseen construction conditions. ③ "Fed's megaphone": The dispute over building renovations has challenged the Fed's independence again, and it is expected that no rate cuts will be made this month. ④ Hassett: Whether Trump fires Powell or not, the Fed's answer to the headquarters renovation is the key.
Technical analysis:
Today's buying and selling boundaries:
1.3518
Support and resistance levels:
1.3621
1.3583
1.3558
1.3479
1.3454
1.3415
Trading strategy:
If the price breaks through 1.3518, consider buying in, with the first target price at 1.3558
If the price breaks through 1.3479, consider selling in, with the first target price at 1.3454
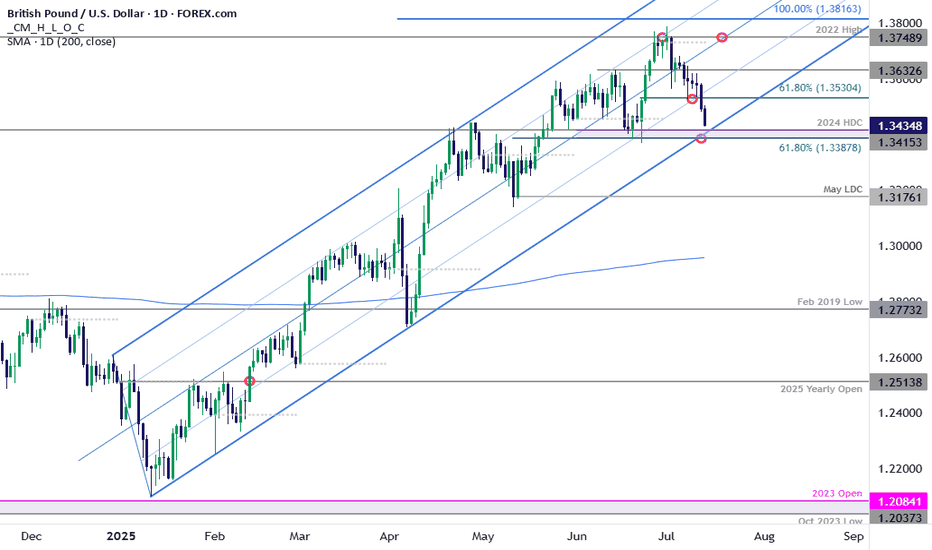
GBP/USD Bears Charge Yearly Trend Support- US / UK CPI on TapSterling broke below confluent support last week at the 61.8% retracement at of the June rally at 1.3530. The decline is now within striking distance of yearly trend support at 1.3388-1.3415- a region define by the 61.8% retracement of the May rally, the June close lows, and the 2024 high-day close. A good zone to reduce portions of short-exposure / lower protective stops IF reached. A break / close below would be needed to suggest a more significant high was registered this month / a larger reversal is underway.
Initial resistance now back at 1.3530 with a close above the 25% parallel needed to threaten resumption of the broader uptrend. Keep in mind we get the release of US / UK inflation data this week- stay nimble into the releases and watch the weekly close for guidance here.
-MB
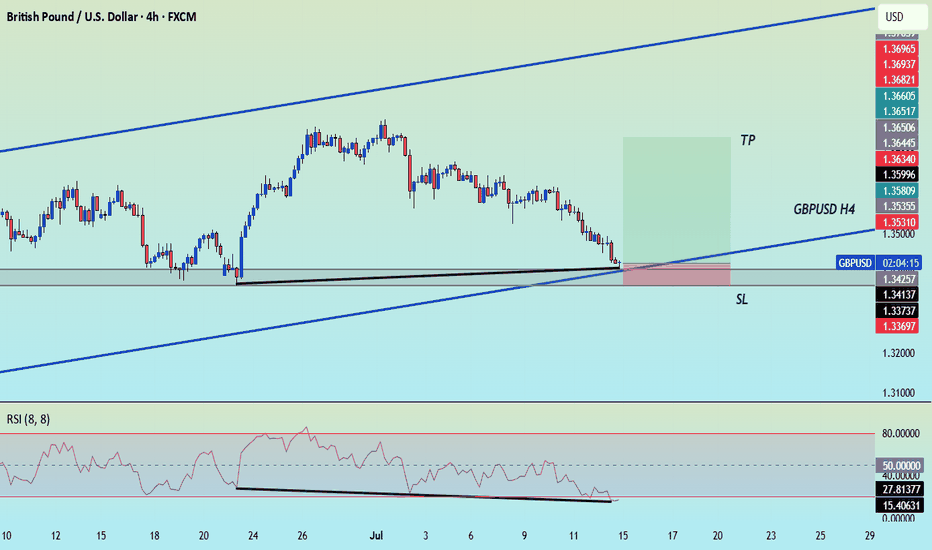
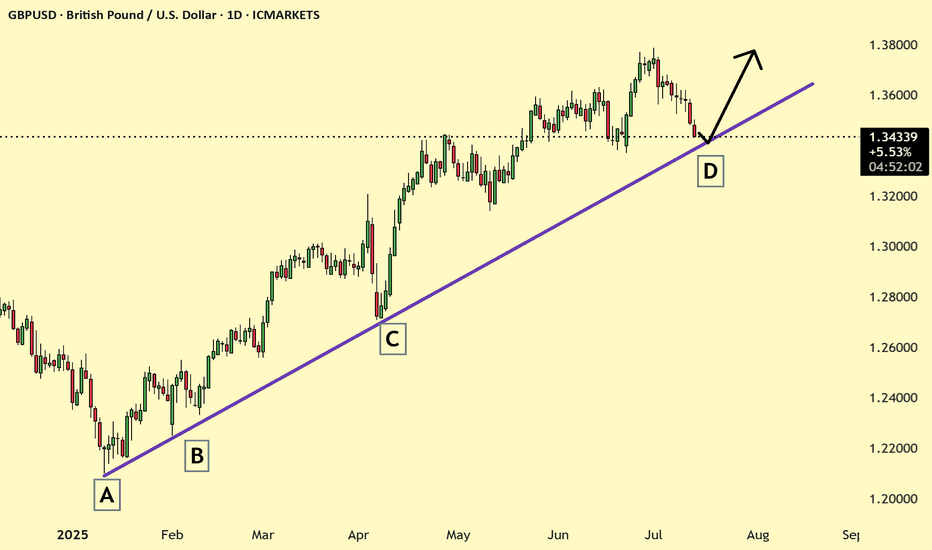
GBPUSD: Two Strong Bullish Area To Buy From ?GU is currently in a bullish trend when examined on a daily time frame. There are two potential areas for purchase. The first area is currently active, as we anticipate a price reversal from this point. There is a significant possibility that price could decline to the second area and subsequently reverse from there directly. The sole reason we believe price could drop to the second area is if the US Dollar experiences corrections, which could cause GU to drop to our second area and subsequently rebound.
If you appreciate our analysis, we kindly request that you consider the following actions:
-Liking the Ideas
-Commenting on the Ideas
-Sharing the Ideas
We extend our sincere gratitude for your continuous support. We trust that our insights have provided even a modicum of assistance.
Team Setupsfx_
❤️🚀
Skeptic | GBP/USD Update: Triggers Fired Up!Hey everyone, it’s Skeptic! ;) yesterday, the support at 1.35672 saw a fake breakout and snapped back into the 4-hour box we’ve been tracking. But bearish momentum is still strong, so here’s the play:
✔️ If you opened a short already , With the fake breakout signaling potential momentum shift, consider taking profits or closing if price consolidates above 1.36089. Why? The fakeout increases the chance of a momentum change.
✨ For new short positions , the 1.35672 break remains a valid trigger. If it breaks again, it could kickstart a major bearish leg, targeting lower supports at 1.35000 and 1.34227 —both strong reaction zones.
📊 The HWC is uptrend, so shorts need extra caution—reduce risk or take profits early.
📉 For longs , wait for a break and consolidation above 1.36406 . This level saw a strong rejection, signaling it’s a key resistance the market respects. A break here, liquidating short positions (which means buying), could spark a solid uptrend leg with great R/R potential.
🔔 Confirmation : Use RSI entering oversold for shorts or overbought for longs. The HWC uptrend means shorts carry higher risk, so tighten your risk management—stick to 1%–2% risk per trade.
🔼 Key Takeaway: Short at 1.35672 if it breaks again, long at 1.36406 with confirmation. Stay sharp for momentum shifts and keep stops tight. I’ll update if the market structure flips!
💬 Let’s Talk!
Which GBP/USD trigger are you locked on? Hit the comments, and let’s crush it together! 😊 If this update lit your fire, smash that boost—it fuels my mission! :)))
Buy idea!Hello all. market break the IHS at London session and reverse from middle of no-where. It is time to go up again. you can use first TP and you can go for a longer position, but I prefer add my position size and close on first TP. we no it is an STS and will go up whole the NY session. be happy(wink)
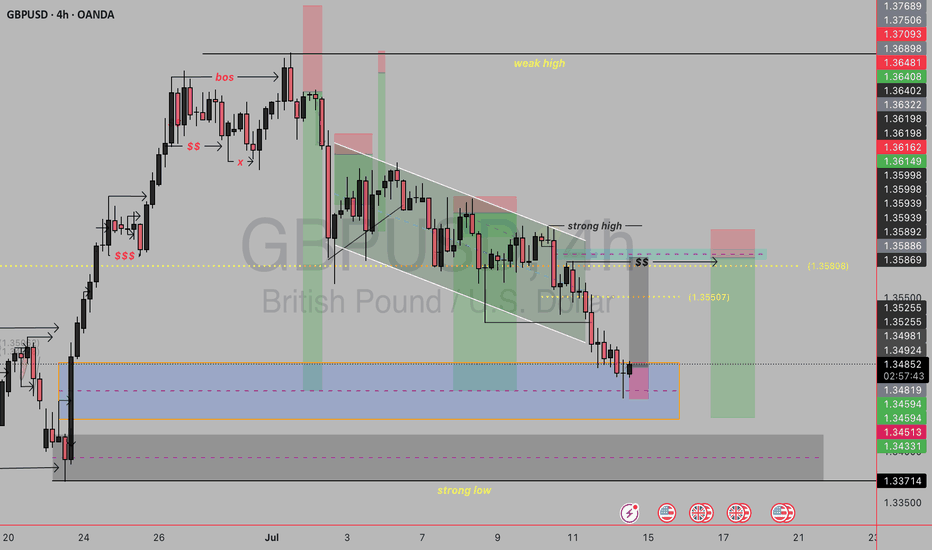
GBPUSD SELL SETUPTimeframe: 4H
Current Price Area: 1.3485
Price Structure: Bearish trend → possible reversal zone
Tools Used: LuxAlgo SMC, Market Structure Breaks (BOS), Supply & Demand zones, Liquidity zones, and internal trendlines
🔧 Structure Breakdown
🟥 1. Break of Structure (BOS) at the top:
There was a bullish BOS earlier (left side of chart), but now the structure shifted bearish.
A clear trendline channel formed as price moved down — showing controlled selling (a descending wedge).
🔻 2. Supply Zone at the top:
Marked in red box — this represents the last bearish order block before the sharp move down.
Acts as a strong supply or re-entry point for sellers if price retraces back.
🔺 3. Current Price at Demand Zone (Reversal Area):
Price is currently sitting inside a demand zone (highlighted in orange + blue).
This zone aligns with previous inefficiency (fair value gap) and a strong low at 1.3451, suggesting a possible buy opportunity for a retracement or reversal.
🧱 4. Strong High / Weak High Logic:
The chart marks a strong high (protected by supply), and a weak high at the top that could be targeted later if bullish continuation happens.
This implies the short-term goal is to grab liquidity from sell-side traders and reverse toward the weak high.
🎯 Entry Logic & Trade Setup
Entry:
Around current demand zone (1.3450–1.3480) after price showed reaction/wick rejection.
Stop Loss (SL):
Just below the strong low (~1.3371) to protect against deep sweep/liquidity grab.
Target 1 (TP1):
Return to supply zone or imbalance area near 1.3507–1.3580.
Target 2 (TP2):
A more aggressive target would be a run toward the weak high (~1.3661).
📉 Bearish Possibility?
If price fails to hold this demand zone and closes strongly below 1.3450 → it would break the strong low → bearish continuation becomes likely.
That would invalidate this reversal and re-open downside targets.
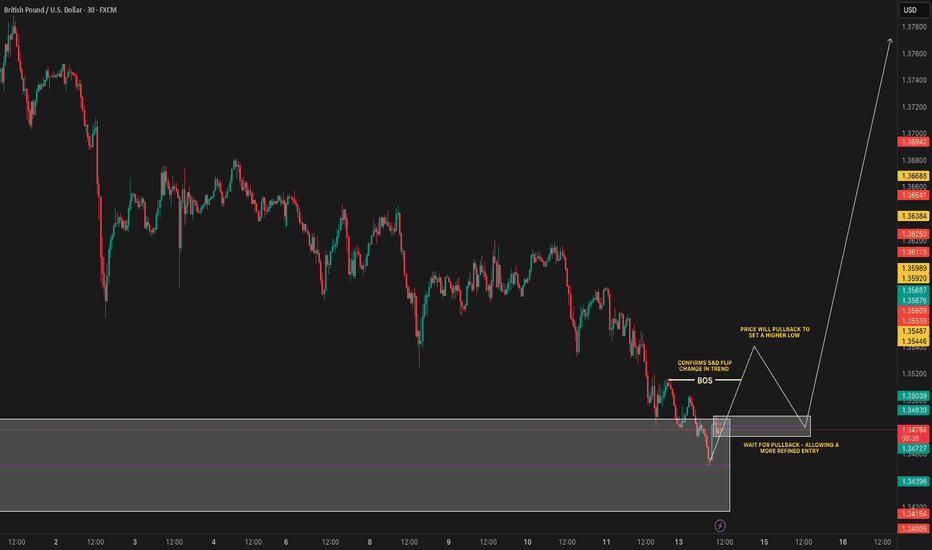
THOUGHTS ON GBP/USD GBP/USD 30M - As you can see above price has traded us down and into an area of interest we have marked out from this weeks Sunday Sessions video.
Now price has traded us down and into this zone we are expecting enough Demand to be introduced to encourage price to flip balances and instigate the new higher timeframe Impulse.
As you are all aware this market is predominantly bullish and up to now has been putting in a bearish corrective wave, this could be the point of reversal and somewhere I feel we could go long from.
Its a case of waiting for a break in structure to confirm this reversal, once we have this break, price tells us that now Demand is in power and we can expect longer term bullishness, giving us the opportunity to buy in.
GBPUSD Will Go Up! Long!
Take a look at our analysis for GBPUSD.
Time Frame: 6h
Current Trend: Bullish
Sentiment: Oversold (based on 7-period RSI)
Forecast: Bullish
The market is on a crucial zone of demand 1.347.
The oversold market condition in a combination with key structure gives us a relatively strong bullish signal with goal 1.358 level.
P.S
The term oversold refers to a condition where an asset has traded lower in price and has the potential for a price bounce.
Overbought refers to market scenarios where the instrument is traded considerably higher than its fair value. Overvaluation is caused by market sentiments when there is positive news.
Disclosure: I am part of Trade Nation's Influencer program and receive a monthly fee for using their TradingView charts in my analysis.
Like and subscribe and comment my ideas if you enjoy them!


