GBPUSD TRADE SETUPWait for retest the entry level then take a trade for sell otherwise skip this setup
GBPUSD trade ideas

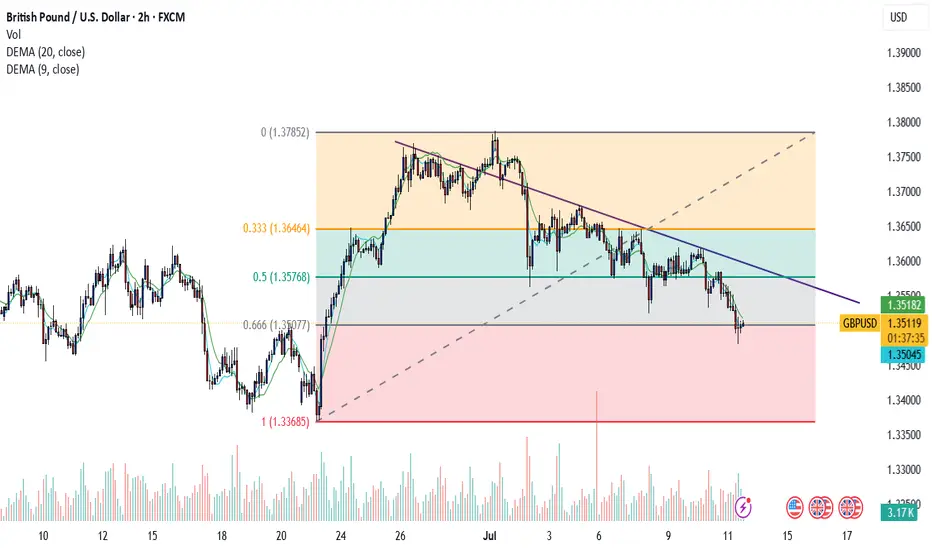
GBPUSD MULTI TIME FRAME ANALYSISHello traders , here is the full multi time frame analysis for this pair, let me know in the comment section below if you have any questions , the entry will be taken only if all rules of the strategies will be satisfied. wait for more price action to develop before taking any position. I suggest you keep this pair on your watchlist and see if the rules of your strategy are satisfied.
🧠💡 Share your unique analysis, thoughts, and ideas in the comments section below. I'm excited to hear your perspective on this pair .
💭🔍 Don't hesitate to comment if you have any questions or queries regarding this analysis.

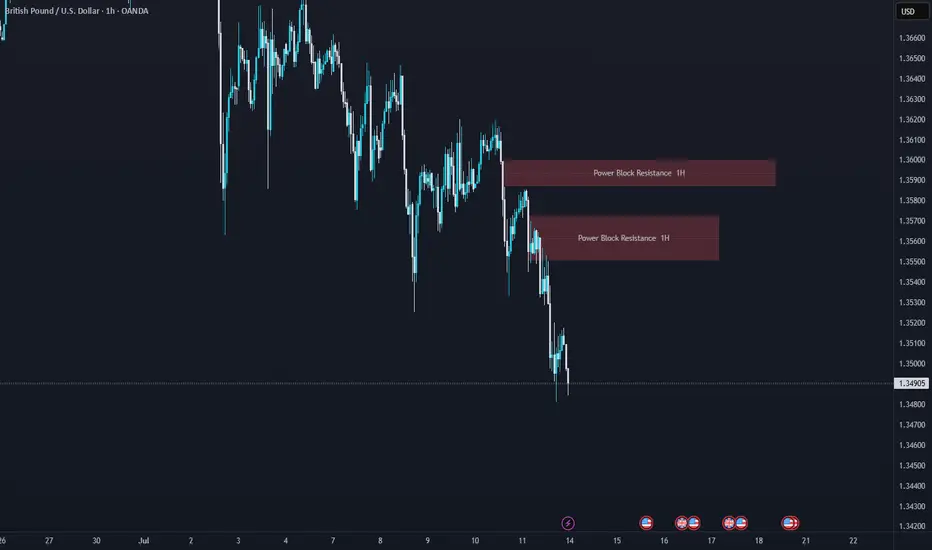
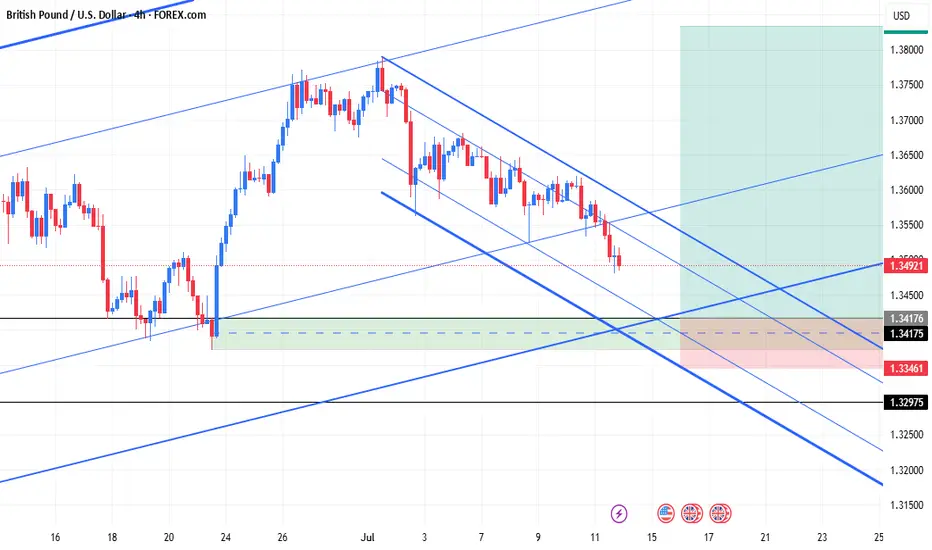
GBPUSD H4 SHORT SETUP: 14-18 JULY 2025TECHNICAL ANALYSIS
Price and market both bearish, with price currently at support. This pair will have to pull back to the resistance level before bears can look to short.
FUNDAMENTAL ANALYSIS
The currency pair GBPUSD has a score of -3, indicating that the base currency is weaker than the quote currency. The trend projection also shows further downside.
The COT report is slightly neutral for both currency pairs, and retail sentiment is 54% bearish. Although the COT is neutral, in a trade like this, the trend is your friend until technical indicators suggest otherwise.

GBPUSD Bearish Signal | Technical + Custom AlgoSmart Trend Signal | Technical Analysis + Custom Algorithm
This signal is the result of a combination of classic technical trend analysis and a proprietary software I personally developed.
GBPUSDGBPUSD is close to giving us a good upward reaction, wait for an impulse for upside soon before you look for buys.
Disclosure: We are part of Trade Nation's Influencer program and receive a monthly fee for using their TradingView charts in our analysis.

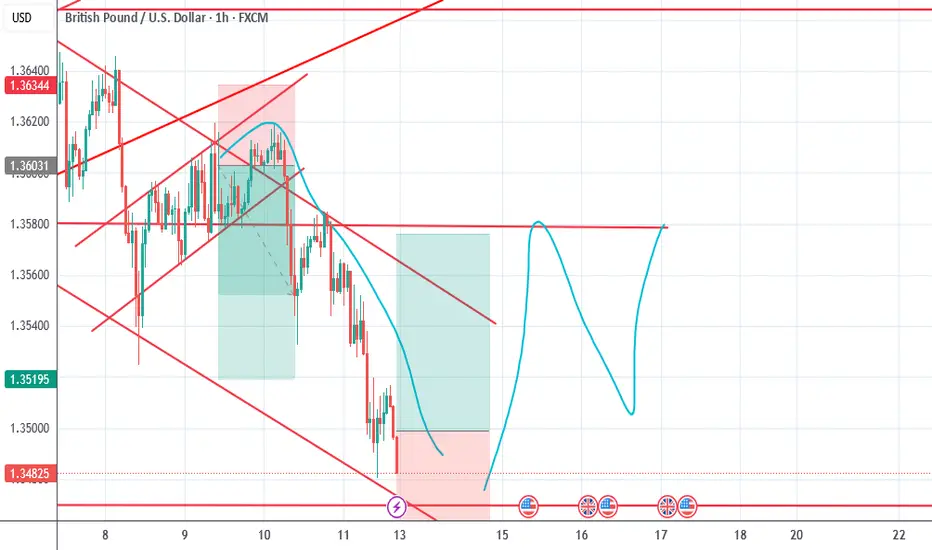
gbp usd bearish ideaas it bounced of the high of the channel its a possible scenario it come back to our target

gbp usd bearish flag emergingits like an emerging bearish flage yet to hit the top one more time i expect , since no major news today it can be a valid setup

cup and handle emerging exprimentalthese are just experimental ideas. help me with what you think. and hope you profit today ...

GBPUSD 1D Analysis on a bullish outlookSmaller time frames are bearish, looking for a turn on bullish to match the higher time frames, 1D bullish OB touch then reverting for the 1D Bearish FVG

GBPUSD LONG TERM GBPUSD Live Trading Session/ GBPUSD analysis #forex #forextraining #forexHello Traders
In This Video GBPUSD HOURLY Forecast By World of Forex
today GBPUSD Analysis
This Video includes_ (GBPUSD market update)
GBPUSD Analysis today | Technical and Order Flow
#usdjpy #usdchftechnicalanalysis #usdjpytoday #gold
What is The Next Opportunity on GBPUSD Market
how to Enter to the Valid Entry With Assurance Profit?
This Video is For Trader's that Want to Improve Their Technical Analysis Skills and Their Trading By Understanding How To Analyze The Market Using Multiple Timeframes and Understanding The Bigger Picture on the Charts.
Disclaimer: Financial Trading Has Large Potential Rewards, But Also Large Potential Risk. You must be aware of the Risk and Be Welling to Accept Them in order to Trade the Financial Market . Please be Carefully With Your Money.
We are talking about future market, anything can Happen,Markets are Always like that.dnt Risky more Than 2% of your account
Now you can join with our "vip premium" service
Join us and let's make trading together


GBPUSD - Also continued downside continuationLooking at GU. This is a little bit ahead of its time in comparison to EU.
And what i mean by that is EU is a lot further away from its 4H demand zone compared to GBP so it will be super interesting to see how we react at the level we are fast approaching on GU.
I am in a short position as of Friday. I will be posting a video tomorrow showing exactly how and why i got short on GU so stay tuned for that one.
As always if there is anything else i can be of assistance with give me a message and i will be happy to answer any questions you may have

GBPUSD Long From Rising Support !
HI,Traders !
#GBPUSD is trading along
The rising support line
And the pair will soon hit
A trend-line from where we
Will be expecting a local
Bullish rebound and a
Further bullish move up !
Comment and subscribe to help us grow !

GBP/USD - Potential TargetsDear Friends in Trading,
How I see it,
PIVOT @ 1.35300
High TF Bullish:
1) The Daily bullish trend is still intact at this time.
2) We need a strong bounce/breach and hold above PIVOT
for 1D trend to continue.
Potential for more downside:
1) If price remains below PIVOT, potential for further downside
remains high.
Keynote:
Monitor price action closely around 1,34000 area.
I sincerely hope my point of view offers a valued insight.
Thank you for taking the time to study my analysis.

GU - Longs📉📈 GBPUSD 15min – ELFIEDT RSI + Reversion Catches the Knife
🧠 Precision Signal | Zero Delay | Real Trade Example
The ELFIEDT RSI + Reversion indicator once again proves its edge — this time on a sharp GBPUSD selloff, where it called the bottom within a single bar of the low.
🟩 Perfect “UP” Signal After Flash Crash
During the NY session, GBPUSD experienced a sudden and aggressive selloff, dropping nearly 80 pips within a few candles.
While many traders panic or chase the move, the indicator calmly printed a high-conviction UP signal at the bottom wick of the final dump candle.
🔹 Hypothetical Trade Idea:
Entry: On candle close after the UP signal
Stop-loss: Just a few pips below the signal wick (tight risk)
Reward: Price rallied over 100 pips in the following hours — perfect mean reversion setup with minimal drawdown
✅ No delay.
✅ No repaint.
✅ No guesswork.
🔍 Why It Matters
Most indicators react late — this one anticipated exhaustion right at the turn.
The result: a low-risk, high-reward setup, spotted live, not in hindsight.
💼 Want access to more advanced versions?
This is only the public edition of ELFIEDT RSI + Reversion.
Advanced builds include:
Multi-timeframe confirmation
RSI trendline breakouts
Hidden divergences
3SD band expansions
Smart signal stacking logic
📩 Message now to apply for access — limited seats for serious traders only.
#GBPUSD #ReversalTrade #ELFIEDT #SmartSignals #ForexTrading #15mChart #MeanReversion #PrecisionTools #TradingView

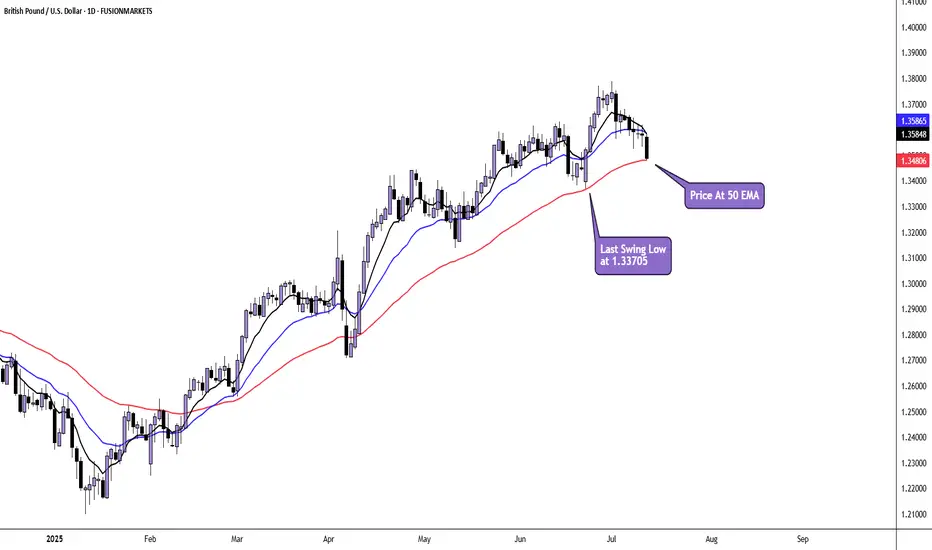
GBP/USD Daily AnalysisPrice is in a daily uptrend and has pulled back to the 50 moving average.
Here, price may find support and set up for another bullish impulse.
However, if price breaks the last swing low at 1.33705, we may have seen a top formed and a change in sentiment.
If you agree with this analysis. look for a trade that meets your strategy rules.
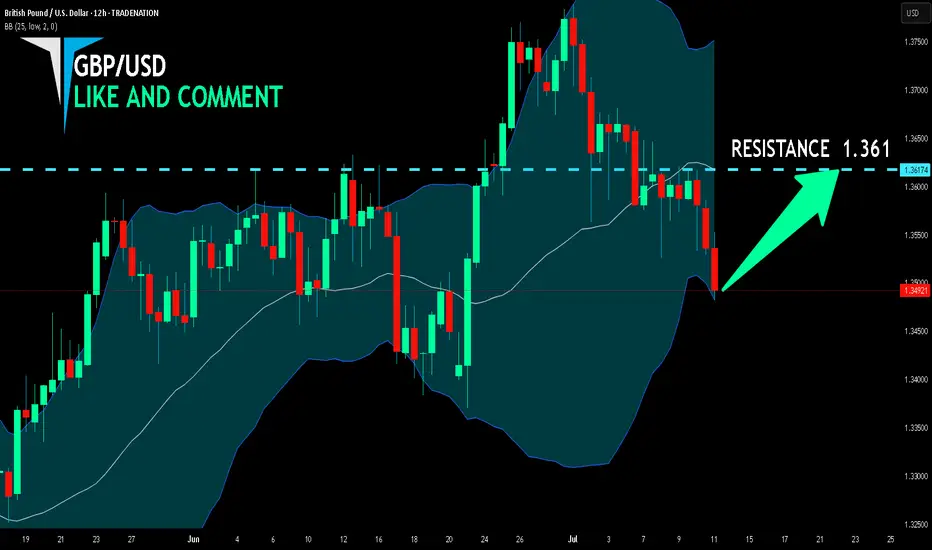
GBP/USD BULLS ARE GAINING STRENGTH|LONG
Hello, Friends!
It makes sense for us to go long on GBP/USD right now from the support line below with the target of 1.361 because of the confluence of the two strong factors which are the general uptrend on the previous 1W candle and the oversold situation on the lower TF determined by it’s proximity to the lower BB band.
Disclosure: I am part of Trade Nation's Influencer program and receive a monthly fee for using their TradingView charts in my analysis.
✅LIKE AND COMMENT MY IDEAS✅
Gbpusd Long SetupGbpusd (M,W,D Strong Bullish)
Daily Bullish trend channel
1:4hr Demand Zone +Fvg
2:1hr Demand Zone +Fvg
According to Seasonality :gbpusd Bullish (July)
GBP/USD - H1- Bearish Flag (07.07.2025)The GBP/USD Pair on the M30 timeframe presents a Potential Selling Opportunity due to a recent Formation of a Bearish Flag Pattern. This suggests a shift in momentum towards the downside in the coming hours.
Possible Short Trade:
Entry: Consider Entering A Short Position around Trendline Of The Pattern.
Target Levels:
1st Support – 1.3520
2nd Support – 1.3460
🎁 Please hit the like button and
🎁 Leave a comment to support for My Post !
Your likes and comments are incredibly motivating and will encourage me to share more analysis with you.
Best Regards, KABHI_TA_TRADING
Thank you.
Disclosure: I am part of Trade Nation's Influencer program and receive a monthly fee for using their TradingView charts in my analysis.

GBP-USD Swing Long! Buy!
Hello,Traders!
GBP-USD is trading in a
Long-term uptrend along
The rising support support
Line and the pair will soon
Hit it and from there we will
Be expecting a bullish
Rebound on Monday
Buy!
Comment and subscribe to help us grow!
Check out other forecasts below too!
Disclosure: I am part of Trade Nation's Influencer program and receive a monthly fee for using their TradingView charts in my analysis.

GBPUSD BuyAs we earlier analysed and patiently waited for the price to get to our Zone for days etc.
Now,the market is ready to go "LONG".
Who is with me ?
Let's deal with GPBUSD 1HTF

STRONG BUY BRITISH POUNDits getting close from the 33 line of the fibo and its creating a bullish engolfing , take your position tight