LONDON BREAKOUT (GBP/USD) 6/4/2025i feel today can be the day ...
yesterday we had to sl hit , its no problem part of it
lets see how this work..
GBPUSD trade ideas

TRADE UNI - GBPUSDGBPUSD (1.35425) - noting PMI figues due out at 3pm a buy set up is appearing in cable. Keep an open mind and aware of these potential price moving PMI figures.
GBPUSDrecommend buy trde mrket is in contrction righ not now but t 7:30 ist there is fundmentl fctor comes so possibly its good for usd so this is my finle set up for trde this month of contrct.(sorry but my keybord key is not work propperley so there is spelling mistke)

BEARISHThe market is selling base on the unmitigated supply which is still significant to trade from. There is a buy trap for the buyers but the selling pressure is still very much valid.

London Take 1 - 4/6/2025Initial comments and what I SEE ...you have to see, before it plays-out and then the confirmations I SEEN gives the confidence to get involved and take a trade.
I = Identify (see)
P = Predict (watch)
D = Decide (based on what you have seen)
E = Execute (after you SEE)
Updates will follow as usual

GBP/USD : Ready for Fall (READ THE CAPTION)By examining the GBP/USD chart on the 4-hour timeframe, we can see that the price is currently trading within the 1.35 supply zone. If a strong rejection occurs from this level, we can expect further downside movement. The potential bearish targets are 1.34915 and 1.34500. Other key supply zones are located at 1.35520, 1.35730, and 1.35930.
Please support me with your likes and comments to motivate me to share more analysis with you and share your opinion about the possible trend of this chart with me !
Best Regards , Arman Shaban

First GU analysis, GU is heading towards resistanceGBPUSD has hit the old breakout support zone and is bouncing in today's US session. When GU closed above 1.351 on h1, it confirmed a nice BUY signal. Target is towards 1.355. In case it closes below 1.351, we have to wait for further confirmation to have a trading strategy.
Do you agree with me?

EURUSD and GBPUSD Breakout?Hello traders, this is a complete multiple timeframe analysis of this pair. We see could find significant trading opportunities as per analysis upon price action confirmation we may take this trade. Smash the like button if you find value in this analysis and drop a comment if you have any questions or let me know which pair to cover in my next analysis.

GU Bulls Raise "Flag" Eyeing Higher PricesFX:GBPUSD has formed a Bull Flag and we could be getting ready to see the Bulls take the spotlight!
After Price broke through the Previous Level of Structure, Price retraces the High of 1.35589 to the 50% Fibonacci Level @ 1.35022 and is supported pushing Price back up from the Previous Level of Structure.
-The 50% retracement signals the end of the Consolidation Phase of the Pattern.
Now with a Bull Flag being a Continuation Pattern, we can suspect that Price will give us a Bullish Breakout of the Descending Channel and Retest before moving higher Confirming the Pattern and once the Breakout is Validated!
Based off the "Flagpole" of the Pattern, if a Bullish Breakout is Validated and the Retest is Successful, the extension of the Set-up would place the Price Target @ 1.3640 which is at the next big level of Resistance.

POST NEWS (EUR/USD) - 2this is post news trading, while I'm opening this trade I'm waiting in gas station to fuel my car ...
the sl is equal to one hour atr and tp is 1.5 times that ...
.
.
.
.
now the trade is on loosing side but we stick to the plan ...
.
.
.
.
these ideas that I'm doing like this is a real journal of my live trades with real account. documenting these datas to give a more disciplined route to my journy of trading ...
good luck !

GU-Wed-4/06/25 TDA-Not easy zone to mess with GU!Analysis done directly on the chart
Follow for more, possible live trades update!
Today's focus: Trading Psychology
-Have you ever over traded?
-Have you ever revenge traded?
-Have you ever got greedy and end up
with a loss instead of good profits?
-What is something that you struggle to
these days psychologically speaking?
I've been all these situations mentioned above!
Each of this three steps are crucial to
become a very good trader:
1) Consistently profitable strategy
2) Proper risk management
3) Trading Psychology
What's your ideal solution to improve
your trading psychology?
Comment down below!
Not financial advice, DYOR.
Market Flow Strategy
Mister Y

GBPUSDGBP/USD Analysis: June 1–10, 2025
Key Drivers: Economic Data, Bond Yields, Interest Rates, and Carry Trade Dynamics
1. Upcoming Economic Data (June 1–10)
US Data:
June 4;1:15pm USD ADP Non-Farm Employment Change
June 6: Nonfarm Payrolls (May) – Strong jobs growth (>200k) could revive USD strength.
June 6: Average Hourly Earnings – Wage growth impacts Fed policy expectations.
2. 10-Year Bond Yields and Interest Rate Differential
UK 10-Year Gilt Yield: 4.77% (as of May 21, 2025) .
US 10-Year Treasury Yield: 4.46% (as of June 2, 2025) .
4.77% (UK)−4.46% (US)=+0.31%
The UK’s higher bond yield provides a modest carry advantage for GBP.
Policy Rates:
BoE Rate: 4.25% (cut by 25bps in May 2025) .
Fed Rate: 4.25–4.50% (steady since May 2025).
Rate Differential:
4.25% (BoE)−4.25–4.50% (Fed)=−0.25% to 0%
3. Carry Trade Advantage
Mechanics: Investors borrow USD (lower policy rate) to invest in GBP assets (higher bond yields), exploiting the +0.31% yield spread.
Current Bias: Neutral-to-Bullish for GBP, supported by bond yield spreads but tempered by BoE’s dovish stance.
Risks:
Weak UK PMI/GDP data could narrow yield spreads.
Strong US NFP may widen the policy rate gap, boosting USD.
Bullish Catalysts:
UK CPI >3.5% delays BoE cuts.
Weak US jobs data (<150k) weakens USD.
Bearish Catalysts:
BoE signals further cuts.
Strong US wage growth (>0.4% MoM).
Summary Table
Metric UK (GBP) US (USD)
10-Year Bond Yield 4.77% 4.46%
Policy Rate 4.25% 4.25–4.50%
Yield Spread +0.31% (GBP over USD) —
Key Data Focus CPI, GDP, PMIs NFP, Wage Growth
Carry Trade Implication Modest GBP advantage USD strength on policy rate
Conclusion
GBP/USD’s near-term direction hinges on UK inflation and US jobs data. The UK’s higher bond yields offer a carry trade edge, but BoE dovishness and USD resilience may cap gains.
#GBPUSD#


GBPUSD LONGBefore or during London session opens I expect sweep of Sellside Liquidity and target Buyside Liquidity or for second target OB with Imbalance before it.


Skeptic | GBP/USD Analysis: Breakout Triggers in the Box!Hey everyone, Skeptic here! FX:GBPUSD has been killing it with a solid uptrend but now it’s chilling in a correction phase, trapped in a box range. A break above or below this box could light up some epic triggers, so let’s dive into a multi-timeframe analysis to get the full picture.
🧠 Starting with the Daily Timeframe
we’re riding a powerful upward channel where price has been dancing perfectly with the ceiling, floor, and midline. We’ve nabbed some sweet trades from this setup before! After hitting resistance at 1.35576 , we slipped into a time-based correction.
Here’s the daily breakdown:
If the box floor at 1.35002 cracks, we could slide to 1.34173 , hitting the 0.382 Fibonacci retracement— a legit first support zone. 🎯
If we bust through the ceiling, the channel’s midline is our next target. But with lower highs forming, I’m betting on a deeper correction for now. 📉
With that intel, let’s zoom into the 4-Hour Timeframe for our main long and short triggers. 🔥
For longs, a break above 1.35576 is our golden ticket, with a stop loss below the box. Want a quicker R/R and early profits? Set a tighter stop below the 1H or 15-minute floor that forms. 💸 For shorts, we can play with a smaller stop loss. I’d jump in after breaking support at 1.35002 , with a stop loss at 1.35464 if we go bearish from here. If we test the box ceiling again before breaking the floor, the stop loss sits above the box. 🚨 Heads-up: longs are riskier based on the daily clues. As always, do your own research, steer clear of FOMO, and never forget—capital management and stop losses are your market lifelines. Nobody shouts about those enough! A single trade, good or bad, won’t make or break your long-term game, so skip the emotional drama and grind on your strategy and psychology.
💬 Let’s Talk!
If this recap got your gears turning, smash that boost—it means a lot! 😊 Got a pair or setup you want me to tackle next? Drop it in the comments. Thanks for vibing with me—keep trading sharp! ✌️

GBPUSD 1H chart✅ What I Like:
Clean Fair Value Gap (FVG):
The FVG is clearly defined and price is actively returning to it.
This offers a textbook point of interest (POI) for a potential short.
Price Delivered into Premium:
This FVG is sitting in a premium zone (above the equilibrium of the recent swing), making it a good area for potential shorts if internal liquidity has been swept.
Aggressive Displacement Candle:
The bullish candle that tapped into the FVG is impulsive — might be a liquidity run, grabbing buy-side liquidity before a reversal.
⚠️ Concerns:
No Clear Liquidity Sweep Yet:
There’s no obvious run on recent highs before price hits the FVG.
Without a liquidity grab, the setup might lack that “smart money” confirmation.
No Market Structure Shift Confirmed:
We’re still in bullish short-term structure unless we break a recent low.
A reversal from the FVG needs confirmation via lower-timeframe BOS.
Dollar News Event Approaching?
The FVG reaction could fake out if major USD data is near.
Fundamentals can disrupt clean technical setups.
🧠 Final Thoughts:
If this setup is to be shorted:
Wait for 15m or 5m structure shift.
Look for signs of exhaustion or rejection in the FVG zone (e.g., bearish engulfing, liquidity sweep of intraday highs).
If price pushes above the FVG without rejection, it may invalidate the short and continue toward higher liquidity.
High-probability zone, but needs confirmation + narrative.

Sterling headed towards 1.40 in coming days.Cable been on a uptrend since the Liz Truss low. Latest bout of dollar weakness obviously helping whilst long term monthly chart is very constructive indicating new uptrend is fully intact. Other supporting narrative is the new "growth" aware labour government that has begun to forge something of a return to Europe along with new trade deals with India and the USA. Many traders and PMs also aware that the British Pound has a long relatively stable history whilst the Bank of England has not defaulted on its Gilts which have been reliably paid for more than 400 years.
recent previous resistance on light blue line now acting as support. Sit tight cable has plenty of upside from here.

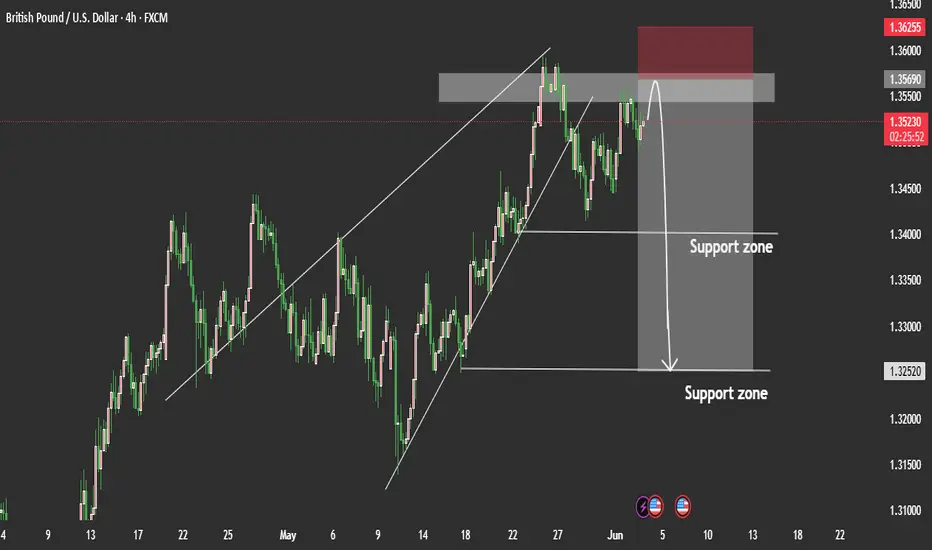
GBP/USD Bearish Setup Analysis GBP/USD Bearish Setup Analysis
GBP/USD appears poised for a bearish move, following signs of a completed corrective structure observed a few days ago. The pair had shown a temporary recovery, but recent price action suggests that this correction may now be over, increasing the likelihood of a larger decline.
While the exact catalyst for the move is still uncertain, the technical setup looks promising. This could potentially trigger a liquidity release, especially if key support levels are broken with momentum.
Key downside targets:
1.3400
1.3252
you may find more details in the chart P Support with like and comments for better analysis.
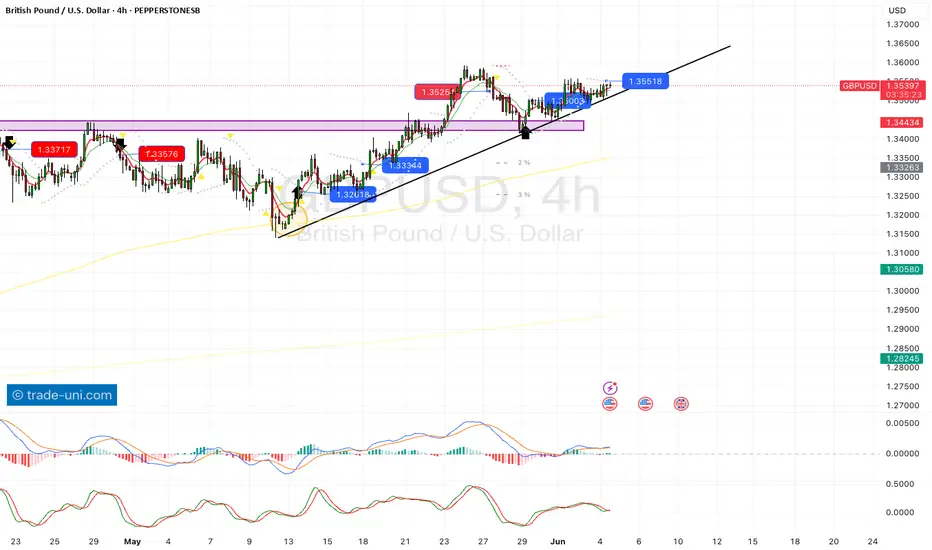
GBPUSD: Move Up Ahead!The GBPUSD pair is poised for further gains after successfully breaking above a key resistance line of a falling wedge pattern.
This breakout occurred during a retest of a recently breached daily/intraday structure, indicating strong bullish momentum.
Traders are now targeting a price level of 1.3558, suggesting continued upward potential in the near term.


Consolidation ahead of the next bullish rallyThe GBP/USD exchange rate has edged lower below the three-year high of 1.3592 set in May. To sustain the upward momentum, prices need to decisively close above the resistance line of 1.3597 since July 2023 (which capped gains last week). A breakthrough above the key resistance zone of 1.3658 could trigger a stronger rally, targeting the 2022 high of 1.3747. Further breakthroughs may shift market focus to the upward trendline (around 1.3865). Technically, short-term risks remain biased to the upside, supported by the rebound of the stochastic oscillator.
Humans need to breathe, and perfect trading is like breathing—maintaining flexibility without needing to trade every market swing. The secret to profitable trading lies in implementing simple rules: repeating simple tasks consistently and enforcing them strictly over the long term.
Trading Strategy:
buy@1.3490-1.3500
TP:1.3550-1.3600

GBPUSDGBPUSD formed a potential head and shoulders , broke our trendline, and is coming back for a retest..high potential for bullish momentum
