GBPUSD long position 01/08/2025English : According to our analysis, we anticipate a bullish scenario.
Morocan Darija : kanchofo d'apres l'analyse dyalna antsanaw tloo3
ATENTION : I only share my ideas, not signals
GBPUSD trade ideas

My Trading Journal on GU 30.07.2025GBPUSD has reached a significant point of interest, showing a high level of accuracy with a Fair Value Gap on the higher time frame. This presents an excellent entry opportunity. Additionally, today is midweek, and there are high-impact events to consider. Keep an eye on it as the events unfold.

GBPUSD BUYBUY @1.31532
SL @1.31427
TP @1.32057
If SL hits by a candle sweep and closed above the entry level again buy....
And always risk 1%

GBPUSD: Bearish Continuation & Short Signal
GBPUSD
- Classic bearish setup
- Our team expects bearish continuation
SUGGESTED TRADE:
Swing Trade
Short GBPUSD
Entry Point - 1.3264
Stop Loss - 1.3287
Take Profit -1.3218
Our Risk - 1%
Start protection of your profits from lower levels
Disclosure: I am part of Trade Nation's Influencer program and receive a monthly fee for using their TradingView charts in my analysis.
❤️Please, support our work with like & comment! ❤️

GPBUSD: BULLISH?The British Pound (GBP) has demonstrated a notable recovery in recent trading sessions, regaining some upside momentum on Friday. Despite this rebound, The GBP/USD pair's technical setup suggests that a rally towards the 1.3400 psychological level is necessary before any further drop. The pair's ability to breach this level will likely determine its short-term trajectory, with a successful break above paving the way for further gains and a failure to break above potentially leading to renewed selling pressure.
GBP/USD: Post-Impulse Sell Setup from Ending DiagonalThe chart depicts a completed 5-wave impulsive structure, culminating at the top of wave (5). The internal wave structure of the final fifth wave forms a classic ending diagonal pattern, typically signaling a trend reversal or deep correction.
After this extended fifth wave, the price has started rolling over, confirming the start of a corrective decline. The wave count now expects an ABC correction targeting the previous wave 4/2 demand zone, highlighted in red.
Target 1 (T1): 1.33608
Target 2 (T2): 1.32436
Stop Loss (SL): 1.35988
Ending diagonal at the top of wave (5) signals exhaustion of bullish momentum.
Clear bearish divergence (not shown here) is commonly seen with this pattern.
The price has broken the short-term structure and is now forming lower highs.
Target zone aligns with previous wave 2 consolidation – a typical retracement zone for post-impulse corrections.

GBPUSD IDEA The key is patience- from all the ideas, well wait for the clearest ones that give us confirmation... and then we jump in. lets goooooo


GBPUSD SWING TRADE AUGUSTTaking support from last month's low and now swing trade opportunity forming.
follow for more swing analysis on indices, commodities and currecies.
Live market analysis.
test the accuracy by reviewing my previous analysis of trades i took and published.
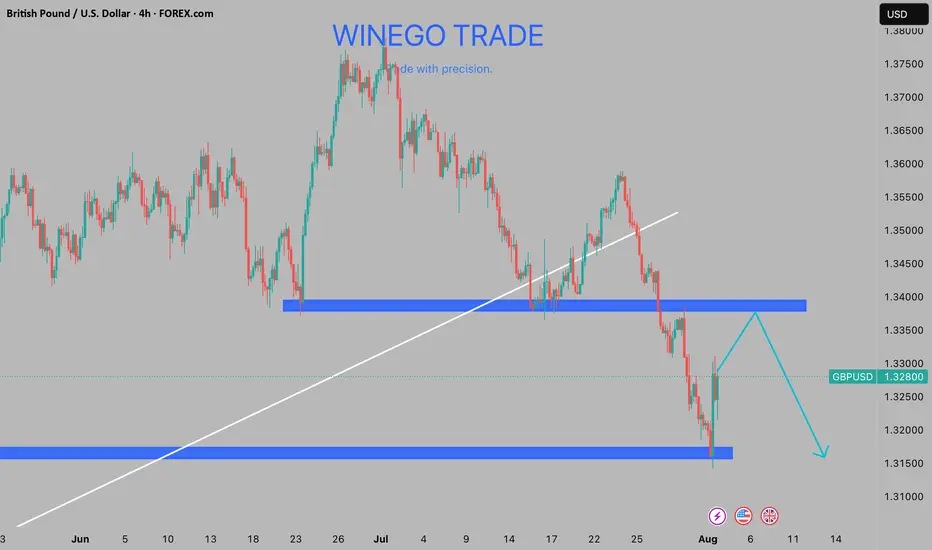
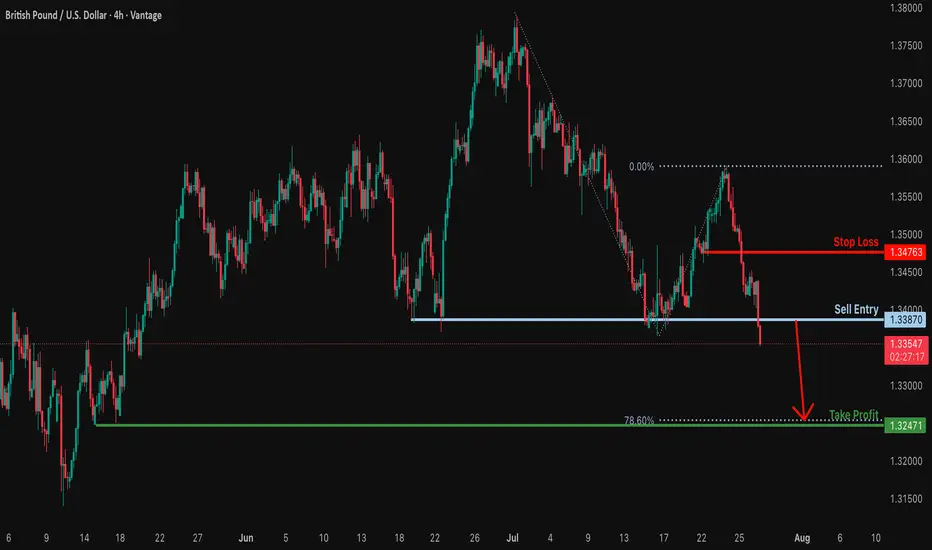
Potential bearish drop?GBP/USD has reacted off the support level which is a multi swing low support and could drop from this levle to our take profit.
Entry: 1.3387
Why we like it:
There is a multi swing low support.
Stop loss: 1.3476
Why we like it:
There is a pullback resistance.
Take profit: 1.3247
Why we like it:
There is a multi swing low support that aligns with the 78.6% Fibonacci projection.
Enjoying your TradingView experience? Review us!
Please be advised that the information presented on TradingView is provided to Vantage (‘Vantage Global Limited’, ‘we’) by a third-party provider (‘Everest Fortune Group’). Please be reminded that you are solely responsible for the trading decisions on your account. There is a very high degree of risk involved in trading. Any information and/or content is intended entirely for research, educational and informational purposes only and does not constitute investment or consultation advice or investment strategy. The information is not tailored to the investment needs of any specific person and therefore does not involve a consideration of any of the investment objectives, financial situation or needs of any viewer that may receive it. Kindly also note that past performance is not a reliable indicator of future results. Actual results may differ materially from those anticipated in forward-looking or past performance statements. We assume no liability as to the accuracy or completeness of any of the information and/or content provided herein and the Company cannot be held responsible for any omission, mistake nor for any loss or damage including without limitation to any loss of profit which may arise from reliance on any information supplied by Everest Fortune Group.
GBPUSD: Sellers Are Taking ControlWelcome back to the Weekly Forex Forecast for the week of July 28 - Aug 1st
In this video, we will analyze the following FX market:
GBPUSD
GBP is weak vs USD. GU is heading lower with a bit of steam.
The Monthly and the Weekly are still bullish, but the Daily and 4H indicate weakness. I would not entertain longs until I see a bullish BOS.
Look for the CISD on the 4H in the beginning of the week, confirming sells are the way to go.
Enjoy!
May profits be upon you.
Leave any questions or comments in the comment section.
I appreciate any feedback from my viewers!
Like and/or subscribe if you want more accurate analysis.
Thank you so much!
Disclaimer:
I do not provide personal investment advice and I am not a qualified licensed investment advisor.
All information found here, including any ideas, opinions, views, predictions, forecasts, commentaries, suggestions, expressed or implied herein, are for informational, entertainment or educational purposes only and should not be construed as personal investment advice. While the information provided is believed to be accurate, it may include errors or inaccuracies.
I will not and cannot be held liable for any actions you take as a result of anything you read here.
Conduct your own due diligence, or consult a licensed financial advisor or broker before making any and all investment decisions. Any investments, trades, speculations, or decisions made on the basis of any information found on this channel, expressed or implied herein, are committed at your own risk, financial or otherwise.

GBP/USD 4H Chart Analysis (Bearish Flag) Read the caption📉 GBP/USD 4H Chart Analysis
Pattern Identified: Bearish Flag Pattern
Timeframe: 4-Hour (4H)
Currency Pair: GBP/USD
🔍 Chart Explanation:
This chart illustrates a classic Bearish Flag Pattern, which is a continuation pattern signaling a potential further decline in price after a temporary consolidation.
Downtrend Leg (Flagpole):
The strong and sharp bearish move on the left side of the chart forms the flagpole, indicating aggressive selling pressure.
Consolidation (Flag Formation):
Price enters a rising channel (the flag) which reflects a short-term corrective phase or pullback. This consolidation occurs within the Resistance Zone, suggesting weakening bullish momentum.
Resistance Zone:
Marked in blue, this zone is where the price struggled to break above, and it acts as a ceiling. Rejection from this zone confirms bearish pressure and increases the likelihood of a breakdown.
Breakdown & Target Levels:
The chart shows that price has broken out downward from the flag pattern, triggering a continuation of the prior downtrend.
Two important support levels are highlighted:
🔸 1st Support: 1.33449 – This is the immediate target where price may pause or react.
🔸 2nd Support: 1.32408 – This is the extended target if selling pressure continues.
Ichimoku Cloud (Background):
The cloud behind the price action represents market sentiment. The red cloud suggests a bearish bias aligning with the flag pattern breakdown.
🧠 Technical Summary:
This setup favors a sell-side outlook. The rejection from resistance within a bearish flag and subsequent breakdown confirm bearish momentum. Traders may look for selling opportunities below the flag breakdown with targets at the mentioned support zones.

GBP USD Long Term SellAs we are approaching NFP and FOMC, the outlook for me will be a no rate change and with the consensus being USD Long, it makes sense for GBP USD to sell off. Monthly, Weekly and Daily looking like it wants to continue down after a manipulation bringing GBP USD higher in the short term. A lot of pips to the downside into the end of this week and next week. Definitely one to keep an eye on.

GBP/USD DAILY CHART ANALYSIS - 4TH AUG 2025GBP/USD Daily Chart Setup – August 4, 2025:
I'm watching for price to reach the yellow imbalance zone between 1.35066 and 1.34538, which will be my designated sell zone. My final take-profit target for GBP/USD short positions is set between 1.29434 and 1.27423.

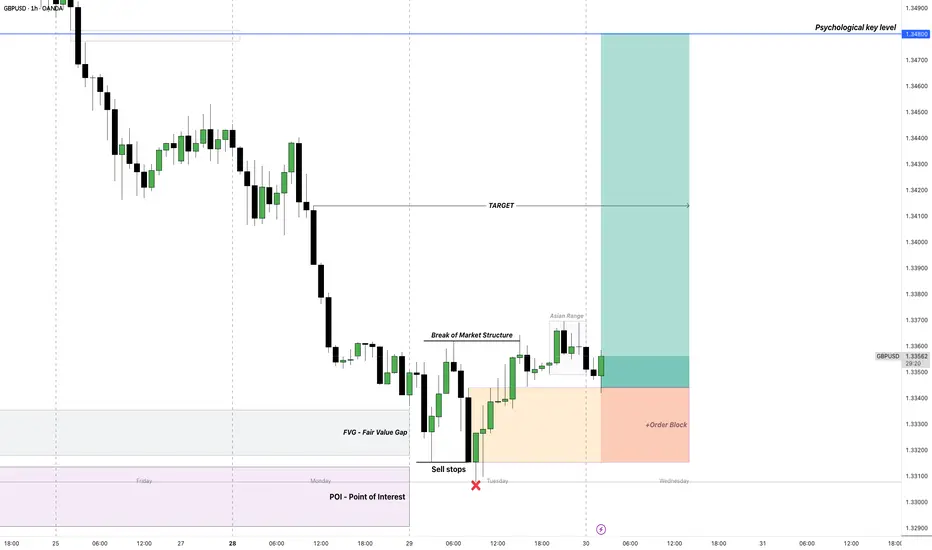
GBPUSD – DAILY FORECAST Q3 | W31 | D1 | Y25📊 GBPUSD – DAILY FORECAST
Q3 | W31 | D1 | Y25
Daily Forecast 🔍📅
Here’s a short diagnosis of the current chart setup 🧠📈
Higher time frame order blocks have been identified — these are our patient points of interest 🎯🧭.
It’s crucial to wait for a confirmed break of structure 🧱✅ before forming a directional bias.
This keeps us disciplined and aligned with what price action is truly telling us.
📈 Risk Management Protocols
🔑 Core principles:
Max 1% risk per trade
Only execute at pre-identified levels
Use alerts, not emotion
Stick to your RR plan — minimum 1:2
🧠 You’re not paid for how many trades you take, you’re paid for how well you manage risk.
🧠 Weekly FRGNT Insight
"Trade what the market gives, not what your ego wants."
Stay mechanical. Stay focused. Let the probabilities work.
FX:GBPUSD

GBPUSD Bearish Reversal Setup After Liquidity SweepGBPUSD has broken bullish structure on the daily, but on the lower timeframe, price ran equal highs and swept liquidity. That sweep was followed by a sharp reaction, signaling potential bearish intent.
I’ve entered short with a stop above the highs, anticipating a move lower. My target is 1.31400, which lines up with a key relative equal low (REL) and potential liquidity draw.

GBPUSD : NEW WEEK TECHNICAL BIAS (MARKET OPEN)CONTEXT
(Strictly Technical Outlook – No Fundamental Overlays)
▪︎ Higher Timeframe (HTF) Price Action from the previous week signals a potential pullback or reversal, as last month closed with a strong bearish momentum candle.
▪︎ However, the broader bullish structure remains intact — current Descend Sequence is interpreted as a corrective leg into discounted territory.
▪︎ I anticipate price to trade lower into the Monthly Price Inefficiency Zone (M-PIZ) and further toward the discount zone of the prevailing price leg.
▪︎ A rally toward the 1.33502 – 1.34014 region would offer a high-probability zone for short setups. A sweep or reclaim of 1.31739 may precede this rally.
▪︎ The premium OCZ appears unlikely to be reached — unless employed as a Trap.
▪︎ Downside targets include:
i. Monthly PIZ
ii. 1.29442 and potentially levels below
Invalidation:
Bearish setup will be invalidated if price trades above 1.36942 with microstructure confirming an Ascend Sequence continuation.
Note: Bias is developed strictly from chart structure using IntelEdge Technical Protocol – no fundamental overlays included.
📌 Disclaimer: is a strategic directional bias, not financial advice. Execute only with confirmation and proper risk management.

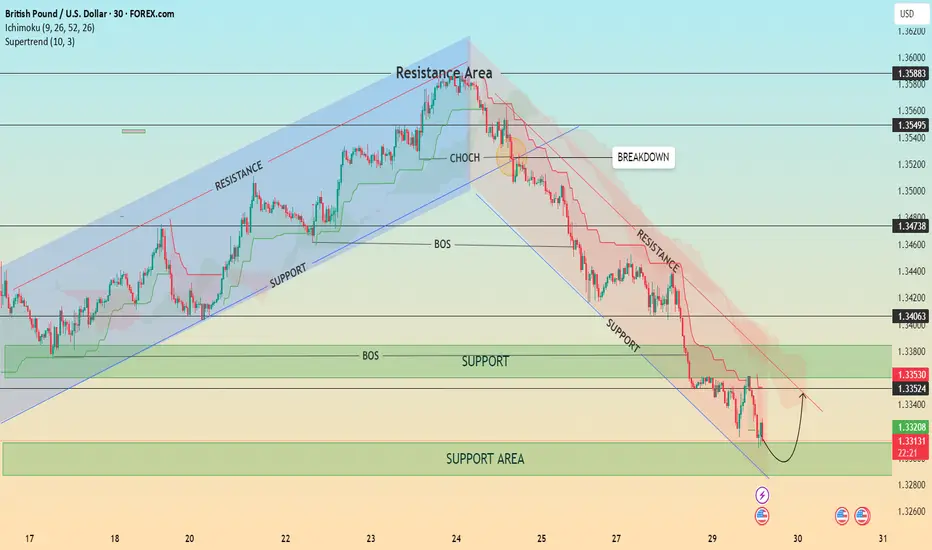
GBP/USD – Bearish Structure with Possible Short-Term Pullback📊 GBP/USD – Bearish Structure with Possible Short-Term Pullback
Timeframe: 30-Minute | Date: July 29, 2025
Price action recently broke down from a well-respected ascending channel, confirming a shift in market structure with a Change of Character (CHOCH) followed by a Break of Structure (BOS). Since then, GBP/USD has been respecting a descending trend channel, forming consistent lower highs and lower lows.
🔍 Current Setup:
Price is testing a major support area around 1.3300–1.3320.
A minor pullback is expected as indicated by the bullish wick rejections.
However, the overall bias remains bearish unless we break and hold above the 1.3353–1.3406 resistance zone and the descending trendline.
The Ichimoku Cloud and Supertrend both show bearish momentum.
📈 Potential Scenario:
Price may bounce from the support area and retest the upper boundary of the descending channel before resuming the bearish trend.
⚠️ Key Levels to Watch:
Resistance: 1.33530 / 1.34063 / 1.34738
Support: 1.33200 / 1.33000
💡 Structure Notes:
CHOCH = Trend Reversal Signal
BOS = Confirmation of Downtrend
Cloud = Dynamic Resistance
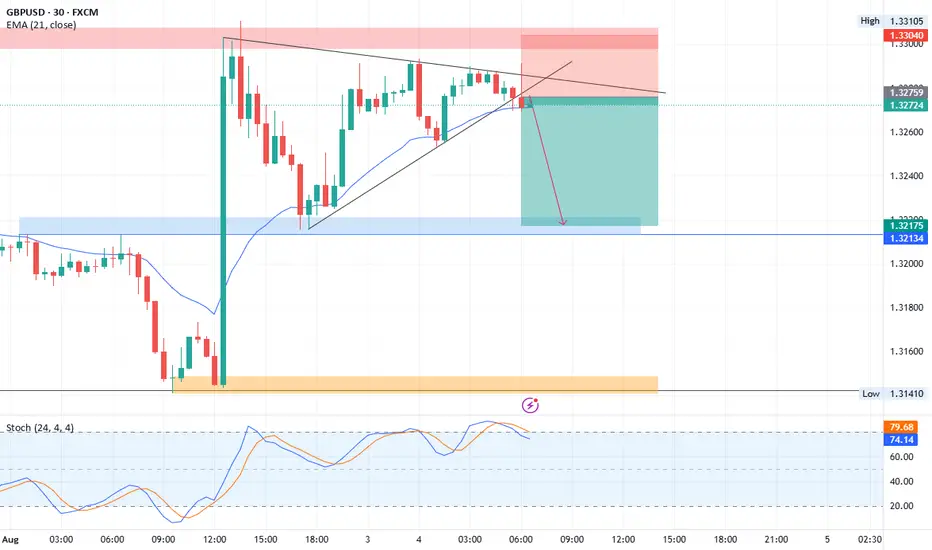
GBPUSD short setupGBPUSD rising trendline break and retest falling trend line finnly breakout triangel.
Sell below: 1.3275
Stop Loss: 1.3305
1st target: 1.3250
2nd target: 1.3215 FOREXCOM:GBPUSD
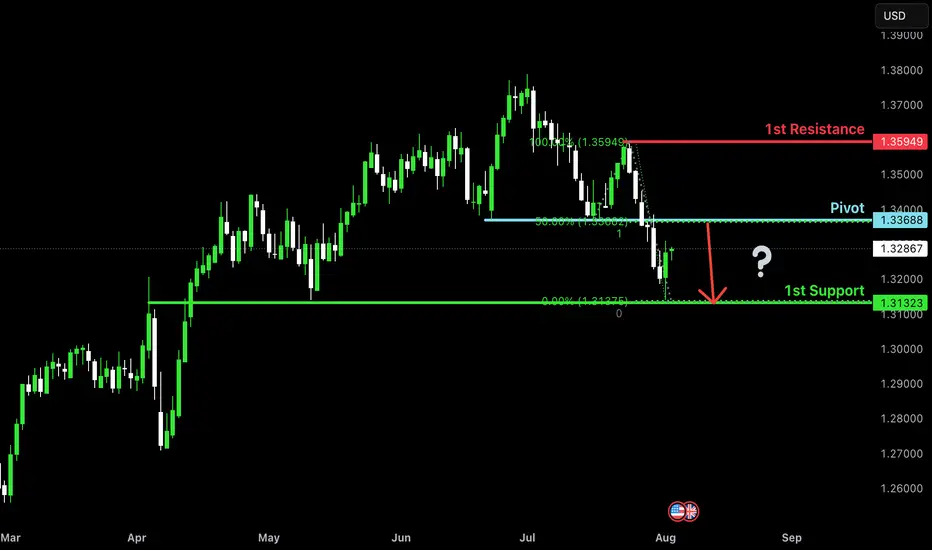
Heading into pullback resistance?The Cable (GBP/USD) is rising towards the pivot, which has been identified as a pullback resistance and could reverse to the 1st support, which acts as an overlap support.
Pvot: 1.3368
1st Support: 1.3132
1st Resistance: 1.3594
Risk Warning:
Trading Forex and CFDs carries a high level of risk to your capital and you should only trade with money you can afford to lose. Trading Forex and CFDs may not be suitable for all investors, so please ensure that you fully understand the risks involved and seek independent advice if necessary.
Disclaimer:
The above opinions given constitute general market commentary, and do not constitute the opinion or advice of IC Markets or any form of personal or investment advice.
Any opinions, news, research, analyses, prices, other information, or links to third-party sites contained on this website are provided on an "as-is" basis, are intended only to be informative, is not an advice nor a recommendation, nor research, or a record of our trading prices, or an offer of, or solicitation for a transaction in any financial instrument and thus should not be treated as such. The information provided does not involve any specific investment objectives, financial situation and needs of any specific person who may receive it. Please be aware, that past performance is not a reliable indicator of future performance and/or results. Past Performance or Forward-looking scenarios based upon the reasonable beliefs of the third-party provider are not a guarantee of future performance. Actual results may differ materially from those anticipated in forward-looking or past performance statements. IC Markets makes no representation or warranty and assumes no liability as to the accuracy or completeness of the information provided, nor any loss arising from any investment based on a recommendation, forecast or any information supplied by any third-party.
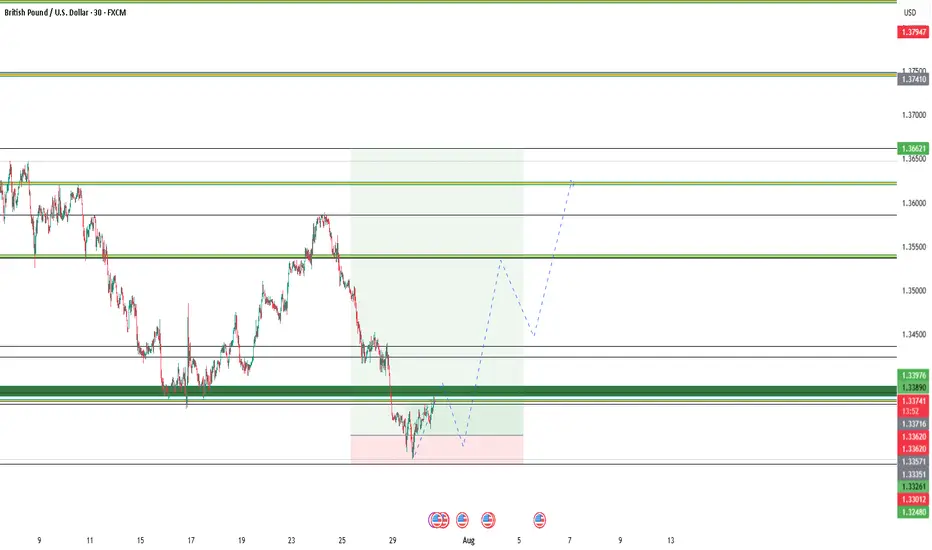
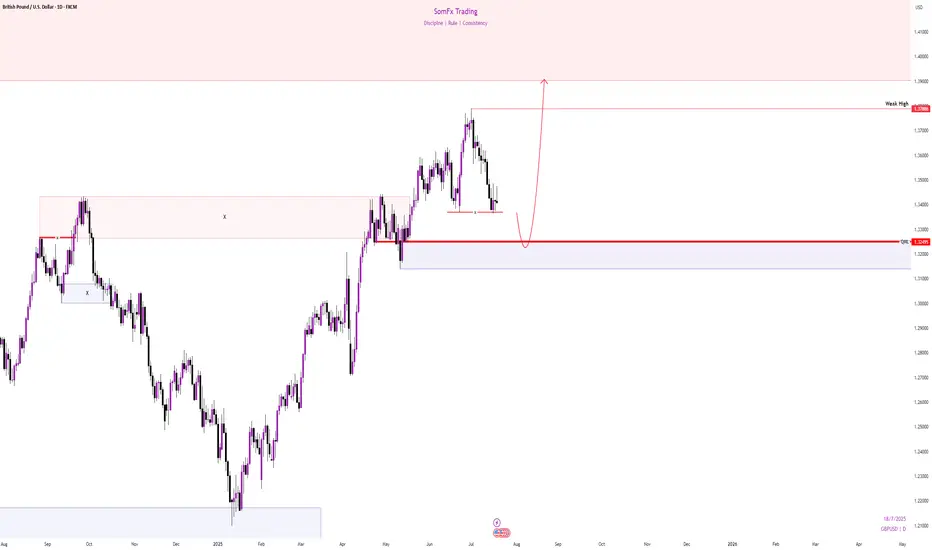
GBPUSD Big Bullish Move incoming.GGBPUSD as trending to the upside quite a few months, breaking above 1.3450 leaving behind a Trapped zone for the sellers which is weekly Flip level which happened right before the breaking up and also the market created a liquidity Zone which is intended to further Trap the the seller, and it is acting as a Double Bottom area, i hope sellers will be trapped the next week and righ after that we look for our bullish positions.
GBPUSD LONG im buying GBPUSD because structure break shows buyer control Imbalance creates a natural magnet Lower timeframe confirms the energy
