GBPUSD – Classic FRL setup unfoldingWe have a clear descending channel (wedge) on H1, with the price testing the neckline level after a corrective consolidation.
According to Fractal Reversal Law (FRL):
The neckline is drawn horizontally at the start of the last impulse, not on the top of the candle wicks.
The price has retested the neckline multiple times, forming a clean structure before potential continuation.
The 100 SMA is above the price, confirming the bearish structure and scale alignment.
Trade Plan:
🔻 Entry: Below the neckline on confirmation of breakout.
🔻 Stop Loss (SL): Above the upper boundary of the channel and last swing high (clearly marked on the chart).
🔻 Take Profit (TP): At the intersection of the lower channel line with the long-term ascending trendline (green support), around 1.34 area.
Confirmation:
• The MACD shows momentum fading, indicating a potential downside move aligning with the FRL setup.
• We expect a clean impulse downward after a tight consolidation, providing a high-probability entry.
Following the FRL principles, we wait for a clean breakout below the neckline to confirm the structure shift before entering.
GBPUSD trade ideas

GBPUSD I Daily CLS I KL - FVG I Model 1Yo Market Warriors ⚔️
Fresh outlook drop — if you’ve been riding with me, you already know:
🎯My system is 100% mechanical. No emotions. No trend lines. No subjective guessing. Just precision, structure, and sniper entries.
🧠 What’s CLS?
It’s the real smart money. The invisible hand behind $7T/day — banks, algos, central players.
📍Model 1:
HTF bias based on the daily and weekly candles closes,
Wait for CLS candle to be created and manipulated. Switch to correct LTF and spot CIOD. Enter and target 50% of the CLS candle.
For high probability include Dealing Ranges, Weekly Profiles and CLS Timing.
Trading is like a sport. If you consistently practice you can learn it.
“Adapt what is useful. Reject whats useless and add whats is specifically yours.”
David Perk aka Dave FX Hunter
💬 Don't hesitate to ask any questions or share your opinions


Buy on weekly As you look at the weekly , u see last week felt to break below the green support. So I expect it to go up
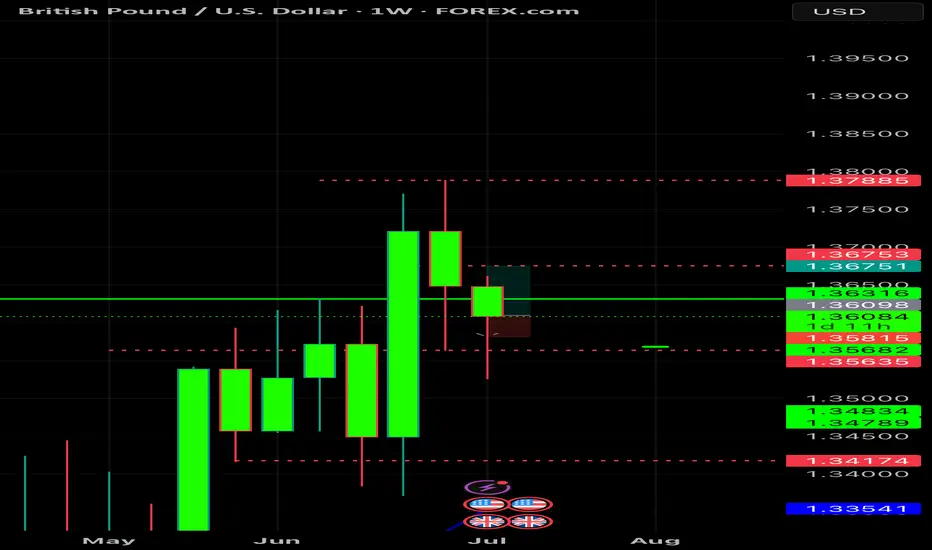
GBPUSD Bullish continuation pattern breakout?The GBPUSD remains in a bullish trend, with recent price action showing signs of a corrective pullback within the broader uptrend.
Support Zone: 1.3544 – a key level from previous consolidation. Price is currently testing or approaching this level.
A bullish rebound from 1.3544 would confirm ongoing upside momentum, with potential targets at:
1.3770 – initial resistance
1.3830 – psychological and structural level
1.3890 – extended resistance on the longer-term chart
Bearish Scenario:
A confirmed break and daily close below 1.3544 would weaken the bullish outlook and suggest deeper downside risk toward:
1.3500 – minor support
1.3440 – stronger support and potential demand zone
Outlook:
Bullish bias remains intact while the FTSE holds above 1.3544. A sustained break below this level could shift momentum to the downside in the short term.
This communication is for informational purposes only and should not be viewed as any form of recommendation as to a particular course of action or as investment advice. It is not intended as an offer or solicitation for the purchase or sale of any financial instrument or as an official confirmation of any transaction. Opinions, estimates and assumptions expressed herein are made as of the date of this communication and are subject to change without notice. This communication has been prepared based upon information, including market prices, data and other information, believed to be reliable; however, Trade Nation does not warrant its completeness or accuracy. All market prices and market data contained in or attached to this communication are indicative and subject to change without notice.
The Day AheadEconomic Data Overview:
United States – Initial Jobless Claims:
This weekly indicator will offer a timely snapshot of US labor market conditions. A rise could signal softening employment dynamics, potentially supporting a dovish bias from the Fed. Conversely, sustained low claims would reaffirm resilience in the jobs market, complicating rate-cut timing.
United Kingdom – June RICS House Price Balance:
This measure of sentiment among surveyors regarding house prices will provide insight into the UK housing market. A negative reading would suggest downward pressure from higher mortgage rates, while stability or improvement may reflect increased buyer demand amid easing inflation.
Japan – June Producer Price Index (PPI):
Key for tracking upstream price pressures. Slowing PPI growth would suggest disinflationary momentum, reducing the urgency for further BoJ tightening. Any upside surprise may reinforce speculation of policy normalization beyond the recent rate hike.
Italy – May Industrial Production:
A barometer of Eurozone manufacturing health. Weak output would highlight the region's ongoing industrial stagnation, potentially reinforcing the ECB’s dovish tilt. Resilience could challenge expectations of sustained easing.
Scandinavia – CPI & GDP Indicators:
Denmark & Norway June CPI:
Will test disinflation progress. Norway, in particular, could see market repricing of Norges Bank's stance if inflation proves stickier than expected.
Sweden May GDP Indicator:
Offers a snapshot of economic momentum. Weakness could justify the Riksbank’s cautious stance despite persistent inflation concerns.
Central Bank Speakers:
Federal Reserve – Musalem and Daly:
Markets will be looking for clarity on rate cut timing. If comments lean dovish, they could reinforce market pricing for a September cut. Any resistance to easing amid still-strong activity data would introduce volatility.
European Central Bank – Cipollone and Villeroy:
Focus will be on signaling around September policy. Villeroy, in particular, is seen as a policy bellwether—any firm commitment to a second rate cut could steepen the EUR yield curve and weigh on the euro. Hawkish caution, however, may reflect concerns about lingering service inflation.
Takeaway:
Thursday’s data and central bank commentary will refine expectations for H2 policy shifts. Jobless claims and CPI prints across Europe remain pivotal for gauging the pace of disinflation, while central bank rhetoric may hint at how aggressively easing cycles might proceed amid mixed economic signals.
This communication is for informational purposes only and should not be viewed as any form of recommendation as to a particular course of action or as investment advice. It is not intended as an offer or solicitation for the purchase or sale of any financial instrument or as an official confirmation of any transaction. Opinions, estimates and assumptions expressed herein are made as of the date of this communication and are subject to change without notice. This communication has been prepared based upon information, including market prices, data and other information, believed to be reliable; however, Trade Nation does not warrant its completeness or accuracy. All market prices and market data contained in or attached to this communication are indicative and subject to change without notice.

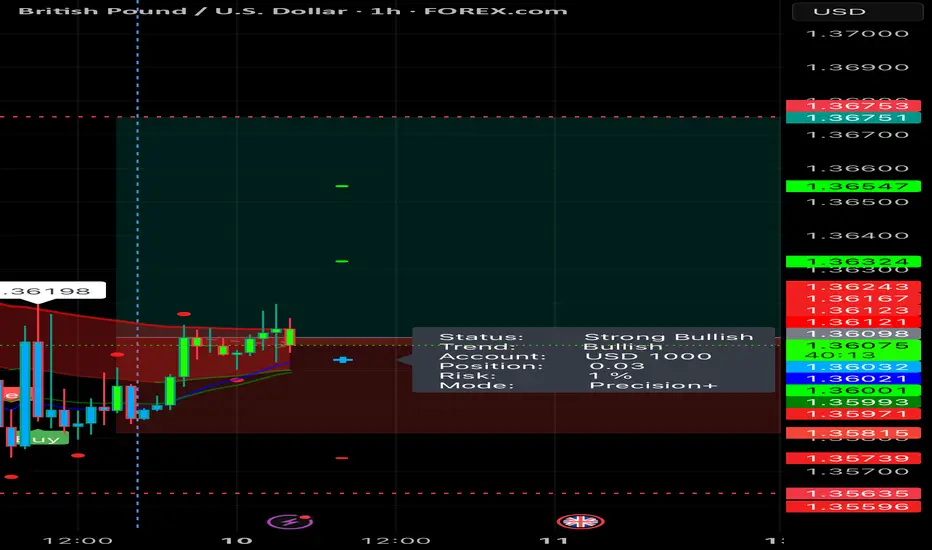
GBPUSD Is Going Up! Buy!
Take a look at our analysis for GBPUSD.
Time Frame: 1h
Current Trend: Bullish
Sentiment: Oversold (based on 7-period RSI)
Forecast: Bullish
The market is on a crucial zone of demand 1.360.
The oversold market condition in a combination with key structure gives us a relatively strong bullish signal with goal 1.364 level.
P.S
The term oversold refers to a condition where an asset has traded lower in price and has the potential for a price bounce.
Overbought refers to market scenarios where the instrument is traded considerably higher than its fair value. Overvaluation is caused by market sentiments when there is positive news.
Disclosure: I am part of Trade Nation's Influencer program and receive a monthly fee for using their TradingView charts in my analysis.
Like and subscribe and comment my ideas if you enjoy them!

Gbpusd long scalp I like current consolidations near equal high depicted with green line.
I want to see a draw towards the equal highs.
This would be simulation trade #7 out of 100

GBPUSD SHORTWe have a break of structure. we waiting for a fair value gap on lower time frame in order to sell to those zone. lets wait and see how it goes

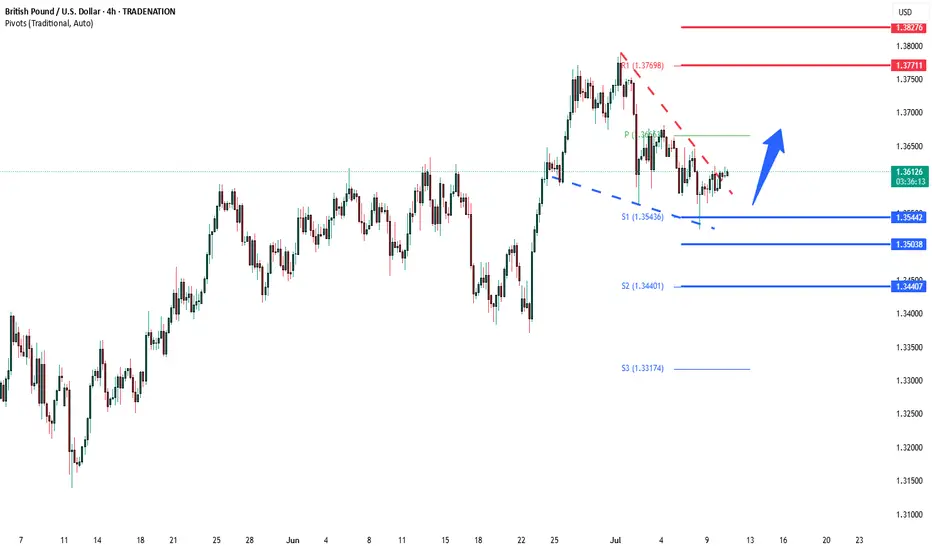
GU-Thu-10/07/25 TDA-GU resuming bullish trend?Analysis done directly on the chart
Follow for more, possible live trades update!
I often share my live trades in Tradingview public chat in London session, stay tuned!
For every trade I take, no matter if it's a loss or win, I always
do post trade analysis. It really helps to understand and
improve. You get to know or try to figure out why price
at this time specifically moved this way or that way.
Premise:
A simple idea plan (like Tradingview public posts) won't describe everything.
No one can predict how market will move, it's always good to react to how it moves.
It gives an idea of how price might move, but no one come from FUTURE.
So I always encourage people to openly and actively discuss in real time.
For example discussing on Tradingview public chat (and more).
I don't give signals blindly, people should learn
and understand the skill.
Following blindly signals you won't know how to
manage the trade, where precisely put sl and tp,
lot size and replicate the move over time.
That's why you need active real time discussions.
Trading is not get rich quick scheme!
Active in London session!
Not financial advice, DYOR.
Market Flow Strategy
Mister Y

GBPUSDThe GBP/USD pair appears strongly bullish based on multiple technical indicators and fundamental considerations. Currently trading at 1.2700, the pair exhibits a robust uptrend, reinforced by the Relative Strength Index (RSI) holding above 45.00, indicating significant buying momentum.
Anticipation of the Bank of England's rate decision further fuels expectations of substantial market movement. Initial targets for the pair lie at 1.2735-1.2760, supported by key resistance levels and technical patterns suggesting further upside potential.
Looking ahead, extended projections suggest the pair could aim for 1.2800 in the near term, with potential extensions towards 1.2870-1.2900. These levels are identified through Fibonacci extensions and historical price action, aligning with current market sentiment and technical analysis.
Traders are advised to monitor any developments in central bank policy, economic data releases, and geopolitical events that could influence the pair's trajectory. Risk management strategies should be carefully implemented to navigate potential volatility associated with high-impact events.

GBPUSD BUILDING TARGET GBP/USD Technical Analysis – 4H Timeframe (July 9, 2025)
This chart shows a technical analysis of the British Pound (GBP) versus the US Dollar (USD) on the 4-hour timeframe. The market is currently trading within a well-defined range, with a strong support zone (highlighted in purple) and a clear resistance level (marked in blue).
Key Levels:
Support Zone: 1.33700 – 1.34400
This zone has been tested multiple times and has acted as a strong demand area, where price has often reversed to the upside.
Current Price: 1.35991
The price is currently above the support zone but showing signs of bearish pressure.
Resistance / Target Point: 1.37921
This level has acted as a strong resistance in the past. If the price reverses from the support zone, this is the likely target point.
Analysis Summary:
The price is expected to drop down toward the support zone around 1.34000.
A bullish reversal is anticipated from this area.
If the reversal happens, the price may rally toward the target level at 1.37921.
Trading Perspective:
Buy Zone: Around 1.34000 (within the purple support box)
Target Zone: Around 1.37921
Suggested Stop-loss: Just below the support zone (e.g., around 1.33500)

Fundamental Market Analysis for July 10, 2025 GBPUSDEvent to watch today:
15:30 EET. USD - Initial Jobless Claims
GBPUSD:
The British pound remains under pressure amid increased risk-off sentiment linked to new White House statements about additional tariffs from August 1. This is boosting demand for the US dollar as a safe haven and prompts investors to take profits on long GBP positions.
Domestic factors in the UK also have a negative impact: revisions to social spending programs and weak manufacturing PMI and retail sales data signal a slowdown in economic activity. The Bank of England is expected to keep the rate at 5.50% until year-end, which limits the pound’s attractiveness for investors.
The current GBP/USD rate is 1.35900. In the absence of positive drivers from the UK economy and persistent demand for the dollar, the pair remains vulnerable to further declines toward 1.3520.
Trade recommendation: SELL 1.36000, SL 1.36300, TP 1.35200

GBPUSD InsightHello to all our subscribers!
Please feel free to share your personal thoughts in the comments. Don’t forget to hit the boost button and subscribe!
Key Points
- U.S. President Trump revealed letters sent via Truth Social to the leaders of seven countries, including the Philippines and Algeria. Notably, he warned of a 50% tariff on imports from Brazil.
- The June FOMC minutes confirmed that key Fed members are divided on the outlook for rate cuts within the year.
- The U.S. 10-year Treasury yield reversed course and fell for the first time in six sessions, following strong demand in the latest bond auction.
Major Economic Events This Week
+ July 10: Germany – June Consumer Price Index (CPI)
+ July 11: United Kingdom – May Gross Domestic Product (GDP)
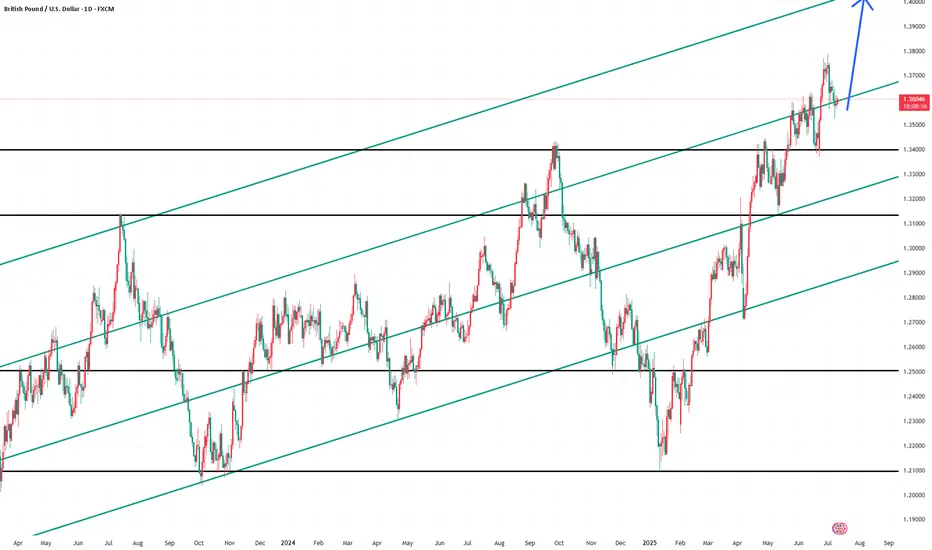
GBPUSD Chart Analysis
While the pair recently faced resistance near the 1.38000 level and experienced a pullback, it appears to be regaining momentum, supported by the trendline near 1.36000.
If this support holds and the price moves as expected, a rally toward the 1.40000 level could be anticipated.
However, if the current support fails, the pair could retreat toward the 1.34000 level. Therefore, it is important to closely monitor the price action in the current zone.
BUYMy analysis tells me that the market is going up. Hit me up on the comments section I want to hear from you.

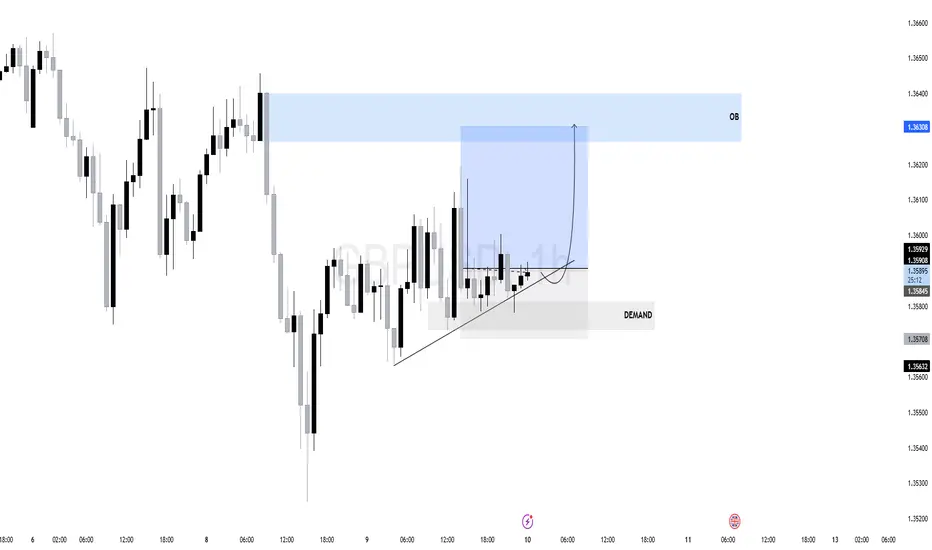
$GU (GBPUSD) 1HPrice has been consolidating after a previous sell-off and is now showing signs of accumulation above a defined demand zone (1.35600–1.35800).
The price has respected the ascending internal trendline, forming higher lows — an early sign of bullish intent.
Strong bullish rejection from this area confirms interest from smart money. Price tested it and immediately rebounded, signaling absorption of sell-side liquidity.
The internal ascending trendline continues to act as dynamic support. As long as price respects this trendline, bullish bias remains intact.
Multiple highs around 1.36300 remain untouched — a magnet for price.That area overlaps with an Order Block (OB), making it a high-probability target for institutional interest.
The tight consolidation before the expansion (highlighted in blue) suggests price is loading for a sharp move.
As long as price remains above the demand zone and trendline A bullish expansion toward the OB zone (1.36300–1.36400) Or A potential liquidity sweep above the highs, aligning with external liquidity targets.
SHORT GBPUSDshorting gbpusd after the short term long into the higher tf poi and waiting for confirmation to short

GBPUSD-4H BUYUptrend in the weekly , break resistant with strong momentum Candle. Divergency is showing and It test the Support and now ready to go up with the main trend.

Bearish drop for the Cable?The price is rising towards the pivot and could drop to the 1st support which is a pullback support.
Pivot: 1.3632
1st Support: 1.3503
1st Resistance: 1.3693
Risk Warning:
Trading Forex and CFDs carries a high level of risk to your capital and you should only trade with money you can afford to lose. Trading Forex and CFDs may not be suitable for all investors, so please ensure that you fully understand the risks involved and seek independent advice if necessary.
Disclaimer:
The above opinions given constitute general market commentary, and do not constitute the opinion or advice of IC Markets or any form of personal or investment advice.
Any opinions, news, research, analyses, prices, other information, or links to third-party sites contained on this website are provided on an "as-is" basis, are intended only to be informative, is not an advice nor a recommendation, nor research, or a record of our trading prices, or an offer of, or solicitation for a transaction in any financial instrument and thus should not be treated as such. The information provided does not involve any specific investment objectives, financial situation and needs of any specific person who may receive it. Please be aware, that past performance is not a reliable indicator of future performance and/or results. Past Performance or Forward-looking scenarios based upon the reasonable beliefs of the third-party provider are not a guarantee of future performance. Actual results may differ materially from those anticipated in forward-looking or past performance statements. IC Markets makes no representation or warranty and assumes no liability as to the accuracy or completeness of the information provided, nor any loss arising from any investment based on a recommendation, forecast or any information supplied by any third-party.

short for gbpusdLooking at the daily time frame for gbpusd, I am bearish and belive we will attack that sellside this week or next week. Lets break this down.1st PDAY array- We have a breaker that is failing to hold price, we could see that breaker act an an inversion. The second PD array that is failing is that discount daily fvg, we are hovering on it, but it has provided no bounce, indicating weakness. DXY also looks solid, and out of eurusd pr gbpusd, pound is the one to be shorting right now. If you look at the eurgbp chart, eur has been stronger that gbp.

GBPUSDPrice reached a major weekly resistance and started selling with the daily giving a strong bearish engulfing last week. H4 formed a double top and started creating lower highs. H1 has formed a third bearish wedge. Waiting for clear breakout to look for shorts. Watch out for fundamentals this week.

GBPUSD BUY and SELL LIQUIDITY SETUP GBPUSD : A sweep of this liquidity below will open our Buy entry at $1.35702 with SL at $1.35496 and TP at $1.36576.
Watching for a Sell after Buy trade hits TP.
#GBPUSD
