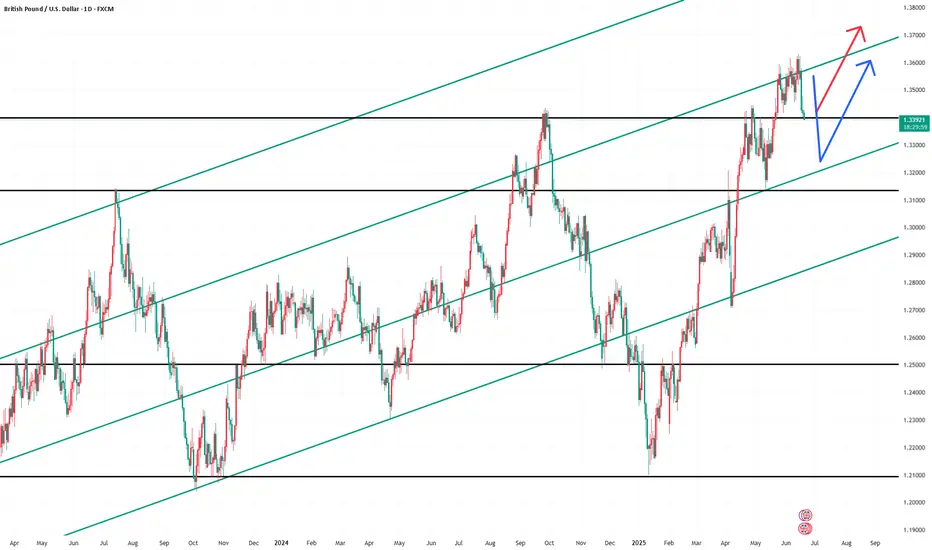
GBPUSD Bullish continuation pattern supported at 1.3380The GBPUSD currency pair maintains a bullish price action structure, supported by the ongoing rising trend. Current intraday movement appears to be a corrective pullback within a consolidation phase, potentially offering a buying opportunity within the broader uptrend.
Key Technical Levels:
Support (Key Trading Level): 1.3380 (prior consolidation zone)
Additional Support: 1.3340 and 1.3300
Upside Resistance Targets:
1.3480
1.3550
1.3600 (longer-term target)
Bullish Scenario:
A bounce from the 1.3380 support would confirm the continuation of the bullish trend. Sustained upside momentum could then target 1.3480, with further extensions toward 1.3550 and 1.3600 over the medium term.
Bearish Alternative:
A confirmed daily close below 1.3380 would invalidate the bullish outlook and suggest deeper downside retracement. In that case, the next support levels to monitor would be 1.3340 and 1.3300.
Conclusion:
The bias remains bullish while GBPUSD holds above 1.3380. A rebound from this level supports long positions toward higher resistance zones. However, a break and close below 1.3380 would shift the outlook to neutral-to-bearish, favouring further downside correction. Traders should watch price action around 1.3380 for directional confirmation.
This communication is for informational purposes only and should not be viewed as any form of recommendation as to a particular course of action or as investment advice. It is not intended as an offer or solicitation for the purchase or sale of any financial instrument or as an official confirmation of any transaction. Opinions, estimates and assumptions expressed herein are made as of the date of this communication and are subject to change without notice. This communication has been prepared based upon information, including market prices, data and other information, believed to be reliable; however, Trade Nation does not warrant its completeness or accuracy. All market prices and market data contained in or attached to this communication are indicative and subject to change without notice.
GBPUSD trade ideas

GBPUSD Following Upward TrendGBP/USD remains subdued for the third consecutive session, trading around 1.3410 during the Asian hours on Thursday. The pair faces challenges as the US Dollar gains ground amid increased safe-haven demand, driven by escalating tensions between Israel and Iran

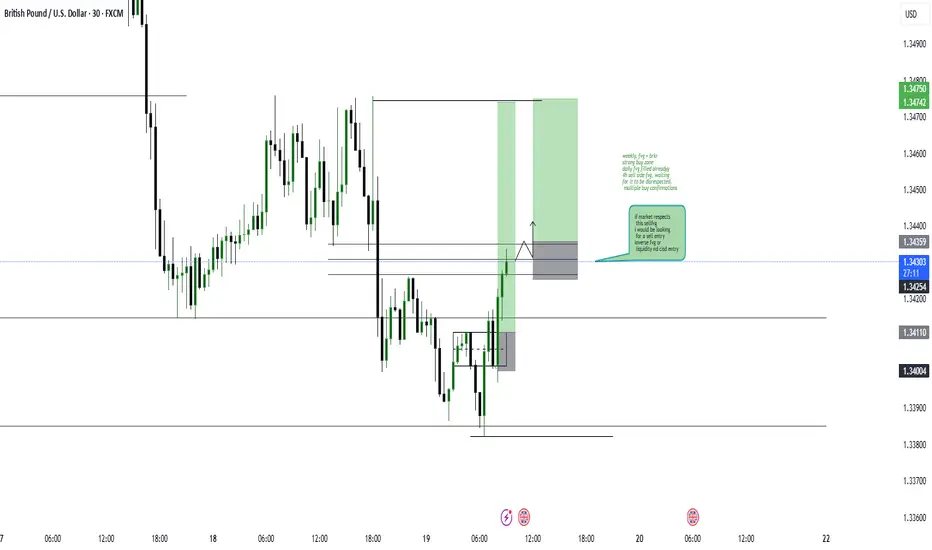
Bullish on GBPUSDNew York midnight opening Price took out higher sell side liquidity and gave way to a market structure shift to the upside leaving a 30m fair value gap. Took the median of the fair value gap and targeting the median of the range.

GBPUSD PROJECTIONmultiple confluences lead to this trade being taken, 1st entry 1:5 2nd entry 1:3.5
feel free to jump on this . replicate my parameteres
GBP-USD Swing Long! Buy!
Hello,Traders!
GBP-USD is trading in an
Uptrend along the strong
Long-term rising support
So after the pair falls down
To retest the rising support
We will be expecting a
Bullish rebound and a move up
Buy!
Comment and subscribe to help us grow!
Check out other forecasts below too!
Disclosure: I am part of Trade Nation's Influencer program and receive a monthly fee for using their TradingView charts in my analysis.

GBPUSD SHORTThe GBP/USD pair has been showing signs of exhaustion after a recent rally, and I'm looking for a potential pullback to enter a short position.
While GBP/USD has shown resilience, the technical and fundamental setup suggests a potential short opportunity on a pullback. Confirmation through price action (e.g., bearish engulfing patterns, break of structure) will be crucial before entering.
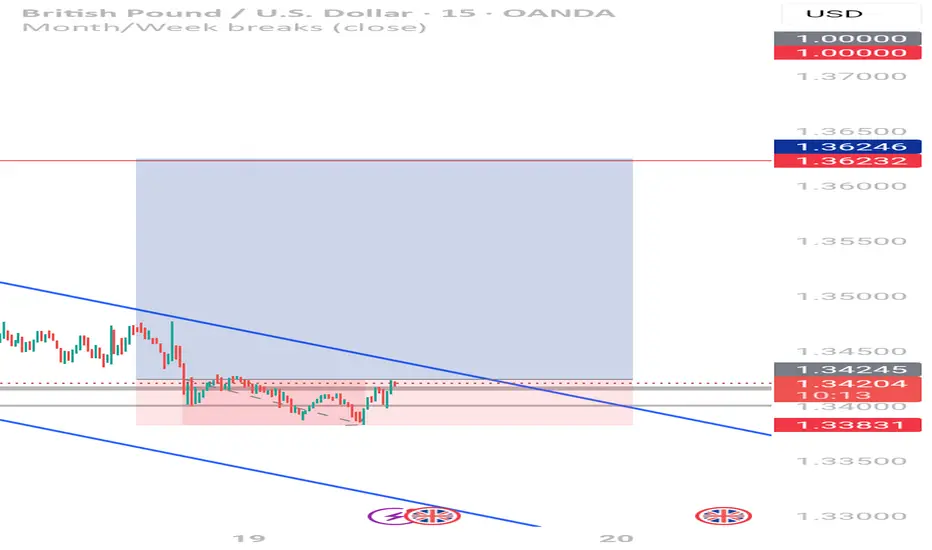
GBP/USD Buy Setup – SMC Break of Structure + Demand Zone RetestGBP/USD – Buy Signal Alert 🚀
📈 Trade Idea:
Pair: GBP/USD
Direction: Buy
Entry: 1.34245
Stop Loss: 1.33831
Take Profit: 1.36246
🔍 Analysis Summary:
Price has reacted strongly at a key demand zone, forming bullish confirmation on lower timeframes. The market structure supports a continuation to the upside, targeting the next major resistance area.
📌 Confirmation:
Break of structure + Retest of demand zone + Bullish candlestick confirmation
📊 Strategy Style:
Smart Money Concepts (SMC)
4H Structure | 15M Entry Confirmation
🕒 Use proper risk management.
✅ For educational purposes only – not financial advice.
#GBPUSD #BuySignal #ForexAnalysis #SmartMoneyConcepts #TradingViewIdeas #KellyWiseFX
BoE in Focus as GBP/USD Nears 1.3410GBP/USD remains under pressure for a third day, trading near 1.3410 in Thursday’s Asian session, as safe-haven demand strengthens the US Dollar amid Israel-Iran tensions. The BoE is expected to hold rates at 4.25% today. UK inflation eased to 3.4% in May from 3.5%, in line with forecasts but still above the 2% target. Markets still price in about 48 basis points of BoE cuts by year-end.
Resistance is seen at 1.3440, while support holds at 1.3260.
GBPUSD Trade IdeaSo basically why i am taking this trade is because Gu has been in a bearish trend for some days now and i got a nice break and retest zone right there that is backed up with the 4hours FVG

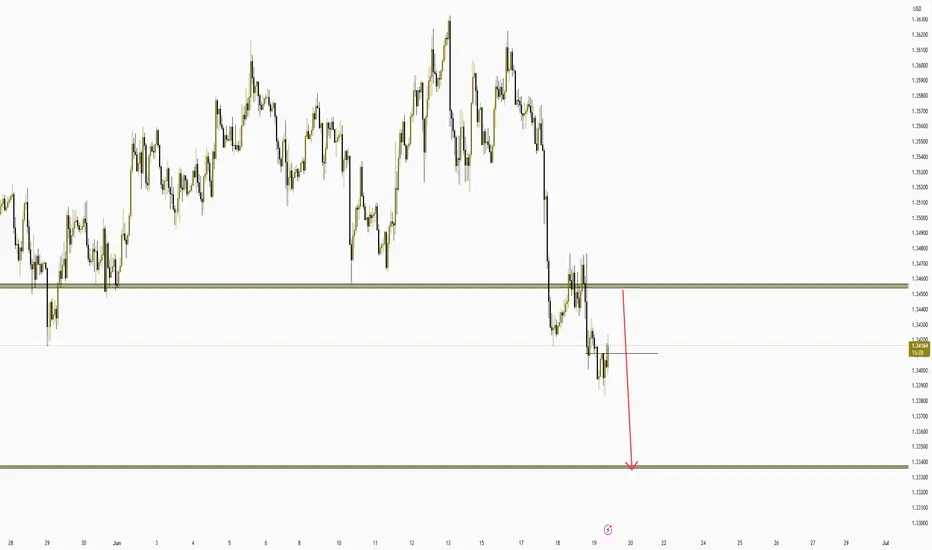
GBPUSD IS LOOKING WEAK FOR A HARD SELL OFF SWING TRADEOANDA:GBPUSD Has broken the bullish swing low on 4 Hour time frame with strong sell off bearish candles leaving behind a big bearish imbalances in price. Which extra confirm that price is extremely bearish on 4 Hour time frame.
Now that trend has shifted from bullish trend to a bearish one, am now bearish on GBPUSD.
Bearish shift in market structure that happened on OANDA:EURUSD EURUSD which is a correlating pair with GBPUSD extra confirm this bearish bias on GBPUSD.
likewise also, the Bullish Shift in Market Structure on OANDA:USDCAD USDCAD, which is an opposite correlating pair confirm this sell on GBPUSD.
So, my focus now is selling GBPUSD in every pullback or retest of key bearish levels.
I will update you as the trade develop.

Lingrid | GBPUSD potential Long from the Support ZoneThe price perfectly fulfilled my previous idea . FX:GBPUSD SPREADEX:GBP has bounced off confluence support near 1.3395 where the upward trendline and horizontal structure intersect. A minor range formed after the recent corrective drop, hinting at possible accumulation. A breakout above the range and reclaiming 1.3450 would shift momentum back toward the 1.3537 resistance.
📈 Key Levels
Buy zone: 1.3390–1.3410
Sell trigger: breakdown below 1.3390
Target: 1.35375
Buy trigger: bullish breakout from current consolidation
💡 Risks
Failure to hold above the rising trendline could shift the trend short-term bearish
GBP remains sensitive to macroeconomic news—any surprises could disrupt this setup
Range failure and low volume may delay the expected move upward
Traders, if you liked this idea or if you have your own opinion about it, write in the comments. I will be glad 👩💻

GU-Thu-19/06/25 TDA-Fed rate unchanged, now BoE rate decisionAnalysis done directly on the chart
Follow for more, possible live trades update!
Few beneficial things by posting public ideas
1) I improve a lot by doing this every single day
2) People can benefit from my analysis
3) Everyone can still trade their own style and
Strategy and having general idea on htf.
4) Taking myself accountable and be consistent in what I do
5) I can watch and rewatch as many times I
Want and learn more and more
Active in London session!
Not financial advice, DYOR.
Market Flow Strategy
Mister Y

GBPUSDGBPUSD giving us a sellers entry on bigger timeframe, this analysis is to spot the entry for that sell which based on the Trendline approach, the support has been broken out of and may have been retested, however due to the RSI Divergence I found on 5min TF, Im still hoping a few buyers can reap here before the sellers dive in. Note the current area is also a strong historic S/R Flip zone as from April 2025. Amen.

GBPUSD waterfalleverything should be clear in charts that this gonna slide down like rock falling from mountain
GL TRADERS
NOT ADVICE !!

Fundamental Market Analysis for June 19, 2025 GBPUSDEvent to pay attention to today:
14:00 EET. GBP - Bank of England base rate decision
GBPUSD:
GBP/USD remains down for the third consecutive session, trading around 1.34100 in Asian trading on Thursday. The pair is struggling as the US dollar (USD) strengthens amid rising demand for safe-haven assets triggered by escalating tensions between Israel and Iran. In addition, the Bank of England (BoE) is widely expected to leave interest rates unchanged on Thursday.
In the UK, consumer price index inflation fell to 3.4% year-on-year in May, as expected, from 3.5% in April. However, this figure is still well above the BoE's target of 2%. Nevertheless, markets still expect rates to fall by around 48 basis points by the end of the year.
Bloomberg reported on Thursday that ‘US officials are preparing for a possible strike on Iran in the coming days.’ ‘US plans to attack Iran continue to evolve.’ Another Wall Street Journal report suggests that US President Trump approved plans to attack Iran on Tuesday but wanted to see if Tehran would abandon its nuclear programme.
In addition, the dollar was supported by comments from Federal Reserve Chairman Jerome Powell, who said that inflation remains slightly above target and may rise in the future, citing the impact of US President Donald Trump's tariffs.
The US Federal Reserve (Fed) decided at its June meeting on Wednesday, as expected, to leave the base rate unchanged in the range of 4.25-4.50%. The Federal Open Market Committee (FOMC) still forecasts interest rates to fall by about 50 basis points by the end of 2025.
Trading recommendation: SELL 1.34100, SL 1.34300, TP 1.33200

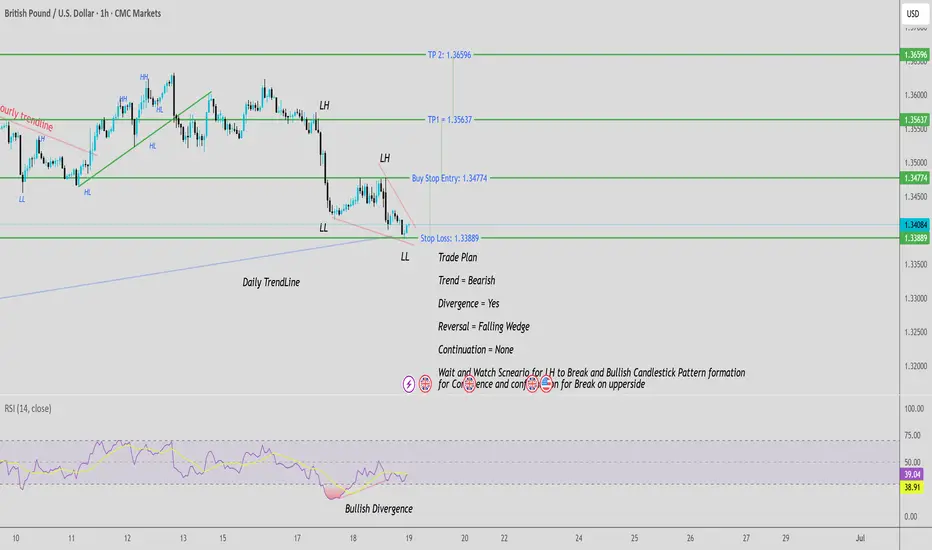
GBPUSD is forming a Potential Bullish Reversal pattern
Price formed a Potential Falling Wedge pattern with a waiting for break of LH as current Temporary Resistance.
• ✅ Entry is triggered only after a confirmation candle breaks above the LH.
• Buy Stop is placed to catch the momentum move.
• Stop Loss is at the recent lower Low (safe and logical placement).
• 🎯 Take Profit levels are based on measured move projections.
Trade Plan:
• Buy Stop = 1.34774
• Stop Loss = 1.33889
• Take Profit 1: 1.35637
• Take Profit 2: 1.36596
• Lot size : 1:2 Risk Reward Ratio
“Waiting for Lower High to break with Bullish confirmation candle” – this ensures you enter only on strong momentum.
GBPUSD is forming a Potential Bullish Reversal pattern with clear structure. A break of the neckline confirms the setup
Key Highlights:
• ✅ Pattern: Falling Wedge
• ⚠️ Confirmation: Break + Bullish candle
• 🔄 Risk Management: Tight SL, 2 TP levels
• 🧩 Confluence: Trendline Bounce + structure shift + RSI Divergence
GBPUSD 15M CHART PATTERNHere's a structured summary of your GBP/USD trading signal:
---
📈 Trade Signal: GBP/USD – LONG (Buy)
Entry (Buy): 1.34000
Take Profit 1: 1.34400
Take Profit 2: 1.34800
Take Profit 3: 1.35230
Stop Loss: 1.33500
---
🧮 Risk-Reward Overview (per Take Profit level)
TP Level Reward (pips) Risk (pips) R:R Ratio
TP1 40 50 0.80
TP2 80 50 1.60
TP3 123 50 2.46
---
✅ You’re targeting multiple profit levels with a relatively tight stop loss.
⚠ R:R ratio improves as you aim for higher TPs. Make sure to trail your stop or scale out along the way.
Would you like me to generate a chart or risk management table for different lot sizes?

GBP/USD - For FOMC & Fed Interest RateThe GBP/USD pair on the M30 timeframe presents a Potential Buying Opportunity due to a recent Formation of a Channel Pattern. This suggests a shift in momentum towards the upside and a higher likelihood of further advances in the coming hours.
Possible Long Trade:
Entry: Consider Entering A Long Position around Trendline Of The Pattern.
Target Levels:
1st Resistance – 1.3567
2nd Resistance – 1.3682
🎁 Please hit the like button and
🎁 Leave a comment to support for My Post !
Your likes and comments are incredibly motivating and will encourage me to share more analysis with you.
Best Regards, KABHI_TA_TRADING
Thank you.
Disclosure: I am part of Trade Nation's Influencer program and receive a monthly fee for using their TradingView charts in my analysis.

GBPUSD H4 I Bullish RiseBased on the H4 chart analysis, we can see that the price is trading near our buy entry at1.3373 -1.13396, which is a pullback support that aligns with the 50% Fib retracement.
Our take profit will be at 1.3466, which is an overlap resistance
The stop loss will be placed at 1.3320 which is a pullback support below the 61.8% Fib retracement.
High Risk Investment Warning
Trading Forex/CFDs on margin carries a high level of risk and may not be suitable for all investors. Leverage can work against you.
Stratos Markets Limited (tradu.com ):
CFDs are complex instruments and come with a high risk of losing money rapidly due to leverage. 63% of retail investor accounts lose money when trading CFDs with this provider. You should consider whether you understand how CFDs work and whether you can afford to take the high risk of losing your money.
Stratos Europe Ltd (tradu.com ):
CFDs are complex instruments and come with a high risk of losing money rapidly due to leverage. 63% of retail investor accounts lose money when trading CFDs with this provider. You should consider whether you understand how CFDs work and whether you can afford to take the high risk of losing your money.
Stratos Global LLC (tradu.com ):
Losses can exceed deposits.
Please be advised that the information presented on TradingView is provided to Tradu (‘Company’, ‘we’) by a third-party provider (‘TFA Global Pte Ltd’). Please be reminded that you are solely responsible for the trading decisions on your account. There is a very high degree of risk involved in trading. Any information and/or content is intended entirely for research, educational and informational purposes only and does not constitute investment or consultation advice or investment strategy. The information is not tailored to the investment needs of any specific person and therefore does not involve a consideration of any of the investment objectives, financial situation or needs of any viewer that may receive it. Kindly also note that past performance is not a reliable indicator of future results. Actual results may differ materially from those anticipated in forward-looking or past performance statements. We assume no liability as to the accuracy or completeness of any of the information and/or content provided herein and the Company cannot be held responsible for any omission, mistake nor for any loss or damage including without limitation to any loss of profit which may arise from reliance on any information supplied by TFA Global Pte Ltd.
The speaker(s) is neither an employee, agent nor representative of Tradu and is therefore acting independently. The opinions given are their own, constitute general market commentary, and do not constitute the opinion or advice of Tradu or any form of personal or investment advice. Tradu neither endorses nor guarantees offerings of third-party speakers, nor is Tradu responsible for the content, veracity or opinions of third-party speakers, presenters or participants.

GBPUSD InsightHello to all our subscribers,
Please feel free to share your personal opinions in the comments. We would appreciate your support through likes and subscriptions.
Key Points
- At the June FOMC meeting, the Federal Reserve revised its 2024 U.S. economic growth forecast down from 1.7% to 1.4%. It held the benchmark interest rate steady at 4.25–4.50%. The dot plot shows a divergence in opinions among Fed officials, but the median projection suggests two rate cuts within the year.
- Fed Chair Jerome Powell reaffirmed the stance that the current interest rate level will be maintained while observing the impact of tariffs more clearly.
- U.S. President Donald Trump, speaking to reporters at the White House, said it’s “not too late” if Iran wants to return to negotiations. Regarding potential military action against Iran, he stated, “We may or may not do it,” keeping the option open.
Key Economic Event This Week
+ June 19: Bank of England (BOE) interest rate decision
GBPUSD Chart Analysis
The pair has pulled back after facing resistance from the trendline. It has now reached the 1.34000 support level—a zone where a major trend reversal occurred previously—so a bullish reversal could be expected here. However, if this support breaks, the decline could extend toward the 1.32500 level. We recommend closely monitoring the movement around this area.
Predictive Technical Analysis on GBPUSDPredictive technical analysis on GBPUSD from January 2025 to date. A very insightful technical analysis covering both higher and lower timeframes, pinpointing bearish and bullish price bounces on a trend line structure.

GBPUSD I Technical & Fundamental Forecast Welcome back! Let me know your thoughts in the comments!
** GB{USD Analysis - Listen to video!
We recommend that you keep this pair on your watchlist and enter when the entry criteria of your strategy is met.
Please support this idea with a LIKE and COMMENT if you find it useful and Click "Follow" on our profile if you'd like these trade ideas delivered straight to your email in the future.
Thanks for your continued support!Welcome back! Let me know your thoughts in the comments!

GBPUSD (swing)hello everyone, the price has reached major resistance on weekly tf, the price started of bearish with DXY being strong... this is a swing idea, you have to use smaller tf to get as high as possible to trade with proper risk management, price in past usually reversed from the trendline resistance, it's still in uptrend but price will likely go in correction if dxy goes bullish.. good luck
