SELL GBPUSD🚨 Trade Alert 🚨
📉 SELL GBPUSD NOW!
🔻 Market hitting key resistance level – expect bearish momentum.
🎯 Target: | 🛑 Stop Loss:
💹 Risk management is key – stay sharp!
GBPUSD trade ideas
GBPUSD 15/3 Sell1-hr and 15 are all bear. And it is in a sell zone. Will need to drop down to 3-min to confirm market shift in order to sell to the demand zone.

GBPUSD: Market of Sellers
The analysis of the GBPUSD chart clearly shows us that the pair is finally about to tank due to the rising pressure from the sellers.
Disclosure: I am part of Trade Nation's Influencer program and receive a monthly fee for using their TradingView charts in my analysis.
❤️ Please, support our work with like & comment! ❤️

GBP/USD Rebounds Inside Channel – Long Opportunity in MotionHi traders! Analyzing GBP/USD on the 30-minute timeframe, price is currently respecting a descending channel, showing signs of a bullish bounce after retesting lower support.
🔹 Entry: 1.3586
🔹 Take Profit (TP): 1.3618
🔹 Stop Loss (SL): 1.3555
Price is attempting to recover after holding at the bottom of the channel, and is now pushing toward the 20 EMA. If momentum builds, a retest of the upper trendline and the 1.3618 zone is likely. RSI is slightly recovering from neutral levels, adding confluence to this rebound setup.
This long trade offers a solid risk-to-reward ratio within a possible short-term counter-trend move. Watch closely as price approaches dynamic resistance.
⚠️ DISCLAIMER: This is not financial advice. Every trader is responsible for their own decisions and risk management.

GBP/USD Short Idea Analysis : GBP/USD is approaching a critical resistance zone between 1.37850 and 1.38800 on the daily timeframe, presenting a potential short opportunity based on technical and fundamental factors.
Technical Analysis:
Price Action: The 1.37850–1.38800 zone aligns with prior highs and a strong resistance area, likely to trigger rejection or a bearish reversal pattern (e.g., double top or bearish engulfing).
Support/Target: Initial support at 1.3700, with a deeper target at 1.3600 if bearish momentum builds.
Indicators: RSI is approaching overbought territory (near 70), signaling potential exhaustion. MACD shows slowing bullish momentum, supporting a short bias.
Fibonacci: The 1.37850–1.38800 zone coincides with the 76.4%–88.6% Fibonacci retracement of the prior downmove, reinforcing resistance.
Fundamental Context:
UK economic data (e.g., weaker retail sales or PMI) suggests GBP vulnerability. Meanwhile, USD strength is bolstered by hawkish Fed expectations and resilient US economic indicators.
Risks: A breakout above 1.3900 could invalidate the setup. Monitor BoE rhetoric and US data releases for sudden shifts.
Conclusion: The 1.37850–1.38800 resistance zone offers a high-probability short setup for GBP/USD, supported by technical resistance and USD-favorable fundamentals. Use strict risk management due to potential volatility.

GBPUSD TECHNICAL & ORDER FLOW ANALYSISOur analysis is based on a multi-timeframe top-down approach and fundamental analysis.
Based on our assessment, the price is expected to return to the monthly level.
DISCLAIMER: This analysis may change at any time without notice and is solely intended to assist traders in making independent investment decisions. Please note that this is a prediction, and I have no obligation to act on it, nor should you.
Please support our analysis with a boost or comment!

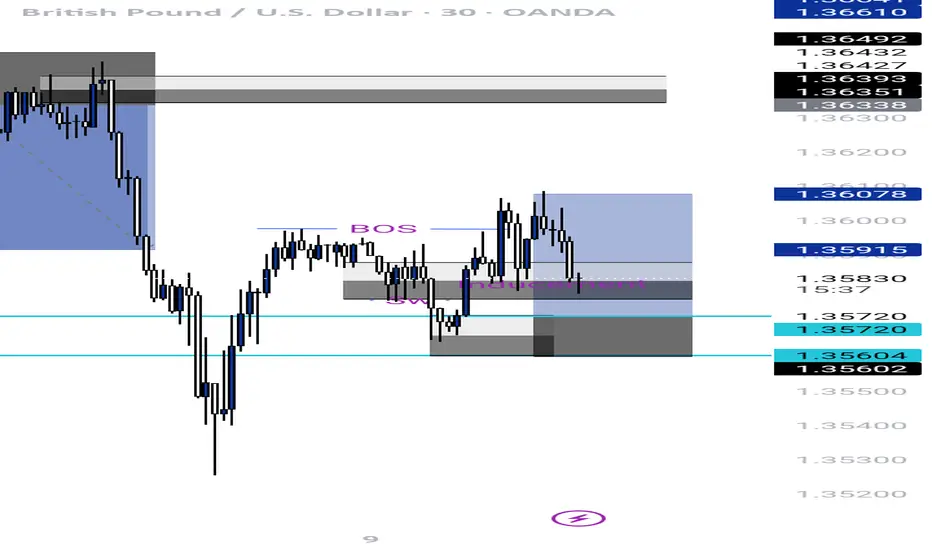
GBPUSD buy setup From my strategy system, the point I mark as my entry,is an order block poi,
From the sence that , price has swept liquidity, and bos and an inducement, so I look to enter from the order block, because the liquidity and the inducement has been mitigated so price next target is to sweep the order block then reverse. Let's go, risk management involved please, just my opinion I am sharing
Passing through alot on GBPUSD since yesterday i don really know if my psychology is playing pranks on me .or are we in a choppy market? ...i have been working the market to dance to my tune lol ...but this pair keeps doing what it wants ... holding trade for hours in blues for price to reverse and hit SL or BE ....wtf

GBPUSD: Bullish Move After Liquidity Grab 🇬🇧🇺🇸
GBPUSD formed a bullish high range candle with a long lower wick going
below a key horizontal demand zone on a 4H.
A consequent recovery and a bullish London session opening suggest
a highly probable rise today.
Goal - 1.363
❤️Please, support my work with like, thank you!❤️
I am part of Trade Nation's Influencer program and receive a monthly fee for using their TradingView charts in my analysis.

check the trendIt is expected that a trend change will form within the current support range and we will witness the start of an upward trend.
If the price breaks through the support range, a continuation of the downward trend will be likely.
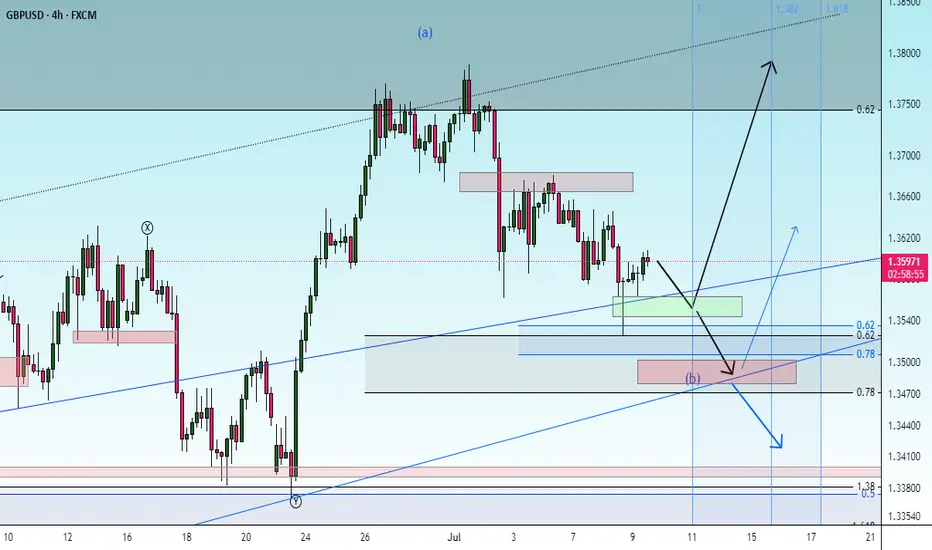
GBPUSD - Macro Trend Continues!Hello TradingView Family / Fellow Traders. This is Richard, also known as theSignalyst.
📈GBPUSD has been overall bullish trading within the rising channel marked in red. And it is currently retesting the lower bound of the channel.
Moreover, the green zone is a strong structure.
🏹 Thus, the highlighted blue circle is a strong area to look for buy setups as it is the intersection of the lower red trendline and structure.
📚 As per my trading style:
As #GBPUSD approaches the blue circle zone, I will be looking for bullish reversal setups (like a double bottom pattern, trendline break , and so on...)
📚 Always follow your trading plan regarding entry, risk management, and trade management.
Good luck!
All Strategies Are Good; If Managed Properly!
~Rich
Disclosure: I am part of Trade Nation's Influencer program and receive a monthly fee for using their TradingView charts in my analysis.

SELL CONTINUATION Price has broken structure twice to the downside creating a protected high at the lower high( below 1.36600). Also price has created a nice looking order block, inducement that closed above a high! Further confirmation tells us that price is also now at the premium level of the swing leg, suggesting a good short set up. Now we wait for price to tap into the order block, a good change of character on the lower time frame will give a nice sell action to the external low!
TRADE CAREFULLY AND RISK WISELY


09.07.25 Morning ForecastPairs on Watch -
FX:GBPUSD
FX:EURAUD
OANDA:JP225USD
FX:USDCAD
A short overview of the instruments I am looking at for today, multi-timeframe analysis down to what I will be looking at for an entry. Enjoy!

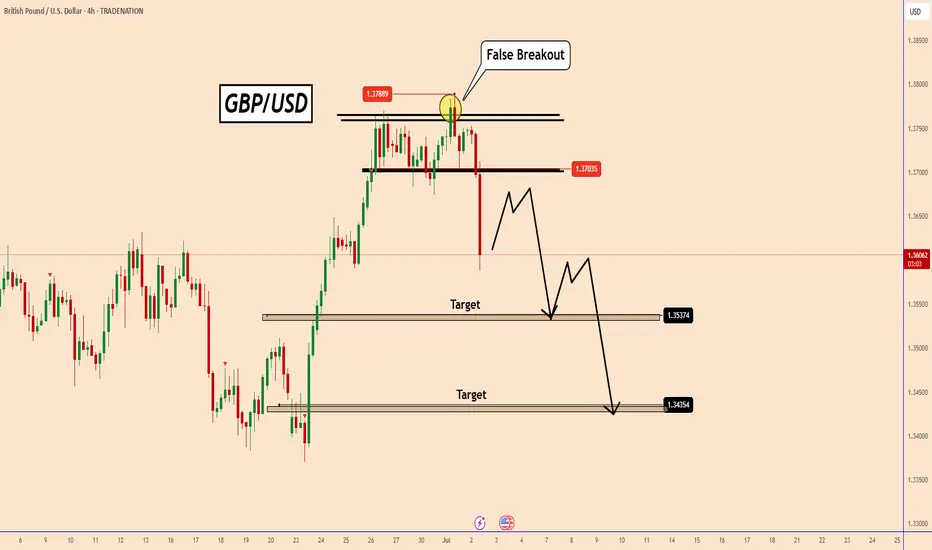
GBPUSD: Profit taking or a downward move?GBPUSD: Profit taking or a downward move?
Yesterday, GBPUSD reached a new high of 1.3788, last seen in February 2022.
From the chart it can be clearly seen that GBPUSD only created a false breakout to the upside.
Market participants expected USD to weaken, but it changed direction again and locked in many long positions.
Despite the ADP data today being a real dud from expectations of 95k to -33k, we can see that GBPUSD did not stop the decline.
I think this could be related to the FED and if they think that maybe this is the time to change Interest Rates at the July meeting. It could also be a liquidity release and it could rise again, but we cannot prove this yet with the current pattern.
Technical Analysis:
As long as the price stays below 1.3680 or below this small structure, the price could fall further.
Don't forget that tomorrow we also have NFP data and the US market will be preparing for a long weekend. The 4-hour candle is strong and bearish, so let's see.
You may find more details in the chart!
Thank you and Good Luck!
PS: Please support with a like or comment if you find this analysis useful for your trading day
Disclosure: I am part of Trade Nation's Influencer program and receive a monthly fee for using their TradingView charts in my analysis.
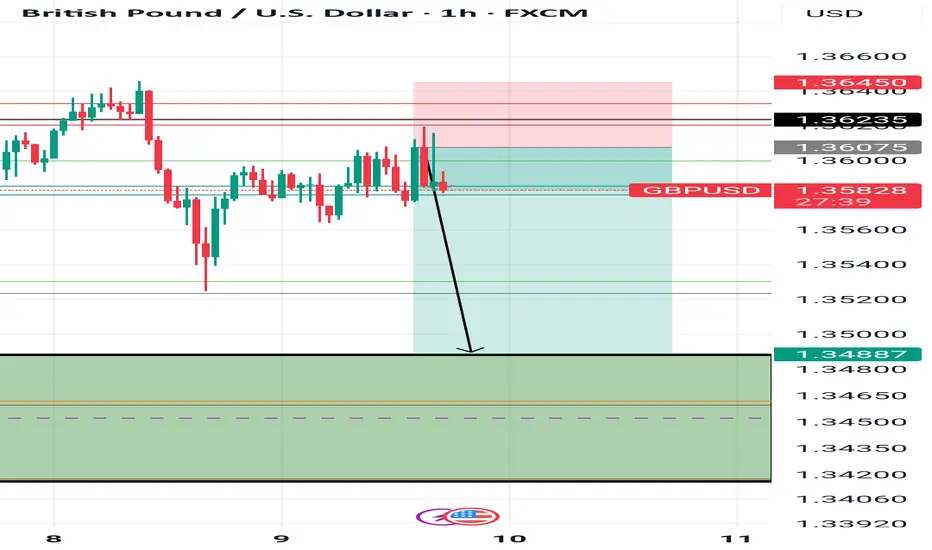
GBPUSD Forecast – Clean Supply Rejection, Eyes on Next Liquidit📉 GBPUSD Forecast – Clean Supply Rejection, Eyes on Next Liquidity Level (1.35130)
Price rejected perfectly from our 1.36349–1.36481 supply zone, showing clear bearish intent. Now all eyes are on the next major liquidity pool.
🟥 Supply Zone: 1.36349–1.36481
📍 Target: 1.35130 – Marked liquidity level
🔍 This is the power of zone + structure confluence — no indicators, just precision levels.
💡 Mark → Wait → Execute
That’s the FXFOREVER approach.
#FXFOREVER #GBPUSD #ForexForecast #SmartMoneyZones #SupplyAndDemand #PriceAction #ForexTrading
