Good looking little cypher setup… Cypher pattern in the pound . Ending 12920-12940. Let’s see if we can grind her lower. Good start to the week
GBPUSD trade ideas

GBP/USD Bullish Reversal 4H|Inverse Head & Shoulders Breakout GBP/USD is showing a clear inverse Head & Shoulders pattern on the 4H timeframe, signaling a potential bullish reversal from the 1.3140 support zone (weak low).
✅ Left Shoulder: Formed mid-June
✅ Head: Created end of June with strong bullish momentum from bottom
✅ Right Shoulder: Confirmed with rejection near demand zone
🔁 Demand Zone Support: 1.3300 – 1.3370
🛡️ Support Level: 1.3142
🚀 Breakout Target: Confirmation above 1.3370 resistance opens the path to bullish targets.
🎯 Bullish Targets:
1st Target: 1.33720 (Demand Zone Breakout)
2nd Target: 1.35008 (Key Resistance)
3rd Target: 1.36000 (Strong High Zone)
📝 Note: Wait for candle confirmation above 1.3370 to enter long. Price structure and momentum favor bullish continuation.

GBPUSD Potential UpsidesHey Traders, in today's trading session we are monitoring GBPUSD for a buying opportunity around 1.33900 zone, GBPUSD is trading in an uptrend and currently is in a correction phase in which it is approaching the trend at 1.33900 support and resistance area.
Trade safe, Joe.

GBPUSD – DAILY FORECAST Q3 | W32 | D8 | Y25📊 GBPUSD – DAILY FORECAST
Q3 | W32 | D8 | Y25
Daily Forecast 🔍📅
Here’s a short diagnosis of the current chart setup 🧠📈
Higher time frame order blocks have been identified — these are our patient points of interest 🎯🧭.
It’s crucial to wait for a confirmed break of structure 🧱✅ before forming a directional bias.
This keeps us disciplined and aligned with what price action is truly telling us.
📈 Risk Management Protocols
🔑 Core principles:
Max 1% risk per trade
Only execute at pre-identified levels
Use alerts, not emotion
Stick to your RR plan — minimum 1:2
🧠 You’re not paid for how many trades you take, you’re paid for how well you manage risk.
🧠 Weekly FRGNT Insight
"Trade what the market gives, not what your ego wants."
Stay mechanical. Stay focused. Let the probabilities work.
FX:GBPUSD

$GBPUSD at resistance?STICing it to the chat, but sometime i'd wanna take early entry. Bases on regression S&R, GBP should continue downthrnd following a previous H&S an da retest of resistance.
IF resistance break hwever, we migth see a flip, but not holding my short for the week. Fingercrossed
took early On M15 but it about time to TP.
#Tradesmartly #STIC Algo

GBPUSD long position 07/08/2025English : According to our analysis, we anticipate a bullish scenario.
Morocan Darija : kanchofo d'apres l'analyse dyalna antsanaw tloo3
ATENTION : I only share my ideas, not signals

Sell gbpusdOur last selling idea already running 500+ pips in selling
More drop expected as USD gonna stronger all cross pairs
Daily support already breaks and also breaks the lower higher low

GBPUSD – DAILY FORECAST Q3 | W33 | D11 | Y25📊 GBPUSD – DAILY FORECAST
Q3 | W33 | D11 | Y25
Daily Forecast 🔍📅
Here’s a short diagnosis of the current chart setup 🧠📈
Higher time frame order blocks have been identified — these are our patient points of interest 🎯🧭.
It’s crucial to wait for a confirmed break of structure 🧱✅ before forming a directional bias.
This keeps us disciplined and aligned with what price action is truly telling us.
📈 Risk Management Protocols
🔑 Core principles:
Max 1% risk per trade
Only execute at pre-identified levels
Use alerts, not emotion
Stick to your RR plan — minimum 1:2
🧠 You’re not paid for how many trades you take, you’re paid for how well you manage risk.
🧠 Weekly FRGNT Insight
"Trade what the market gives, not what your ego wants."
Stay mechanical. Stay focused. Let the probabilities work.
FX:GBPUSD

Cable Vault Open! GBP/USD Heist Plan in Motion 🏴☠️ THIEF TRADER BULLETIN – CABLE HEIST LOADING! 💂♂️💷
🚪 “The vault’s cracked — time to loot The Cable before the market guards react!”
💷 GBP/USD Cable Job: Bullish Raid Underway! 🚨📈
📌 Asset: GBP/USD "The Cable"
🎯 Plan: Bullish
🧠 Method: Layering limit orders like a stealthy thief 🕵️♂️
📍 Entry: Any level — thief sneaks in quietly
⛔ Stop Loss: 1.32200 (below the guard patrol zone)
💰 Target: 1.35200 (loot stash zone)
🔐 THE SETUP
📈 Entry Tactic:
No rush — thief waits in shadows.
Uses buy limits stacked across dips.
Timeframes: 15m–1H for sniper precision 🎯
🛡️ ESCAPE PLAN
SL at 1.32200 — under previous structure.
Keep it dynamic if price action shifts.
"A smart thief never sticks around too long!"
🎯 TARGET PLAN
1.35200 = Bullish bounty zone
Partial exits recommended as price climbs
Scalpers: Adjust with trailing stops
📊 WHY RAID THE CABLE?
Dollar fatigue after NFP miss
GBP strength on BOE expectations
Thief smells weakness in USD guards 👃💸
🚨 HEIST COMMANDMENTS
1️⃣ Avoid trades during red news ⚠️
2️⃣ Trail stops like your getaway driver 🏎️
3️⃣ Layer orders smart — don’t barge in loud
💬 Drop your Cable bounty total below
❤️ Like, Share & Follow to join the Thieves Guild!
🧠 “Smart thieves don’t chase — they wait, trap, and vanish.” 💨

GBPUSD Bearish Reversal Setup After Liquidity SweepGBPUSD has broken bullish structure on the daily, but on the lower timeframe, price ran equal highs and swept liquidity. That sweep was followed by a sharp reaction, signaling potential bearish intent.
I’ve entered short with a stop above the highs, anticipating a move lower. My target is 1.31400, which lines up with a key relative equal low (REL) and potential liquidity draw.


short gbpusdsell gbpusd using today's high as stop loss. you can also use upper trendline of the rising wedge as your stop loss

GBPUSD THE GBPUSD bank rate will be watched for forward guidance ,if they keep rate the same @ 4.25% and the BOE HEAD KEEP HAWKISH RHETORICS WE KEEP BUYING BRITISH POUNDS .
TRADING IS PROBABILTY ,TRADE WITH CAUTION

GBPUSD – DAILY FORECAST Q3 | W32 | D7 | Y25📊 GBPUSD – DAILY FORECAST
Q3 | W32 | D7 | Y25
Daily Forecast 🔍📅
Here’s a short diagnosis of the current chart setup 🧠📈
Higher time frame order blocks have been identified — these are our patient points of interest 🎯🧭.
It’s crucial to wait for a confirmed break of structure 🧱✅ before forming a directional bias.
This keeps us disciplined and aligned with what price action is truly telling us.
📈 Risk Management Protocols
🔑 Core principles:
Max 1% risk per trade
Only execute at pre-identified levels
Use alerts, not emotion
Stick to your RR plan — minimum 1:2
🧠 You’re not paid for how many trades you take, you’re paid for how well you manage risk.
🧠 Weekly FRGNT Insight
"Trade what the market gives, not what your ego wants."
Stay mechanical. Stay focused. Let the probabilities work.
FX:GBPUSD

GBPUSD Massive Short! SELL!
My dear friends,
My technical analysis for GBPUSD is below:
The market is trading on 1.3309 pivot level.
Bias - Bearish
Technical Indicators: Both Super Trend & Pivot HL indicate a highly probable Bearish continuation.
Target - 1.3295
Recommended Stop Loss - 1.3316
About Used Indicators:
A pivot point is a technical analysis indicator, or calculations, used to determine the overall trend of the market over different time frames.
Disclosure: I am part of Trade Nation's Influencer program and receive a monthly fee for using their TradingView charts in my analysis.
———————————
WISH YOU ALL LUCK

EURUSD and GBPUSD based on DXY move!Hello traders, this is a complete multiple timeframe analysis of this pair. We see could find significant trading opportunities as per analysis upon price action confirmation we may take this trade. Smash the like button if you find value in this analysis and drop a comment if you have any questions or let me know which pair to cover in my next analysis.

Bullish momentum to extend?The Cable (GBP/USD) has reacted off the pivot which acts as an overlap resistance and could rise to the 1st resistance, which is slightly above the 61.8% Fibonacci retracement.
Pivot: 1.3369
1st Support: 1.3200
1st Resistance: 1.357
Risk Warning:
Trading Forex and CFDs carries a high level of risk to your capital and you should only trade with money you can afford to lose. Trading Forex and CFDs may not be suitable for all investors, so please ensure that you fully understand the risks involved and seek independent advice if necessary.
Disclaimer:
The above opinions given constitute general market commentary, and do not constitute the opinion or advice of IC Markets or any form of personal or investment advice.
Any opinions, news, research, analyses, prices, other information, or links to third-party sites contained on this website are provided on an "as-is" basis, are intended only to be informative, is not an advice nor a recommendation, nor research, or a record of our trading prices, or an offer of, or solicitation for a transaction in any financial instrument and thus should not be treated as such. The information provided does not involve any specific investment objectives, financial situation and needs of any specific person who may receive it. Please be aware, that past performance is not a reliable indicator of future performance and/or results. Past Performance or Forward-looking scenarios based upon the reasonable beliefs of the third-party provider are not a guarantee of future performance. Actual results may differ materially from those anticipated in forward-looking or past performance statements. IC Markets makes no representation or warranty and assumes no liability as to the accuracy or completeness of the information provided, nor any loss arising from any investment based on a recommendation, forecast or any information supplied by any third-party.

GBP/USD Short
Looks like its safe to say the trend has now changed on the daily timeframe. Only looking for shorts. Lower timeframe entries (4hr, 1hr) in conjunction with daily key levels. Targeting the nearest daily levels for TPs. You know what to do. Good luck my friends.
Follow me for more!
Professional Trader - Michael M.

GBPUSD – DAILY FORECAST Q3 | W32 | D6 | Y25📊 GBPUSD – DAILY FORECAST
Q3 | W32 | D6 | Y25
Daily Forecast 🔍📅
Here’s a short diagnosis of the current chart setup 🧠📈
Higher time frame order blocks have been identified — these are our patient points of interest 🎯🧭.
It’s crucial to wait for a confirmed break of structure 🧱✅ before forming a directional bias.
This keeps us disciplined and aligned with what price action is truly telling us.
📈 Risk Management Protocols
🔑 Core principles:
Max 1% risk per trade
Only execute at pre-identified levels
Use alerts, not emotion
Stick to your RR plan — minimum 1:2
🧠 You’re not paid for how many trades you take, you’re paid for how well you manage risk.
🧠 Weekly FRGNT Insight
"Trade what the market gives, not what your ego wants."
Stay mechanical. Stay focused. Let the probabilities work.
FX:GBPUSD

Heading into pullback resistance?The Cable (GBP/USD) is rising towards the pivot, which acts as a pullback resistance and could reverse to the 1st support.
Pivot: 1.3386
1st Support: 1.3104
1st Resistance: 1.3591
Risk Warning:
Trading Forex and CFDs carries a high level of risk to your capital and you should only trade with money you can afford to lose. Trading Forex and CFDs may not be suitable for all investors, so please ensure that you fully understand the risks involved and seek independent advice if necessary.
Disclaimer:
The above opinions given constitute general market commentary, and do not constitute the opinion or advice of IC Markets or any form of personal or investment advice.
Any opinions, news, research, analyses, prices, other information, or links to third-party sites contained on this website are provided on an "as-is" basis, are intended only to be informative, is not an advice nor a recommendation, nor research, or a record of our trading prices, or an offer of, or solicitation for a transaction in any financial instrument and thus should not be treated as such. The information provided does not involve any specific investment objectives, financial situation and needs of any specific person who may receive it. Please be aware, that past performance is not a reliable indicator of future performance and/or results. Past Performance or Forward-looking scenarios based upon the reasonable beliefs of the third-party provider are not a guarantee of future performance. Actual results may differ materially from those anticipated in forward-looking or past performance statements. IC Markets makes no representation or warranty and assumes no liability as to the accuracy or completeness of the information provided, nor any loss arising from any investment based on a recommendation, forecast or any information supplied by any third-party.

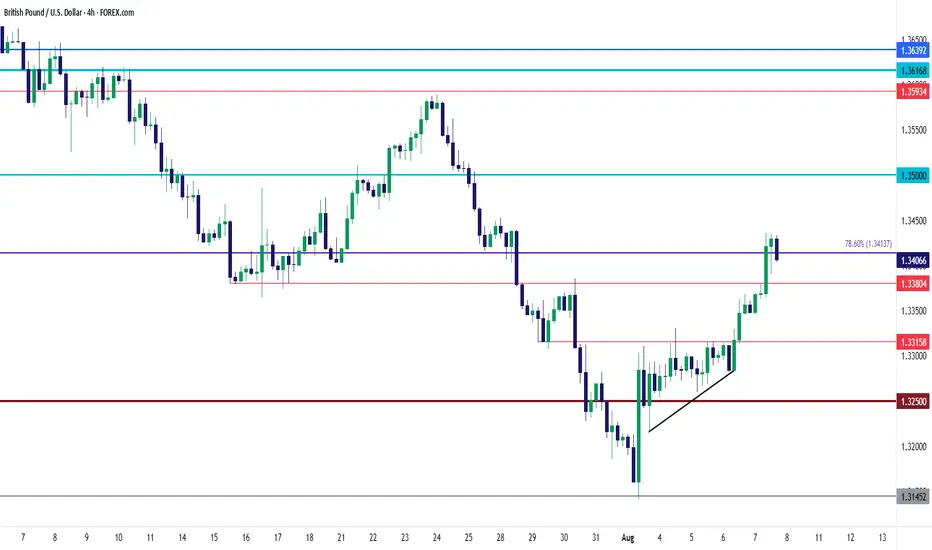
GBP/USD Rate Cut Rally - Ascending Triangle BreakGBP/USD has been an attractive pair for USD-weakness scenarios and that continued through this morning's Bank of England rate cut, which propelled the pair through resistance in an ascending triangle formation.
The challenge now is working with a move that's become quite stretched since the support test at 1.3145 last week. This isn't to say that it can't continue, especially if we see USD bears continuing to push, but that 1.3500 level sitting overhead is an imposing spot of longer-term support/resistance.
For continuation, there's an area of support potential as taken from prior support-turned-resistance that remains of interest, and that's at 1.3380. Below that, we have the resistance side of the ascending triangle down around 1.3316, and a failure from buyers to hold that will given the appearance of failure and possible reversals. In that event I think there could be more attractive venues for USD-strength. - js
GBPUSD BULLISH MOMENTUM PRICE CHARTThis chart suggests buying momentum is in control. As long as price holds above 1.33975, the outlook remains bullish with a high probability of reaching the 1.37 zone.

GBPUSD 1DSince price has broken the previous support, I expect price to rally down more, unless I’m proven otherwise which is the high to be broken which isn’t yet.
