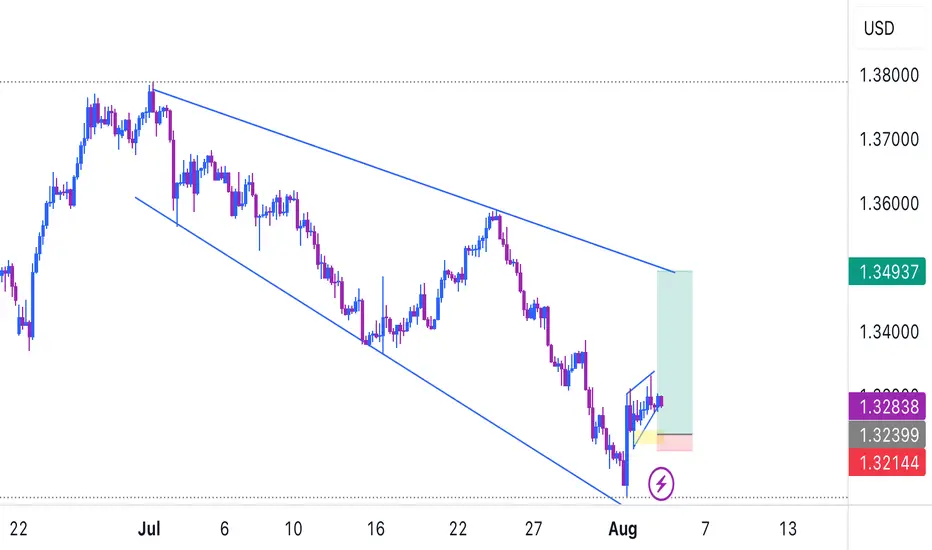
GBPUSD BULLISH MOMENTUM PRICE CHARTThis chart suggests buying momentum is in control. As long as price holds above 1.33975, the outlook remains bullish with a high probability of reaching the 1.37 zone.
GBPUSD trade ideas

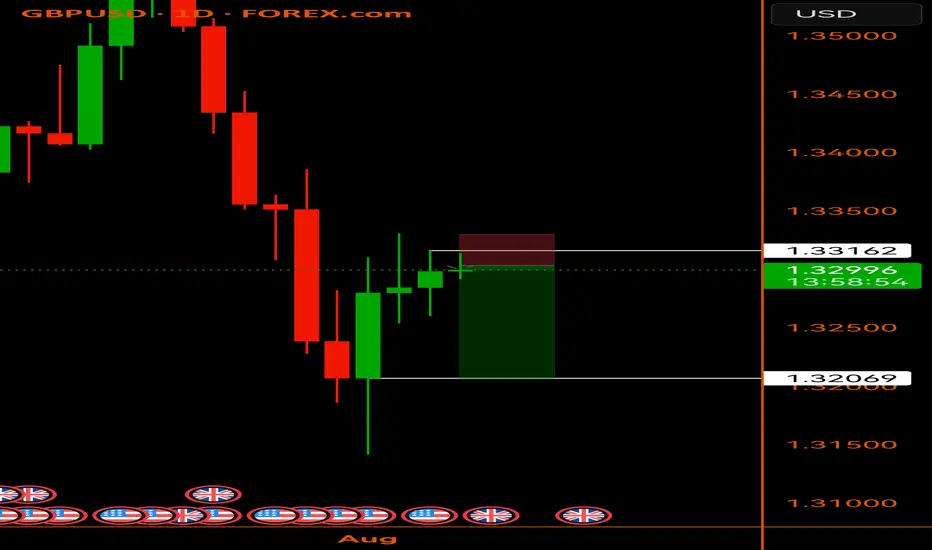
GBPUSD 1DSince price has broken the previous support, I expect price to rally down more, unless I’m proven otherwise which is the high to be broken which isn’t yet.

GBP/USD BEARS ARE GAINING STRENGTH|SHORT
Hello, Friends!
The BB upper band is nearby so GBP-USD is in the overbought territory. Thus, despite the uptrend on the 1W timeframe I think that we will see a bearish reaction from the resistance line above and a move down towards the target at around 1.328.
Disclosure: I am part of Trade Nation's Influencer program and receive a monthly fee for using their TradingView charts in my analysis.
✅LIKE AND COMMENT MY IDEAS✅

Good looking little cypher setup… Cypher pattern in the pound . Ending 12920-12940. Let’s see if we can grind her lower. Good start to the week

GBPUSD strong buyGBPUSD is strong this week and we’re expecting the market to be bullish.,from the analysis we’re anticipating the market to retest 1.32411 zone,,set a buy limit @ 1.32411
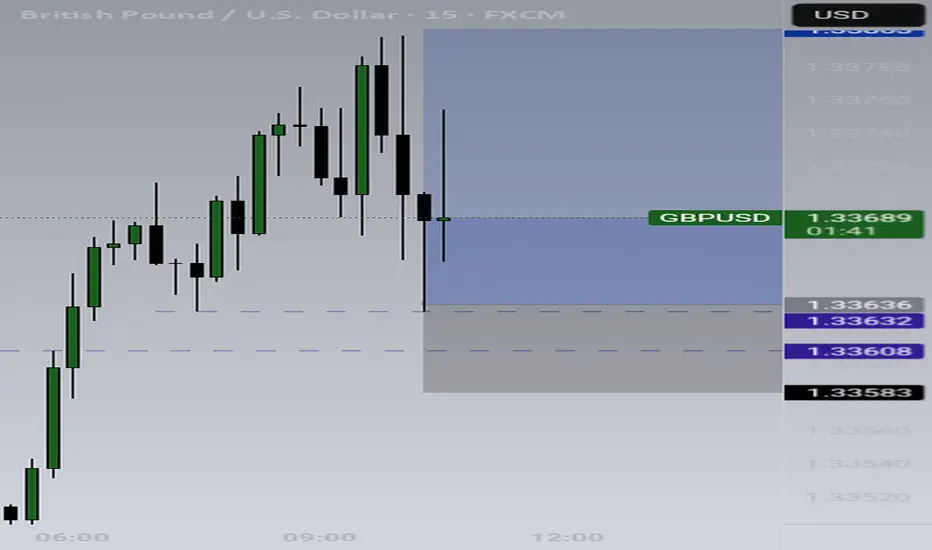
BUY GBPUSD 5.8.2025Confluence order: BUY at M15
Type of order: Limit order
Reason:
- The current top is not touching anything, expected to rise to the sub-key of H1 above.
Note:
- Management of money carefully at the last bottom (1,33013)
Set up entry:
- Entry buy at 1,32790
- SL at 1,32597
- TP1: 1,33013 (~1R)
- TP2: 1,33411 (~3,5R)
Trading Method: Price action (No indicator, only trend and candles)

GBPUSD showing clear downtrend - 4HMarket structure still bearish on GBPUSD
making consistent Lower Highs and Lower Lows
Price just bounced back near previous support area, now acting as resistance.
Planning to short from this zone, expecting downtrend to continue
Timeframe: 4H
Entry: 1.33068
Stop Loss: 1.36220
Take Profit: 1.29864
1:1 RR looks good with trend direction
This is just my personal view, not any financial advise

DeGRAM | GBPUSD is forming the falling wedge📊 Technical Analysis
● GBPUSD is attempting a reversal from the lower boundary of a descending channel after forming a short-term double-bottom near 1.3138.
● Price is now climbing toward 1.3258 resistance, supported by bullish divergence and a break of the local falling wedge.
💡 Fundamental Analysis
● The USD is under pressure ahead of key NFP data, as ISM manufacturing misses weighed on Treasury yields.
● Positive UK PMI and consumer lending data have supported GBP, with BoE policy expectations firming above neutral.
✨ Summary
Long bias above 1.3138. Breakout targets 1.3258 ➜ 1.3423. Setup valid while price holds above 1.3110 support.
-------------------
Share your opinion in the comments and support the idea with a like. Thanks for your support!

Sell GBP/USD - wave C in a bigger 3 wave correction Here is my updated GBP/USD idea after price action closed at the high last week.
I see 2 possibilities here :
1. Wave B is about to end and the beginning of wave C in a bigger ABC 3 wave correction.
If both waves are equal target is around 1.3000 ( 50% retracement of 2025 move )
2. Wave 2 is about to end and the longer 3rd wave is about to start in a 5 wave movement.
Either way I see GBP/USD weakness which makes sense with the growth fundamentals and general problems in the UK at the moment.
Sell : 1.3580 ( under July high 1.35886 which I expect to be taken out )
Stop : 1.3696
Profit : 1.3000 ( 200 Daily MA )
Risk 1:5
This week 11th-15th August has high impact data so I might cancel and update this idea.

GBPUSD SELLSGBPUSD - DAILY TF - last phases of the distribution schematic, just waiting for a pullback to the last point of supply to swing this to the downside.

GBPUSD LONGCheck comment for the proper multi-timeframe layout due to TradingViews publishing restriction
MT5 screenshot also attached.
Still moving in line with the bullish bias I shared in Monday’s post.
Things may shift eventually, but for now — we ride it.
4H supply in control, aligned with weekly demand. 5M demand held strong.
Waited for price to return to the mapped zone, dropped to 15s for execution.
Tapped out after 3RR achieved — not more, not less.
Same system. Same pair. Different day.

SELL GBPUSDWe see the formation of a giant Falling Wedge,.. Lets take profit as price goes into the pattern,.. Good day

GBP/USD: Simple Signs Pointing to a Price BounceHi there,
The GBP/USD in the hourly chart appears bullish or in a trend reversal mode. Taking a look:
🎙️ * General Trend & Price Action :
- We saw a previous downtrend from its late July through July 31, with prices declining steadily.
- Starting early in its August, there is a notable shift as the price begins to recover gradually, moving into an uptrend after hitting a low around 1.3158.
- Then recently, the price has been consolidating within a demand zone, indicating buying interest over anchored VWAP and potential support.
📱* Key Levels & Indicators :
- Demand Zone: Located roughly between 1.3200 and 1.3300, this area has acted as a support zone where buying interest has increased. Prices keeping steady higher lows
- Invalidation Line: At around 1.3142, this is a critical support level. If broken, it could invalidate the bullish scenario.
- Fibonacci Retracement Levels: These indicate potential resistance zones.
- Directional Bias: There is a potential bullish move towards approximately 1.4090, representing a potential gain of close to 4.80% from the current price (~1.3448).It supported by the bullish volatility of the weekly and daily chart which challenges resistance pressure.
🧩 * Summary Conclusion :
- The market appears to be in a recovery phase after a downtrend.
- The demand zone provides strong support, and a break above recent resistance could lead to a significant upward move.
- Key resistance levels are around Fibonacci retracement levels, with a potential target near 1.4090.
- Watch for confirmation of bullish momentum and a sustained move above resistance levels for a more reliable entry.
🎲🎲 Three Fundamental Reasons to Support a Bullish Outlook :
Stronger UK Economic Data: Recent UK GDP and employment figures have outperformed expectations, signaling economic resilience and increasing the appeal of the British Pound to investors.
Fed Dovishness: The US Federal Reserve has signaled a pause or slower pace in interest rate hikes due to easing inflation, diminishing the US dollar's relative advantage and supporting GBP strength.
Market Sentiment Shift: Improved geopolitical stability and reduced Brexit uncertainties have returned investor confidence to UK assets, prompting a shift into GBP.
Happy Trading,
Khiwe.
Not trading advice.

GBPUSD short 1H/4HBased on the CHoCH visible on both the daily and 4-hour charts, we should look for signs of a bearish trend. As shown on the chart, the price is approaching a critical point where it meets the descending trendline. Potential entry points can therefore be looked for on the 15-minute chart. This move could potentially form the second wave of the major impulse, which is marked in green.


GBPUSD SELLGBP/USD holds steady above 1.3250 as investors brace for US ISM Services PMI release
The GBP/USD pair trades on a flat note near 1.3280 during the Asian trading hours on Tuesday. Nonetheless, rising odds of Federal Reserve rate cuts could weigh on the US Dollar against the Cable. Investors will keep an eye on the US ISM Services Purchasing Managers Index data, which is due later on Tuesday.
The broad-based selling pressure surrounding the US Dollar (USD) helped GBP/USD gain traction and allowed the pair to snap a six-day losing streak.
The monthly data published by the US Bureau of Labor Statistics (BLS) showed that Nonfarm Payrolls (NFP) rose by 73,000 in July, missing analysts' estimate of 110,000, while the Unemployment Rate edged higher to 4.2% from 4.1%, as expected. More importantly, the BLS announced that it revised down May and June NFP increases, noting that NFP growth in this two-month period combined was 258,000 lower than previously reported.
The probability of a 25 basis points Federal Reserve (Fed) rate cut in September jumped above 70% from about 30% before the data, as per CME FedWatch Tool. In turn, the USD weakened sharply against its peers.
The economic calendar will not feature any high-tier macroeconomic data releases on Monday. Later in the week, the Bank of England (BoE) will announce monetary policy decisions.
In the meantime, market participants will keep a close eye on US politics. Following the dismal employment report, US President Donald Trump fired BLS Chief Erika McEntarfer, accusing her of manipulating the numbers for political purposes. Additionally, Fed Governor Adriana Kugler, whose term was scheduled to end on January 31, 2026, announced her resignation.
Investors could opt to stay away from the USD in case political developments feed into concerns over the Fed or the BLS losing independence.
SUPPORT 1.32382
SUPPORT 1.31758
SUPPORT 1.32382
RESISTANCE 1.33086
RESISTANCE 1.33375

GBPUSD is BearishPrice was in an uptrend, however it now seems to have taken a rejection from a four hourly descending trendline with a double top formation and bearish RSI divergence. If previous higher low is broken then we can expect a bearish reversal as per Dow theory. Targets are mentioned on the chart.

GBPUSD Technical Breakdown – High-Probability Rejection Play📉 GBPUSD Technical Breakdown – High-Probability Rejection Play
🔥 Clean Structure | Strong Confluences | Smart Money Insight
This GBPUSD setup is a textbook example of price action meeting institutional behavior.
🧠 Key Observations:
• Break of Structure (BOS) identified multiple times confirming clear trend shifts.
• Price tapped into a well-defined resistance zone and showed an aggressive rejection, validating seller presence.
• Liquidity grab from the highs led to an immediate drop, marking the start of bearish momentum.
🎯 Target Zones:
• First TP: 1.33009
• Second TP: 1.32375
• Final Target: 1.31443 (aligned with major support zone and BOS retest)
🛡 Why This Setup Matters:
• Strong rejection from premium zone
• BOS confirms direction
• Volume and structure align for high RR potential
• Clean imbalance fill expectations
✅ Plan:
Sell from rejection zone with SL above the wick high. Trail stops as price approaches each target.

GU sell setupMin 3rr
Monday and Tuesday creeping higher after nfp friday...
London or newyork session can form high of the day for sell setup.
Follow at own risk. Thisbis not financial advice.
GBPUSD LongGBP/USD prices could potentially increase from the 1.3146 level within the Fair Value Gap (FVG) zone, with the next likely target being an upper FVG zone as a potential objective.

USD may weaken in the futureExperts say the USD is still under pressure after the US economy announced a "shocking" non-farm payrolls report for July and revised the May and June figures down sharply compared to forecasts and previous figures.
Experts say the rapidly weakening job market is fueling speculation that the US Federal Reserve (Fed) will soon cut interest rates in September.
However, in the last session, the USD basically stopped falling sharply, when data on the US service and aggregate purchasing managers' indexes increased quite well in July. This has helped the USD not to fall too much.
The USD is expected to remain volatile when the US announces weekly employment on Thursday. Next week is the July consumer price index (CPI). This is an important indicator for the Fed to make a decision on interest rate policy at its meeting in September. This index will strongly affect the trend of the USD.

GBPUSDGBP/USD Bullish Bias — Price is holding above a key demand zone, with market structure printing higher highs and higher lows. Buyers are defending the zone, suggesting continued upward momentum. As long as demand remains intact, the bias stays bullish with targets set at the next resistance levels. Watch for confirmation entries during the London session, where volatility is highest.
