GBPUSD trade ideas

GBPUSD – WEEKLY FORECAST Q3 | W32 | Y25📊 GBPUSD – WEEKLY FORECAST
Q3 | W32 | Y25
Weekly Forecast 🔍📅
Here’s a short diagnosis of the current chart setup 🧠📈
Higher time frame order blocks have been identified — these are our patient points of interest 🎯🧭.
It’s crucial to wait for a confirmed break of structure 🧱✅ before forming a directional bias.
This keeps us disciplined and aligned with what price action is truly telling us.
📈 Risk Management Protocols
🔑 Core principles:
Max 1% risk per trade
Only execute at pre-identified levels
Use alerts, not emotion
Stick to your RR plan — minimum 1:2
🧠 You’re not paid for how many trades you take, you’re paid for how well you manage risk.
🧠 Weekly FRGNT Insight
"Trade what the market gives, not what your ego wants."
Stay mechanical. Stay focused. Let the probabilities work.
FRGNT
FX:GBPUSD


GBPUSD 1H Supply Zone Rejection – Bearish Setup BuildingPrice is currently trading inside a clearly defined 1H supply zone near 1.34460
Multiple upper wicks show strong rejection and selling pressure at this level
Consolidation inside the supply area suggests potential distribution before a drop
🔻 Bearish Bias:
Bears expected to take control after final liquidity sweep above the zone
If price breaks below 1.33601, expect stronger momentum toward demand
📉 Trade Plan (Short Setup):
text
Copy
Edit
Sell Zone: 1.34400 – 1.34500
SL: Above 1.34650
TP1: 1.33601 (mid-support)
TP2: 1.32958 (high-volume support zone)
TP3: 1.32600 (orange demand base)
Risk:Reward ~ 2:1 or better
🧠 Key Price Levels:
🔵 Supply Zone: 1.34400 – 1.34500
🔵 Support Levels: 1.33601, 1.32958
🟠 Demand Zone: ~1.32600 (last major support zone)
📝 Notes:
Wait for bearish confirmation (M-pattern, engulfing candle, break of structure)
Ideal for Smart Money and supply/demand traders
⚠️ Disclaimer:
This is not financial advice. Trade at your own risk. Use proper risk management.

GBP/USD BEARS ARE GAINING STRENGTH|SHORT
Hello, Friends!
The BB upper band is nearby so GBP-USD is in the overbought territory. Thus, despite the uptrend on the 1W timeframe I think that we will see a bearish reaction from the resistance line above and a move down towards the target at around 1.328.
Disclosure: I am part of Trade Nation's Influencer program and receive a monthly fee for using their TradingView charts in my analysis.
✅LIKE AND COMMENT MY IDEAS✅

GBPUSD is BearishPrice was in an uptrend, however it now seems to have taken a rejection from a four hourly descending trendline with a double top formation and bearish RSI divergence. If previous higher low is broken then we can expect a bearish reversal as per Dow theory. Targets are mentioned on the chart.

gbpusd sell positionprice at a very strong supply level, i expect a sharp push down anytime from now

How could GBPUSD react to the BoE's rate decision?We are waiting for the BoE today to deliver its rate decision. Although we know the potential outcome, still, the reaction in MARKETSCOM:GBPUSD will be heavily monitored.
Let's dig in.
FX_IDC:GBPUSD
Let us know what you think in the comments below.
Thank you.
75.2% of retail investor accounts lose money when trading CFDs with this provider. You should consider whether you understand how CFDs work and whether you can afford to take the high risk of losing your money. Past performance is not necessarily indicative of future results. The value of investments may fall as well as rise and the investor may not get back the amount initially invested. This content is not intended for nor applicable to residents of the UK. Cryptocurrency CFDs and spread bets are restricted in the UK for all retail clients.

GBPUSD CAN FALLING SOONGBPUSD market running in side wave from last days now market will be reject from resistance zone so be careful if you want then short from support zone
TRADE AT YOUR OWN RISK
Cable Completes Harmonic Move Ahead of BoE Rate DecisionThe Bank of England is expected to cut rates by 25 basis points this Thursday, bringing the base rate to 4%. With a likely split vote and uncertainty surrounding Gilt sales, the decision adds more complexity to the UK’s economic outlook.
The Rate Decision
This week’s BoE rate decision is far from straightforward. While the 25 basis point cut is anticipated, the vote will likely be split, making it difficult for the Bank to signal future rate moves. Inflation remains high and the jobs market weakens, leaving the MPC divided on how best to handle stagflation. Speculation is also swirling about the future of active Gilt sales, which could further complicate the BoE’s policy path.
Harmonic Pullback and Key Levels
GBP/USD has been in mean reversion mode after its July surge to two-year highs, and recent price action completed a classic ABCD harmonic pullback pattern. The A-B leg took prices down into June’s swing lows, while the B-C leg saw a brief recovery back towards the June highs. The final C-D leg completed the pattern with a drop to the May swing lows, which have now become a critical support level.
At the May lows, we saw a bullish reversal signal in the form of Friday’s engulfing candle, suggesting a potential bounce. The support here is reinforced by the VWAP anchored to the January lows and the 200-day moving average, both of which align with the harmonic completion point, providing solid technical support for cable.
GBP/USD Daily Candle Chart
Past performance is not a reliable indicator of future results
Range-Bound Action and Short-Term Equilibrium
Looking at the hourly chart, recent price action has formed a tight sideways range, indicating indecision in the market. This range represents equilibrium as traders wait for clarity from the BoE rate decision on Thursday. For short-term traders, the focus will be on watching for a breakout above or below this range, which could trigger the next significant move. A break higher could signal further bullish momentum, while a breakdown could lead to additional downside, depending on the BoE’s announcement.
GBP/USD Hourly Candle Chart
Past performance is not a reliable indicator of future results
Disclaimer: This is for information and learning purposes only. The information provided does not constitute investment advice nor take into account the individual financial circumstances or objectives of any investor. Any information that may be provided relating to past performance is not a reliable indicator of future results or performance. Social media channels are not relevant for UK residents.
Spread bets and CFDs are complex instruments and come with a high risk of losing money rapidly due to leverage. 85.24% of retail investor accounts lose money when trading spread bets and CFDs with this provider. You should consider whether you understand how spread bets and CFDs work and whether you can afford to take the high risk of losing your money.

GBPUSD – DAILY FORECAST Q3 | W32 | D5 | Y25📊 GBPUSD – DAILY FORECAST
Q3 | W32 | D5 | Y25
Daily Forecast 🔍📅
Here’s a short diagnosis of the current chart setup 🧠📈
Higher time frame order blocks have been identified — these are our patient points of interest 🎯🧭.
It’s crucial to wait for a confirmed break of structure 🧱✅ before forming a directional bias.
This keeps us disciplined and aligned with what price action is truly telling us.
📈 Risk Management Protocols
🔑 Core principles:
Max 1% risk per trade
Only execute at pre-identified levels
Use alerts, not emotion
Stick to your RR plan — minimum 1:2
🧠 You’re not paid for how many trades you take, you’re paid for how well you manage risk.
🧠 Weekly FRGNT Insight
"Trade what the market gives, not what your ego wants."
Stay mechanical. Stay focused. Let the probabilities work.
FX:GBPUSD

GBP/USD This trade is based on a combination of volume analysis, Fibonacci retracement levels, and signals from the Stochastic oscillator to identify a favorable long entry. The setup indicates a potential bullish continuation, supported by increasing volume and a shift in momentum.
Entry: 1.3293 area
Stop-Loss: 1.3269 area
Take-Profit: 1.3333 area
Risk-to-Reward Ratio: ~1:2.0
This setup targets a continuation of the upward move, with price reacting positively at a key Fibonacci zone and momentum confirming with a bullish signal from the Stochastic.
⚠️ Disclaimer:
This is not financial advice. Trading involves risk and may not be suitable for all investors. Always conduct your own analysis and use proper risk management.


GBPUSD – DAILY FORECAST Q3 | W32 | D4 | Y25📊 GBPUSD – DAILY FORECAST
Q3 | W32 | D4 | Y25
Daily Forecast 🔍📅
Here’s a short diagnosis of the current chart setup 🧠📈
Higher time frame order blocks have been identified — these are our patient points of interest 🎯🧭.
It’s crucial to wait for a confirmed break of structure 🧱✅ before forming a directional bias.
This keeps us disciplined and aligned with what price action is truly telling us.
📈 Risk Management Protocols
🔑 Core principles:
Max 1% risk per trade
Only execute at pre-identified levels
Use alerts, not emotion
Stick to your RR plan — minimum 1:2
🧠 You’re not paid for how many trades you take, you’re paid for how well you manage risk.
🧠 Weekly FRGNT Insight
"Trade what the market gives, not what your ego wants."
Stay mechanical. Stay focused. Let the probabilities work.
FX:GBPUSD

GBPUSD Possible long.-In the monthly (higher timeframes), GBPUSD is bullish.
-In the weekly timeframe, the was a momentous price reaction at the 1w Hidden Invalidation, making it a very strong area of liquidity and unlikely to be broken further in the short term period but maybe tested.
In the the daily and timeframe GU is bearish, but it is just a possible higher timeframe retracement, but still we are looking for opportunities in that retracement too.
-Above is our high probability low risk idea.
GBPUSD is in the Selling Direction after Testing ResistanceHello Traders
In This Chart GBPUSD HOURLY Forex Forecast By FOREX PLANET
today GBPUSD analysis 👆
🟢This Chart includes_ (GBPUSD market update)
🟢What is The Next Opportunity on GBPUSD Market
🟢how to Enter to the Valid Entry With Assurance Profit
This CHART is For Trader's that Want to Improve Their Technical Analysis Skills and Their Trading By Understanding How To Analyze The Market Using Multiple Timeframes and Understanding The Bigger Picture on the Charts


GBPUSD BUY TIGER SETUP LOOOOOOOOOOOONGwelcome
we have strong mitigation order block on time frame weekly and daily
and on 4H we have break downtrend and retest on it
and we in well discount area
and we have demand on high time frame
so this is good idea for buying
Don't forget to follow me
so that get refresh analysis

GBPUSD GBPUSD has formed a head and shoulder pattern on the daily timeframe which has being executed, waiting for the market so as to short GBPUSD..

GBPUSD Wave Analysis – 7 August 2025
- GBPUSD reversed from the support area
- Likely to rise to resistance level 1.3600
GBPUSD currency pair recently reversed from the support area between the strong support level of 1.3175 (former resistance from April) and the lower daily Bollinger Band.
This support area was further strengthened by the 61.8% Fibonacci correction of the upward impulse from April.
Given the clear daily uptrend, GBPUSD currency pair can be expected to rise to the next resistance level 1.3600 (which stopped wave B in July).

GBPUSD Holds Gains on Dovish BOE, Tariff & Fed RisksThe GBPUSD chart setup is also currently positioned in a bearish structure. It continues to trade below the trendline connecting peaks from July 2023 to September 2024. Additionally, it recently broke below the neckline of a potential head and shoulders pattern, now testing the midpoint target at the 1.3140 support.
Should a decisive close occur below that level, the pattern could continue unfolding toward the next support at 1.2940. Further weakness may follow towards the trendline connecting lower peaks since 2008 (near 1.2740) is the 1.2940 level fails to hold.
On the upside, if the pair closes firmly above the neckline and clears the 1.330 resistance, gains could extend toward key 2023–2024 resistance levels at 1.36 and 1.38, potentially paving the way for new 2025 highs.
- Razan Hilal, CMT

GBP/USD Bearish (Short Setup) - 04 August 2025🔍 Trade Overview
Bias: Bearish (Short Setup)
Pair: GBP/USD
Timeframe: 4H (Short-to-Mid Term Trade)
Strategy: Trend Continuation (Sell the Rally)
🧠 Technical Analysis
Chart Analysis (4H GBP/USD)
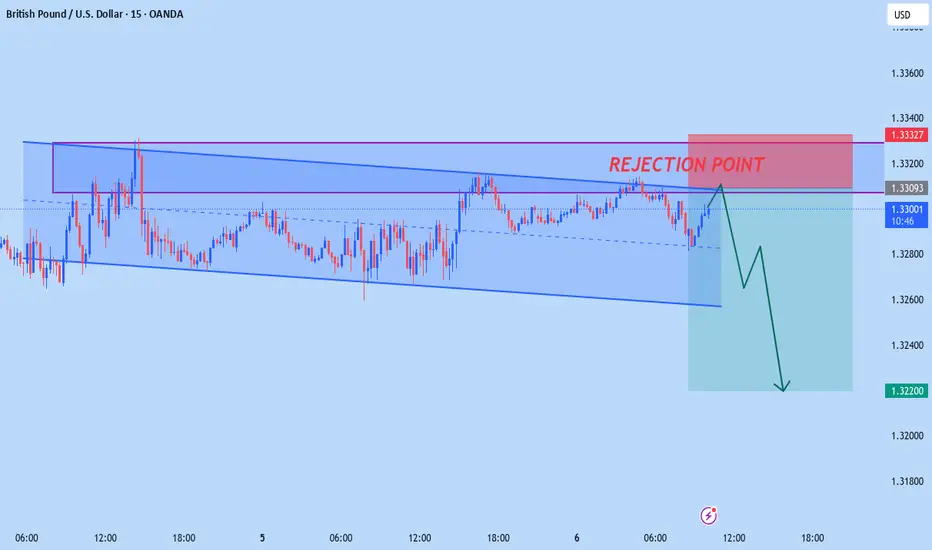
Price is currently in a downtrend, trading within a descending channel.
There’s a marked "Sell Zone" around 1.33463, which aligns with a resistance level and prior support turned resistance.
The price appears to be pulling back towards the sell zone before potentially resuming the downtrend.
Target (TP): Around 1.30300–1.30500, matching the lower support zone and M2 pivot support.
Entry Zone: 1.33400 – 1.33650
Stop Loss: Above 1.3400–1.3420 (just above sell zone highs)
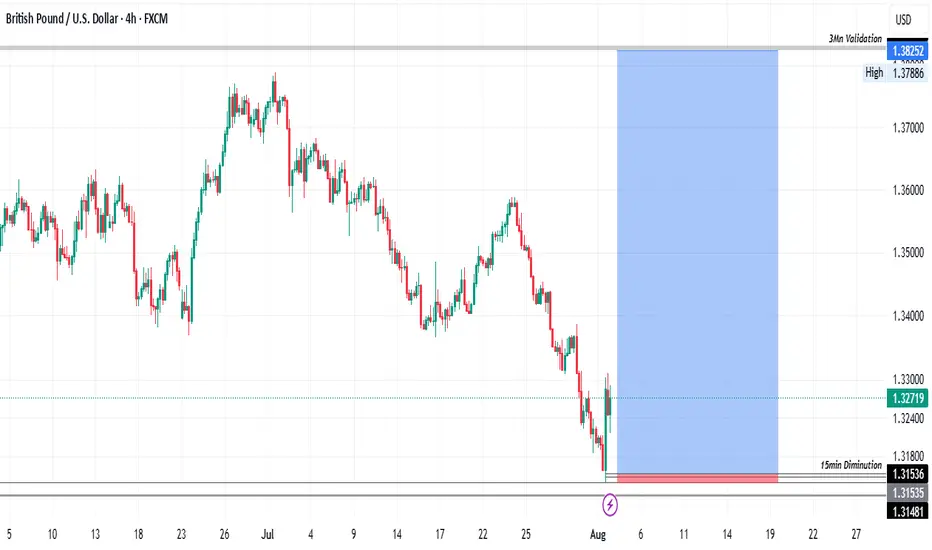
📉 Trend Projection
Projection Chart shows three scenarios:
Green (bullish): Less probable due to overall market structure.
Black & Red (bearish): Most consistent with current trend.
Trend likely to resume downward from August 5–6, in line with your chart’s projected move from the sell zone to TP.
📊 Fundamental Analysis
🔻 Labor Market (USD)
NFP Missed Forecast: Actual 73k vs. Forecast 110k (Δ -37k)
Negative for USD short-term.
However, market may have already priced in some weakness, especially if GBP weakness is the main trend driver.
📈 COT Data
GBP: More short positions (53.21%) than long (46.79%)
USD: Even more skewed bearish, with 56.48% shorts
Indicates net bearishness for both currencies, but USD slightly more shorted.
GBP COT shift more dramatic (-3.36%) = implies increasing bearish sentiment on GBP → supports the short trade idea.
🧍 Retail Sentiment
53% are long, 47% are short → Slightly contrarian bearish (retail often on the wrong side)
Retail positioning supports bearish continuation
📋 Trade Plan
▶️ Entry
Sell Limit Order: Between 1.33400 – 1.33650 (Sell Zone)
Optional: scale in with partial orders
⛔ Stop Loss
Above 1.3400 – 1.3420
Above previous highs and structure
✅ Take Profit
TP1: 1.3160 (near-term support/pivot)
TP2: 1.3050 (main TP target on chart)
TP3 (runner): 1.2950 (for extended breakdown)
📊 Position Sizing & Risk
Risk no more than 1–2% of account
Risk-to-Reward Ratio: Minimum 1:2, ideally 1:3

#GBPUSD A bearish sign where sellers are getting strengthAn expected bearish move where sellers are getting strength against buyers. A strong supply zone where we can make a huge green pips with sellers. #GBPUSD #forex #fx #fxtrading
