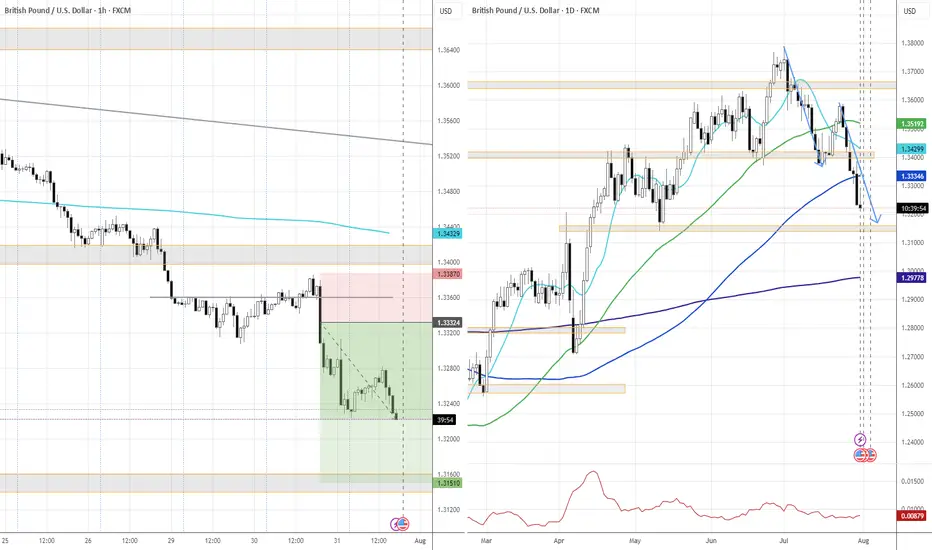
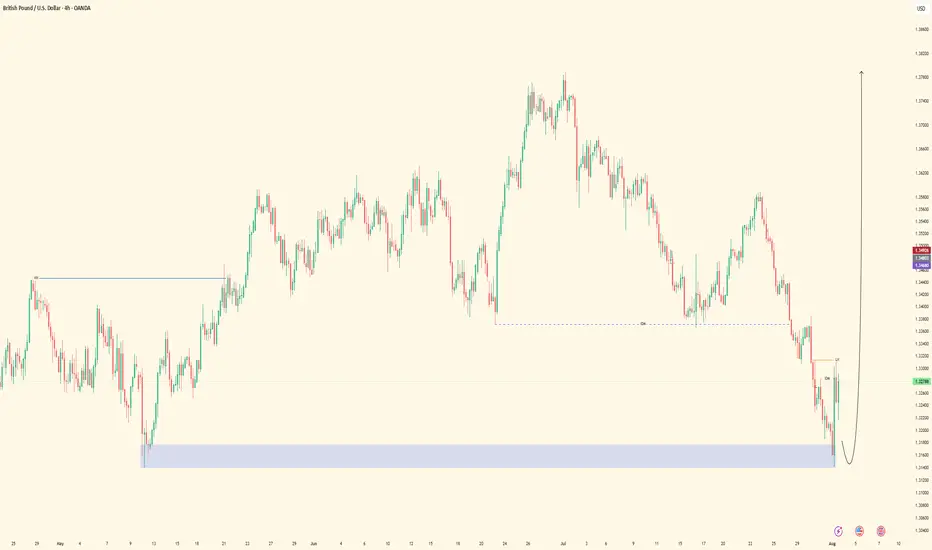
Looking for forward downward movementPrice of the smaller time frames is conducting a small counter trend retracing to the an area on confluence.
On the retrace, looking for price to come into the 50%. Possibly grab some liquidity for that last big push up.
Now once we hit the sell side at the 61.8% which matches up with the bearish trend line(in Blue), we can then looking for smaller time frame break of structure. Possibly 15min/30min
Taking sells down to multiple targets:
· 1.33750
· 1.33450
· 1.33250
If you're going to have multiple positions scale in at pull backs on the way down. And if you decide to leave runners towards these targets make sure you break even or trail stop your positions. Have a good day trading! - Robby
GBPUSD trade ideas

Fundamental Market Analysis for August 11, 2025 GBPUSDThe Bank of England (BoE) cut its key interest rate by 25 basis points (bps) last week, as expected, bringing the base rate down to 4%, its lowest level since 2023. However, the narrow 5-4 vote indicated greater resistance to rate cuts than expected by the markets, prompting traders to reduce their bets on aggressive easing by the BoE.
In addition, traders are also factoring in the likelihood that the US central bank will cut interest rates at least twice before the end of this year.
Meanwhile, expectations for a dovish Fed policy were confirmed by comments from Fed Governor Michelle Bowman on Saturday, who said that three interest rate cuts would likely be appropriate this year. Bowman added that the clear weakening of the labor market outweighs the risks of future inflation. This, in turn, should limit the decline of the GBP/USD pair.
The latest US consumer inflation data will be released on Tuesday, while preliminary UK second-quarter GDP data and the US producer price index (PPI) will be released on Thursday. These important data points should provide significant momentum to spot prices and help determine the next phase of the directional movement.
Trading recommendation: BUY 1.3490, SL 1.3410, TP 1.3570

Market Trap Alert! GBP/USD Bearish Robbery Plan🔥💸 "The Cable Heist" – GBP/USD Robbery Plan Using Thief Trading Style 💸🔥
— Unfiltered Forex Forecast with Risky Intentions —
🌍 Hey Money-Makers, Market Hustlers & Chart Bandits! 🤑✈️
Hola! Bonjour! Marhaba! Hallo! Ciao! Welcome to the Forex streets where the smart rob the charts, not banks.
Ready for the GBP/USD Heist? Let’s break it down with our infamous Thief Trading Style – raw, unapologetic, and built for profits.
💼 Operation Name: “The Cable Forex Bank Robbery”
🎯 Pair: GBP/USD – aka “The Cable”
⚔️ Style: Scalp / Day Trade / Swing Heist
📊 Bias: Short (Bearish Setup)
🛠 STRATEGY SETUP: "Follow the Shadows"
🔍 Analysis Basis:
Smart-Money Traps at Key Levels
Oversold ≠ Reversal (Read between the candles)
Liquidity Hunting Zones
Retail Stop Clusters Exposed
Thief-style DCA Entries (Staggered Entry Levels)
Multi-timeframe Confirmation
COT, Sentiment & News-Driven Volatility
🎯 ENTRY ZONE:
Enter short (sell) using 15M or 30M chart.
Sell Limits near recent highs (pullback zone).
DCA (Layered Entry) recommended – Thief loves catching price slipping.
Let the liquidity work for us.
🛑 STOP LOSS (SL):
Base SL around 1.34850 on 4H Chart – above swing high.
Adjust SL per position size and total entries.
Manage risk, but remember: thieves don’t panic, they plan!
🎯 TARGET ZONE:
TP near 1.32500 or adjust using price action.
Escape before target if market mood flips – no need to be greedy.
Trail SLs if market momentum dies down.
👀 Scalpers' Special Note:
Only SHORT — don’t mess with long side unless you’re a liquidity donor.
Quick ins & outs. If you're loaded with capital, jump in big – else follow the swing team.
Use trailing SLs for safety — protect the loot.
📢 FUNDAMENTALS TO WATCH:
News Impacting GBP/USD
COT Reports
Sentiment Indicators
Macro Trends / Yield Spreads
US Dollar Strength Index (DXY)
UK Economic Reports (CPI, GDP, Rate Decisions)
⚠️ RISK MANAGEMENT TIPS:
🚨 Avoid new entries during news releases
🚨 Use trailing stops during volatility spikes
🚨 Secure running trades before major announcements
🚀 Boost the Robbery – Support the Strategy
💖 Smash that BOOST BUTTON if you're vibing with this setup. Help the Thief crew grow stronger!
Let’s keep milking the market 💸 – one “heist” at a time. Stay dangerous, stay smart.
🔓 NOTE: This isn't investment advice. Just a wild trading idea from a chart outlaw.
Always DYOR – Do Your Own Robbery (Research).
Market conditions shift fast. Stay alert, adapt, and respect your capital.
#ForexThiefStyle #CableHeist #GBPUSDShort #SmartMoneyMoves #LiquidityHunters #ChartOutlaws #TradingRebels #DayTradeLife #ScalpersParadise #ForexGang #FXHeistPlans

GBPUSD Holds Gains on Dovish BOE, Tariff & Fed RisksThe GBPUSD chart setup is also currently positioned in a bearish structure. It continues to trade below the trendline connecting peaks from July 2023 to September 2024. Additionally, it recently broke below the neckline of a potential head and shoulders pattern, now testing the midpoint target at the 1.3140 support.
Should a decisive close occur below that level, the pattern could continue unfolding toward the next support at 1.2940. Further weakness may follow towards the trendline connecting lower peaks since 2008 (near 1.2740) is the 1.2940 level fails to hold.
On the upside, if the pair closes firmly above the neckline and clears the 1.330 resistance, gains could extend toward key 2023–2024 resistance levels at 1.36 and 1.38, potentially paving the way for new 2025 highs.
- Razan Hilal, CMT

GBP/USD This trade is based on a combination of volume analysis, Fibonacci retracement levels, and signals from the Stochastic oscillator to identify a favorable long entry. The setup indicates a potential bullish continuation, supported by increasing volume and a shift in momentum.
Entry: 1.3293 area
Stop-Loss: 1.3269 area
Take-Profit: 1.3333 area
Risk-to-Reward Ratio: ~1:2.0
This setup targets a continuation of the upward move, with price reacting positively at a key Fibonacci zone and momentum confirming with a bullish signal from the Stochastic.
⚠️ Disclaimer:
This is not financial advice. Trading involves risk and may not be suitable for all investors. Always conduct your own analysis and use proper risk management.

GBP/USD Bearish (Short Setup) - 04 August 2025🔍 Trade Overview
Bias: Bearish (Short Setup)
Pair: GBP/USD
Timeframe: 4H (Short-to-Mid Term Trade)
Strategy: Trend Continuation (Sell the Rally)
🧠 Technical Analysis
Chart Analysis (4H GBP/USD)
Price is currently in a downtrend, trading within a descending channel.
There’s a marked "Sell Zone" around 1.33463, which aligns with a resistance level and prior support turned resistance.
The price appears to be pulling back towards the sell zone before potentially resuming the downtrend.
Target (TP): Around 1.30300–1.30500, matching the lower support zone and M2 pivot support.
Entry Zone: 1.33400 – 1.33650
Stop Loss: Above 1.3400–1.3420 (just above sell zone highs)
📉 Trend Projection
Projection Chart shows three scenarios:
Green (bullish): Less probable due to overall market structure.
Black & Red (bearish): Most consistent with current trend.
Trend likely to resume downward from August 5–6, in line with your chart’s projected move from the sell zone to TP.
📊 Fundamental Analysis
🔻 Labor Market (USD)
NFP Missed Forecast: Actual 73k vs. Forecast 110k (Δ -37k)
Negative for USD short-term.
However, market may have already priced in some weakness, especially if GBP weakness is the main trend driver.
📈 COT Data
GBP: More short positions (53.21%) than long (46.79%)
USD: Even more skewed bearish, with 56.48% shorts
Indicates net bearishness for both currencies, but USD slightly more shorted.
GBP COT shift more dramatic (-3.36%) = implies increasing bearish sentiment on GBP → supports the short trade idea.
🧍 Retail Sentiment
53% are long, 47% are short → Slightly contrarian bearish (retail often on the wrong side)
Retail positioning supports bearish continuation
📋 Trade Plan
▶️ Entry
Sell Limit Order: Between 1.33400 – 1.33650 (Sell Zone)
Optional: scale in with partial orders
⛔ Stop Loss
Above 1.3400 – 1.3420
Above previous highs and structure
✅ Take Profit
TP1: 1.3160 (near-term support/pivot)
TP2: 1.3050 (main TP target on chart)
TP3 (runner): 1.2950 (for extended breakdown)
📊 Position Sizing & Risk
Risk no more than 1–2% of account
Risk-to-Reward Ratio: Minimum 1:2, ideally 1:3

2 Touch Point Bounce Channel regressionThe projection will be closed within 1 week based on the previous wave regression. TP when touching the channel support.

GBPUSD 30.07.2025+ US data Beat (ADP Nonfarm, GDP QoQ, Core PCE)
~+ Timing: Pre-Fed Rate Decision
~+ Latest UK Retail Sales Miss
~+ BoE is in dovish tilt (MPC 6-3 vs 6-2 expected)
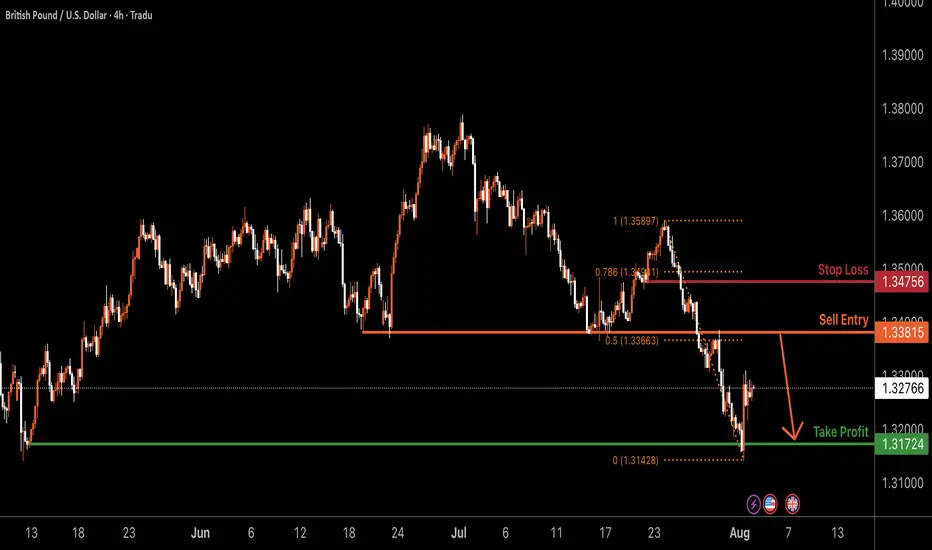
GBPUSD H4 | Bearish reversalThe Cable (GBP/USD) is rising towards the sell entry, which is a pullback resistance, and could reverse to the downside.
Sell entry is at 1.3381, which is a pullback resistance that lines up with the 50% Fibonacci retracement.
Stop is at 1.3475, which is a pullback resistance that is slightly below the 78.6% Fibonacci retracement.
Take profit is at 1.3172, which is a multi swing low support.
High Risk Investment Warning
Trading Forex/CFDs on margin carries a high level of risk and may not be suitable for all investors. Leverage can work against you.
Stratos Markets Limited (tradu.com ):
CFDs are complex instruments and come with a high risk of losing money rapidly due to leverage. 65% of retail investor accounts lose money when trading CFDs with this provider. You should consider whether you understand how CFDs work and whether you can afford to take the high risk of losing your money.
Stratos Europe Ltd (tradu.com ):
CFDs are complex instruments and come with a high risk of losing money rapidly due to leverage. 66% of retail investor accounts lose money when trading CFDs with this provider. You should consider whether you understand how CFDs work and whether you can afford to take the high risk of losing your money.
Stratos Global LLC (tradu.com ):
Losses can exceed deposits.
Please be advised that the information presented on TradingView is provided to Tradu (‘Company’, ‘we’) by a third-party provider (‘TFA Global Pte Ltd’). Please be reminded that you are solely responsible for the trading decisions on your account. There is a very high degree of risk involved in trading. Any information and/or content is intended entirely for research, educational and informational purposes only and does not constitute investment or consultation advice or investment strategy. The information is not tailored to the investment needs of any specific person and therefore does not involve a consideration of any of the investment objectives, financial situation or needs of any viewer that may receive it. Kindly also note that past performance is not a reliable indicator of future results. Actual results may differ materially from those anticipated in forward-looking or past performance statements. We assume no liability as to the accuracy or completeness of any of the information and/or content provided herein and the Company cannot be held responsible for any omission, mistake nor for any loss or damage including without limitation to any loss of profit which may arise from reliance on any information supplied by TFA Global Pte Ltd.
The speaker(s) is neither an employee, agent nor representative of Tradu and is therefore acting independently. The opinions given are their own, constitute general market commentary, and do not constitute the opinion or advice of Tradu or any form of personal or investment advice. Tradu neither endorses nor guarantees offerings of third-party speakers, nor is Tradu responsible for the content, veracity or opinions of third-party speakers, presenters or participants.
GBPUSDGBPUSD needs a correction and a push up soon before any further drop.
Disclosure: We are part of Trade Nation's Influencer program and receive a monthly fee for using their TradingView charts in our analysis.

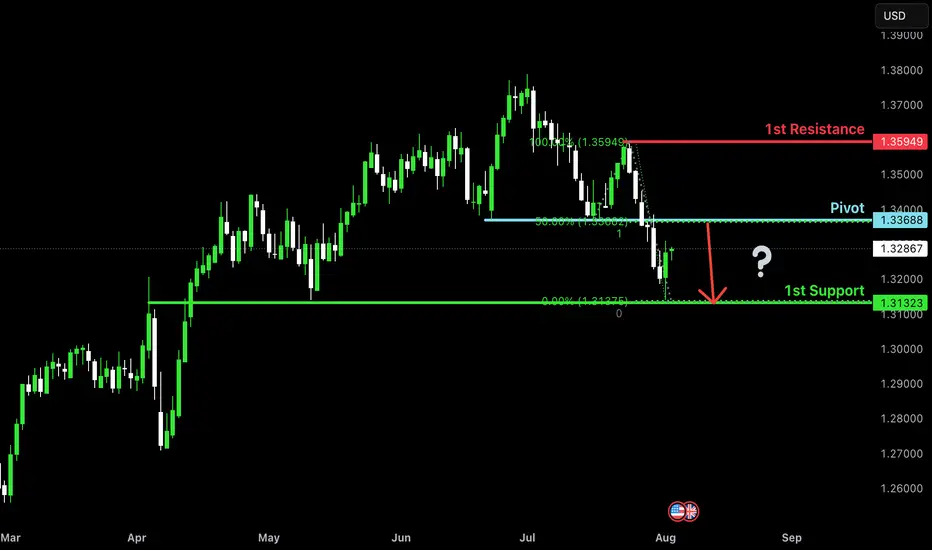
Heading into pullback resistance?The Cable (GBP/USD) is rising towards the pivot, which has been identified as a pullback resistance and could reverse to the 1st support, which acts as an overlap support.
Pvot: 1.3368
1st Support: 1.3132
1st Resistance: 1.3594
Risk Warning:
Trading Forex and CFDs carries a high level of risk to your capital and you should only trade with money you can afford to lose. Trading Forex and CFDs may not be suitable for all investors, so please ensure that you fully understand the risks involved and seek independent advice if necessary.
Disclaimer:
The above opinions given constitute general market commentary, and do not constitute the opinion or advice of IC Markets or any form of personal or investment advice.
Any opinions, news, research, analyses, prices, other information, or links to third-party sites contained on this website are provided on an "as-is" basis, are intended only to be informative, is not an advice nor a recommendation, nor research, or a record of our trading prices, or an offer of, or solicitation for a transaction in any financial instrument and thus should not be treated as such. The information provided does not involve any specific investment objectives, financial situation and needs of any specific person who may receive it. Please be aware, that past performance is not a reliable indicator of future performance and/or results. Past Performance or Forward-looking scenarios based upon the reasonable beliefs of the third-party provider are not a guarantee of future performance. Actual results may differ materially from those anticipated in forward-looking or past performance statements. IC Markets makes no representation or warranty and assumes no liability as to the accuracy or completeness of the information provided, nor any loss arising from any investment based on a recommendation, forecast or any information supplied by any third-party.
GBPUSD short setupGBPUSD rising trendline break and retest falling trend line finnly breakout triangel.
Sell below: 1.3275
Stop Loss: 1.3305
1st target: 1.3250
2nd target: 1.3215 FOREXCOM:GBPUSD
GU| Bullish Structure | Waiting for 30M CHoCH + OB Mitigation(Refined & Structured):
• Pair: GBPUSD
• Bias: Bullish
• 4H Overview: Bullish structure is given with strong intent. A major higher high was broken to the upside. Price swept significant sell-side liquidity and inducement, then mitigated a refined 4H OB with a clean smart money reaction—clear buyer interest.
• 30M Structure: Currently watching for a proper change of character (CHoCH). Still in analysis mode. Waiting for the lower high on the 30M to be breached and liquidity taken before considering execution.
• Entry Zone: Once price confirms with a CHoCH and mitigates the 30M internal OB, I’ll drop to the 5M to hunt for final confirmation before executing.
• Targets: 5M to 30M structural highs depending on price delivery.
• Mindset Note: The best setups come to those who wait. No rush. Let price do the talking. My trigger isn’t just structure—it’s precision and patience working together.
GBPUSD is in the Selling Direction after Testing ResistanceHello Traders
In This Chart GBPUSD HOURLY Forex Forecast By FOREX PLANET
today GBPUSD analysis 👆
🟢This Chart includes_ (GBPUSD market update)
🟢What is The Next Opportunity on GBPUSD Market
🟢how to Enter to the Valid Entry With Assurance Profit
This CHART is For Trader's that Want to Improve Their Technical Analysis Skills and Their Trading By Understanding How To Analyze The Market Using Multiple Timeframes and Understanding The Bigger Picture on the Charts

GBPUSD I Its ready for the deeper pullback - COT OverviewHey what up traders welcome to the COT data and Liquidity report. It's always good to go with those who move the market here is what I see in their cards. I share my COT - order flow views every weekend.
🎯 Non Commercials added significant longs and closed shorts at the same time. So for that reason I see the highs as a liquidity for their longs profits taking.
📍Please be aware that institutions report data to the SEC on Tuesdays and data are reported on Fridays - so again we as retail traders have disadvantage, but there is possibility to read between the lines. Remember in the report is what they want you to see, that's why mostly price reverse on Wednesday after the report so their cards are hidden as long as possible. However if the trend is running you can read it and use for your advantage.
💊 Tip
if the level has confluence with the high volume on COT it can be strong support / Resistance.
👍 Hit like if you find this analysis helpful, and don't hesitate to comment with your opinions, charts or any questions.
Analysis done on the Tradenation Charts
Disclosure: I am part of Trade Nation's Influencer program and receive a monthly fee for using their TradingView charts in my analysis.
"Adapt what is useful, reject what is useless, and add what is specifically your own."
— David Perk aka Dave FX Hunter ⚔️

GBP/USD: Post-Impulse Sell Setup from Ending DiagonalThe chart depicts a completed 5-wave impulsive structure, culminating at the top of wave (5). The internal wave structure of the final fifth wave forms a classic ending diagonal pattern, typically signaling a trend reversal or deep correction.
After this extended fifth wave, the price has started rolling over, confirming the start of a corrective decline. The wave count now expects an ABC correction targeting the previous wave 4/2 demand zone, highlighted in red.
Target 1 (T1): 1.33608
Target 2 (T2): 1.32436
Stop Loss (SL): 1.35988
Ending diagonal at the top of wave (5) signals exhaustion of bullish momentum.
Clear bearish divergence (not shown here) is commonly seen with this pattern.
The price has broken the short-term structure and is now forming lower highs.
Target zone aligns with previous wave 2 consolidation – a typical retracement zone for post-impulse corrections.

GBPUSDPrice Action: A key support zone has been broken and is now acting as resistance.
Market Structure: Lower highs + lower lows forming → confirms downtrend.
Bias: Bearish while price stays under the broken level.
GBP/USD 4H Chart Analysis (Bearish Flag) Read the caption📉 GBP/USD 4H Chart Analysis
Pattern Identified: Bearish Flag Pattern
Timeframe: 4-Hour (4H)
Currency Pair: GBP/USD
🔍 Chart Explanation:
This chart illustrates a classic Bearish Flag Pattern, which is a continuation pattern signaling a potential further decline in price after a temporary consolidation.
Downtrend Leg (Flagpole):
The strong and sharp bearish move on the left side of the chart forms the flagpole, indicating aggressive selling pressure.
Consolidation (Flag Formation):
Price enters a rising channel (the flag) which reflects a short-term corrective phase or pullback. This consolidation occurs within the Resistance Zone, suggesting weakening bullish momentum.
Resistance Zone:
Marked in blue, this zone is where the price struggled to break above, and it acts as a ceiling. Rejection from this zone confirms bearish pressure and increases the likelihood of a breakdown.
Breakdown & Target Levels:
The chart shows that price has broken out downward from the flag pattern, triggering a continuation of the prior downtrend.
Two important support levels are highlighted:
🔸 1st Support: 1.33449 – This is the immediate target where price may pause or react.
🔸 2nd Support: 1.32408 – This is the extended target if selling pressure continues.
Ichimoku Cloud (Background):
The cloud behind the price action represents market sentiment. The red cloud suggests a bearish bias aligning with the flag pattern breakdown.
🧠 Technical Summary:
This setup favors a sell-side outlook. The rejection from resistance within a bearish flag and subsequent breakdown confirm bearish momentum. Traders may look for selling opportunities below the flag breakdown with targets at the mentioned support zones.

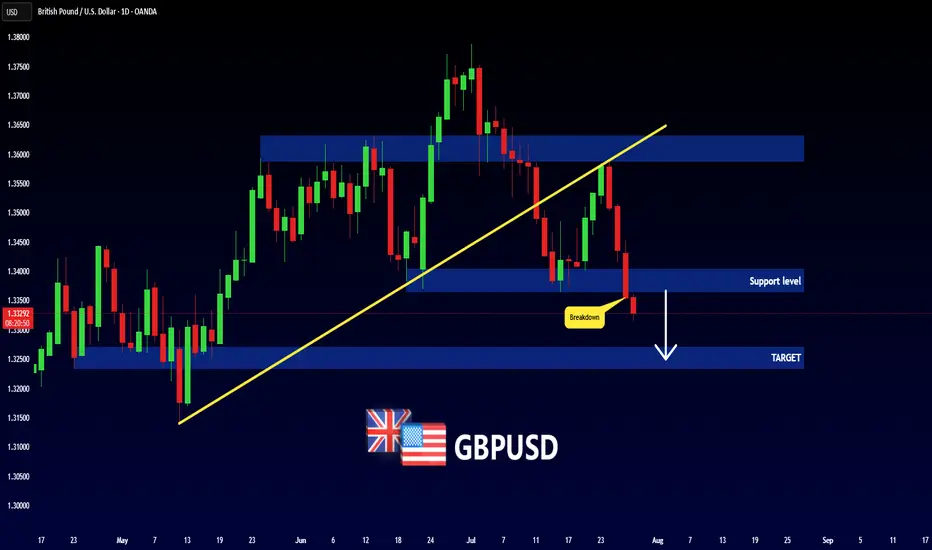
GBPUSD - NEW BREAKDOWN !Hello Traders !
The GBPUSD broke the support level (1.34037 - 1.33650).
This key level becomes new resistance!
So, I expect a bearish move📉
_______________
TARGET: 1.32710🎯
#GBPUSD ALMAZOV PROJECTION DAILYPrice projection according to Almazov's theory, #GBPUSD should at least touch $1.31500 - before going up, we wait for the initial condition to enter a long position, to reach the Daily Spike f 261.8.

GBP/USD Technical Breakdown – Bearish Reversal in PlayWe're closely watching the British pound vs the US dollar on the daily chart, and recent developments are signaling a notable shift in momentum:
🔹 Break of the 2025 uptrend
🔹 Completion of a Head & Shoulders top — a classic bearish reversal pattern
🔹 Neckline break confirms downside risk
This formation implies a measured move target from ~1.34–1.38, projecting a decline of 400 pips to around 1.30, aligning neatly with the 200-day moving average at 1.2977.
🧭 Trading Strategy:
While the initial breakdown is bearish, the RSI shows bullish divergence, suggesting a short-term bounce before resumption of downside.
Key resistance levels to watch for re-entry opportunities:
• 📌 1.3435 – previous highs (late 2024)
• 📌 1.3485 – broken uptrend
• 📌 1.3510 – 55-day moving average
• 📌 1.3530 – short-term downtrend line
🎯 A rally into this zone would offer a strategic entry point for downside exposure.
Let us know how you're trading this move — are you fading the rally or waiting for confirmation?
Disclaimer:
The information posted on Trading View is for informative purposes and is not intended to constitute advice in any form, including but not limited to investment, accounting, tax, legal or regulatory advice. The information therefore has no regard to the specific investment objectives, financial situation or particular needs of any specific recipient. Opinions expressed are our current opinions as of the date appearing on Trading View only. All illustrations, forecasts or hypothetical data are for illustrative purposes only. The Society of Technical Analysts Ltd does not make representation that the information provided is appropriate for use in all jurisdictions or by all Investors or other potential Investors. Parties are therefore responsible for compliance with applicable local laws and regulations. The Society of Technical Analysts will not be held liable for any loss or damage resulting directly or indirectly from the use of any information on this site.

Hear me out... I've not been posting much (welcome to adhd/autistic life), but if anyone ever drops me a message, I'm always still trading, so feel free to ask me any questions ever :)
So while much of the tariff movement was priced in with the recent drop from the top (1.38 range), we could (and have seen) an expected fall out, with today being the official tariff announcement/last day from Trump.
This afternoon we have NFP, unemployment rate and PMI.
Based on where we are from a TA standpoint, I imagine these to be positive for GBPUSD (least not much more downfall anytime soon/ much lower than where we bottomed out today).
I'm going to update this idea with further notes, but you can see what we're currently working with and get an idea based on the chart what I'm thinking.
We've got the small H&S pattern at work (neckline #1), and a potentially bigger one at play (neckline #2), and then a previous one which I will discuss in the notes (neckline #3).
You can see across the chart a number of downward resistance lines (red).
I've shown them to express that we can see that every time we cross over the line, while it might bounce off it and then keep dipping further, it never crosses back under.
The only time it does cross back over is usually quite briefly (as per the orange arrows), but it's always short lived.
Case and point, we're not only very close to the current resistance-turned-support red line, but we're also hitting major support area.
This paired with such a big drop out (i.e. we could do with at least some short/mid term reversal) and the possibility of a retest of neckline #1, we've got plenty to work with.
You can see I've posted 2 arrows - one GREEN, the other WHITE.
I'll explain my thesis on that at some point and why I think it could easily cross back over the neckline before continuing to the downside.
We've also got the thin purple lines, which as you can see previously act as a resistance to where the reversal will happen at the lower end of the chart (which lines up with the major support line on the weekly chart, which I'll add to the notes at some point too.
Let me your thoughts.
I have a position open from today's drop to neckline #2, so let's see where it takes us :)

GBP/USD 1H Trade Setup – Bullish Reversal OpportunityCurrently observing the GBP/USD pair on the 1-hour timeframe.
🔹 The overall trend is still bearish, but a bullish divergence has already formed—indicating a potential reversal.
🔹 We're adopting a neutral bias for now and planning a BUY STOP entry at the breakout of the previous Lower High (LH).
🔹 If the breakout confirms, this could mark the beginning of a bullish trend shift.
📌 Trade Setup Details:
Pair: GBP/USD
Timeframe: 1H
Trend: Bearish
Divergence: Bullish
Bias: Neutral
Strategy: BUY STOP at LH Breakout
💼 Trade Parameters:
🔸 Entry (EP): 1.33669
🔸 Stop Loss (SL): 1.33027
🎯 Take Profit 1 (TP1): 1.34311 (R:R 1:1)
🎯 Take Profit 2 (TP2): 1.34953 (R:R 1:2)
📊 Position Size: 0.15 LOT
💰 Risk per Trade: $200
💵 Reward Target: Up to $300
🧠 Execution: Splitting into two trades – one targeting TP1, the other TP2
📎 Why We Like This Setup:
✅ Bullish divergence suggests weakening bearish momentum
✅ Breakout above LH could confirm bullish reversal
✅ Clean structure with clearly defined SL and TP
✅ Strategic split-exit improves risk-to-reward flexibility
💬 Comment and share your thoughts on this trade!
🔔 Follow me for more high-probability setups and technical insights. Let’s grow together! 🚀
💬 Let us know if you're watching this setup too!
#GBPUSD #ForexSetup #ForexSignals #PriceActionTrading #TrendReversal #ForexStrategy #TechnicalAnalysis #SmartMoneyConcepts #DivergenceTrading #BullishSetup #BuyTheBreakout #ChartPattern #1HourChart #ForexMarket #RiskReward #ForexTradeSetup #ForexEntry #TradeIdeas #FXTrading #SwingTrading #BreakoutStrategy #MarketStructure #TradingPlan #TradersMindset #TradingCommunity
