GBPUSD trade ideas

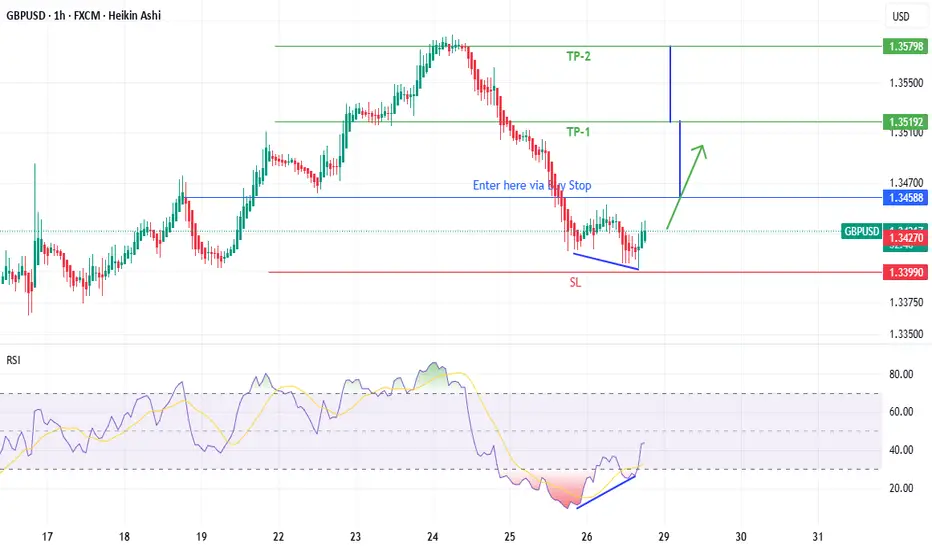
GBPUSD Bullish Trade- Spotted Valid Bullish Divergence on 1-H time frame
- Buy stop entry will be made when the bearish trend is overtaken by Bullish trend with the break of last LH

GBPUSD: Can This Zone Hold the Line?Price has returned to a familiar shelf near 1.3410, previously acting as support.
We’re watching to see if bulls defend this zone or if price breaks through and pushes lower.
200 MA still above—short-term trend remains bearish
But structure shows potential for a bounce

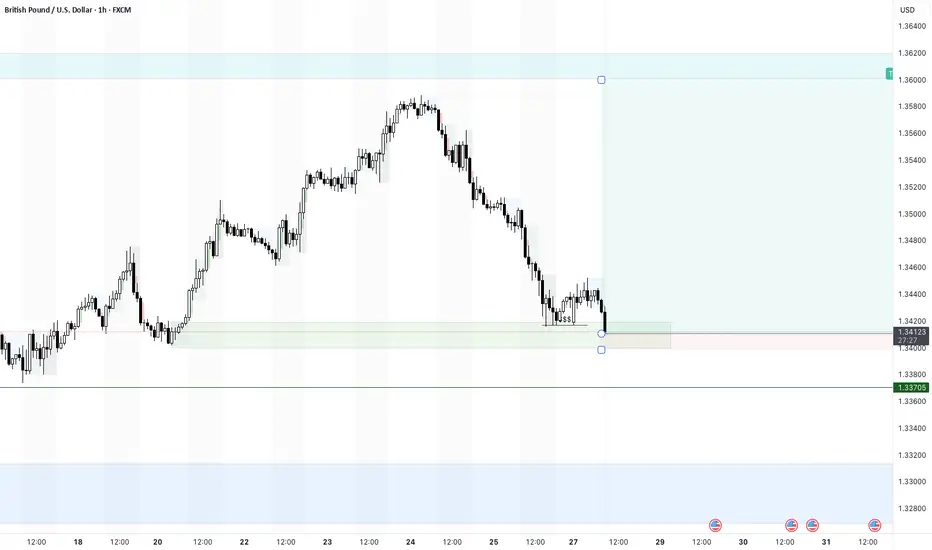
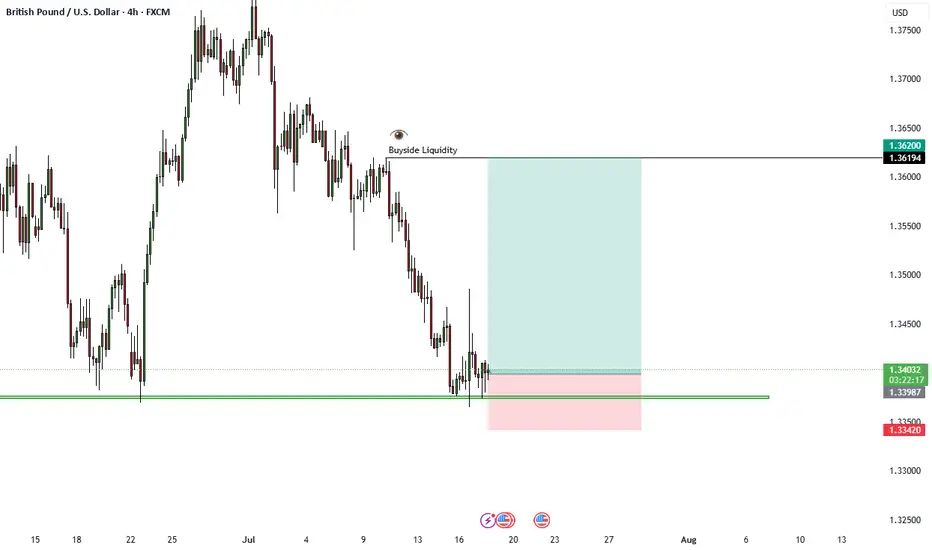
GBPUSD 28/7/25- Sweep and bullishI highlighted the equal liquidity zone and places a buy limit order.
This has been triggered and now will see if it holds.

GBPUSD💹 GBP/USD Trade Analysis – Sell Setup
📍 Trade Idea: Initiating a short (sell) position on GBP/USD at the current market level.
---
🔽 Entry Zone
Suggested Entry: 1.34393
This level aligns with a minor resistance area formed by recent price rejection. It offers an optimal spot for initiating short positions, especially after confirmation of bearish pressure in lower timeframes.
---
📉 Stop Loss
Suggested Stop Loss: 1.34900 (above key resistance zone)
The stop loss is placed just above a strong resistance level to prevent premature exits. This level has historically acted as a barrier, making it a reliable invalidation point for the trade setup.
---
🎯 Take Profit Targets
TP1: 1.34215 – A modest first target based on recent intraday support.
TP2: 1.34125 – A deeper pullback zone where price has previously found temporary support.
TP3: 1.34000 – A psychologically and technically significant round number with historic support relevance.
GBPUSD(20250728)Today's AnalysisMarket news:
Trump announced that the US and Europe reached a trade agreement: 15% tariffs on the EU, $600 billion in investment in the US, zero tariffs on the US by EU countries, the EU will purchase US military equipment, and will purchase US energy products worth $750 billion. However, the US and Europe have different opinions on whether the 15% tariff agreement covers medicines and steel and aluminum. Von der Leyen: 15% tariff rate is the best result that the European Commission can achieve.
US Secretary of Commerce: The deadline for tariff increase on August 1 will not be extended. The United States will determine the tariff policy on chips within two weeks.
Technical analysis:
Today's buying and selling boundaries:
1.3462
Support and resistance levels:
1.3578
1.3535
1.3507
1.3417
1.3389
1.3346
Trading strategy:
If the price breaks through 1.3462, consider buying, the first target price is 1.3507
If the price breaks through 1.3417, consider selling, the first target price is 1.3389

GBPUSD | Bullish Bias - Midframe Alignment After SSL SweepPair: GBPUSD
Bias: Bullish
HTF Overview (4H):
Price structure is clearly bullish with strong intent. Looking to ride momentum as price continues toward 30M and 4H highs.
LTF Confirmation (30M):
Structure has been refined. Price swept sell-side liquidity and cleanly mitigated a key 30M OB — now I’m monitoring for LTF alignment to catch the continuation.
Entry Zone: Waiting for 5M CHoCH to flip bullish. Entry comes on the pullback into demand once the shift confirms.
Targets: 5M highs, 30M highs — trailing based on delivery and momentum
Mindset Note: No emotion, no forcing. Waiting for alignment from Smart Money and letting price invite me in. Clarity leads, execution follows.

GBPUSD BUYGBP/USD drops to 1.3450 area after weak UK Retail Sales data
GBP/USD continues to push lower after closing in negative territory on Thursday and trades near 1.3450 on Friday. Weaker-than-expected Retail Sales data from the UK and the broad-based US Dollar strength forces the pair to stay on the back foot heading into the weekend
GBP/USD came under bearish pressure on Thursday and lost more than 0.5%, snapping a three-day winning streak in the process. The pair extends its slide on Friday and trades below 1.3500.
The renewed US Dollar (USD) strength weighed on GBP/USD on Thursday. The US Department of Labor reported that the number of first-time applications for unemployment benefits declined to 217,000 in the week ending July 19 from 221,000 in the previous week. This reading came in better than the market expectation of 227,000. Additionally, the S&P Global Composite Purchasing Managers Index (PMI) improved to 54.6 (preliminary) in July from 52.9 in June, reflecting an ongoing expansion in the private sector's business activity, at an accelerating pace.
Meanwhile, the EUR/GBP cross rose more than 0.3% on Thursday as the Euro benefited from the European Central Bank's (ECB) cautious tone on policy-easing. EUR/GBP preserves its bullish momentum and trades at its highest level since early April above 0.8700 on Friday, suggesting that the Euro continues to capture capital outflows out of Pound Sterling.
Early Friday, the UK's Office for National Statistics reported that Retail Sales rose by 0.9% on a monthly basis in June. This reading followed the 2.8% decrease recorded in May but came in worse than the market expectation for an increase of 1.2%, making it difficult for GBP/USD to stage a rebound.
In the second half of the day, Durable Goods Orders data for June will be the only data featured in the US economic calendar. Nevertheless, this data is unlikely to have a long-lasting impact on the USD's valuation.
SUPPORT 1.34550
SUPPORT 1.34982
SUPPORT 1.35421
RESISTANCE 1.33990
RESISTANCE 1.33698

GBPUSD TRADE SETUPWait for retest the entry level and Bearish momentum then take a trade for Sell otherwise skip this setup

GBPUSD – NEW WEEK TECHNICAL BIAS (Market Open) REVIEW SUMMARY
▪︎ HTFs maintain a bullish stance — no confirmed violation yet.
▪︎ On the 4H, Price is unfolding within a Descend Sequence targeting a key Price Base (purple support zone). This opens up multiple tactical scenarios:
1️⃣ Rejection Zone has activated — if sustained, I expect a bullish drive above the OCZ, potentially reaching the IPT.
2️⃣ Failure to sustain may lead to a sweep into the pending ARB at 1.3303 — a potential launch zone for bullish reengagement.
3️⃣ A confirmed structural breach below 1.3303 may activate a bearish move toward the PIZ around 1.3084.
📍Focus remains on reaction zones and microstructure shifts to initiate tactical, high Reward setup(s).
🚨 IntelEdge note: This is not financial advice. These are observational market insights requiring personal validation before acting. Always trade responsibly.

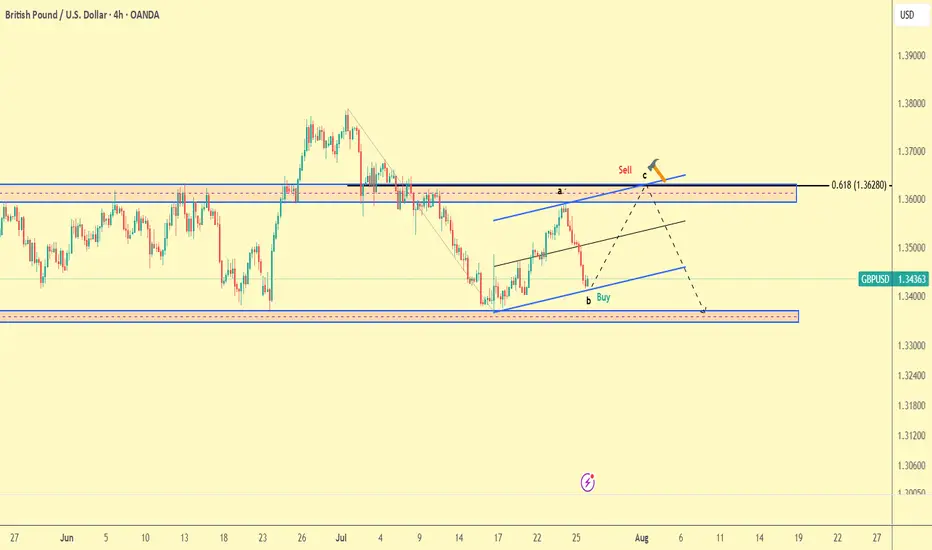
GBPUSD Trade plan 27/07/2025Dear Trader,
The pound has entered a corrective phase, and it seems that the corrective phase will continue. The current zone is a good area for buying until the 1.36 zone. At the 0.618 Fibonacci level, considering the channel's peak and the resistance zone, I expect a drop to the 1.33000 region.
Regards,
Alireza!
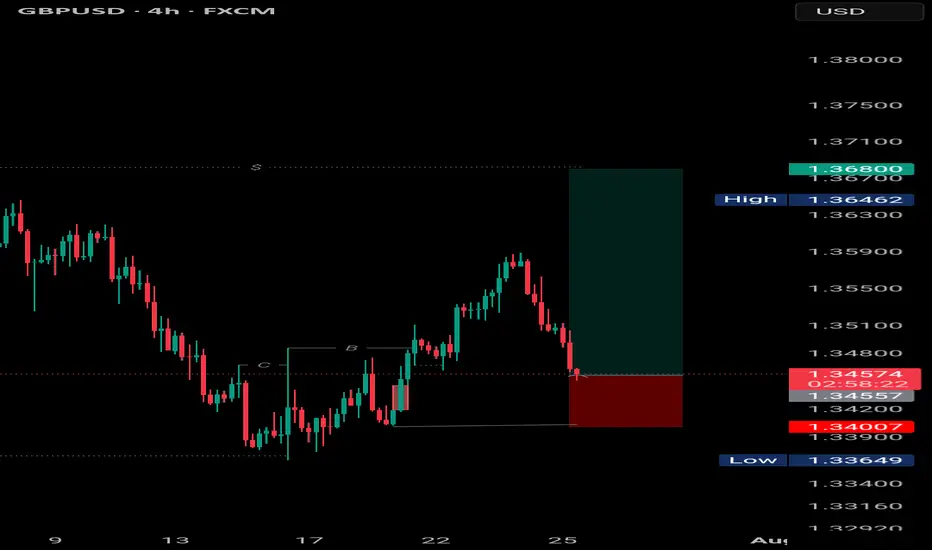
GBPUSD | Bullish Reversal Setup GBPUSD | Bullish Reversal Setup
Price tapped into previous demand zone after forming a clear BOS (Break of Structure). Anticipating a bullish move towards 1.36800.
Entry at key support with a clean RR. Watching closely for momentum confirmation.
#GBPUSD #SmartMoney #ForexTrading #PriceAction #EranseCapital
POUND DOLLAR LONG CONTINUATIONMarket Outlook: GBP/USD
25th July 2025.
The Pound-Dollar pair continues to maintain a bullish market structure, and our approach remains aligned with the prevailing trend. Recently, the price traded above a key 4-hour high, triggering a deeper pullback into discount pricing within the currently active H4 demand zone.
We are now observing price action closely, as this H4 demand level holds potential to serve as the launch point for the next bullish swing. As long as the structure remains intact, we remain buyers from this zone — anticipating a continuation of the upward momentum.

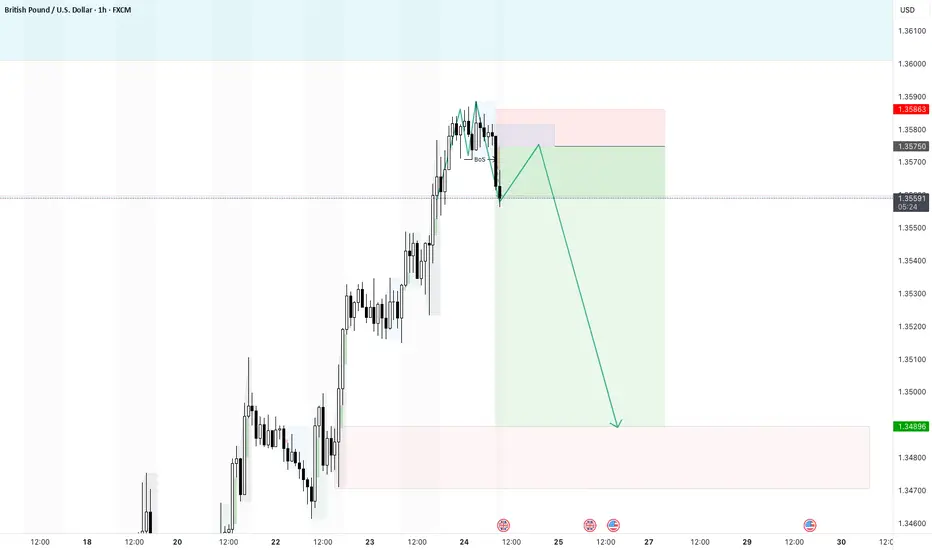
Pull back on GBPUSDThe clear break of structure gives me confidence that a short trade is possible today. Ideally i want a retest of the imbalance and then a push down. My TP is quite far at the moment and i may take profit earlier or move my SL.
GBP/USD Retraces to Demand — Buy Setup FormingHello traders!
Price has been in a strong bullish trend throughout the week.
After forming a demand zone around 1.35300 and retracing back to it, we are looking to take a buy position in this area.
Manage your risk and trade safe!
Buy zone for GBP USDEasy buy on GBP_ Very good entry point after a massive rally,,, pull back zone.. and its a careful buy point

GBPUSD Will Go Higher! Long!
Take a look at our analysis for GBPUSD.
Time Frame: 4h
Current Trend: Bullish
Sentiment: Oversold (based on 7-period RSI)
Forecast: Bullish
The market is approaching a key horizontal level 1.344.
Considering the today's price action, probabilities will be high to see a movement to 1.351.
P.S
Please, note that an oversold/overbought condition can last for a long time, and therefore being oversold/overbought doesn't mean a price rally will come soon, or at all.
Disclosure: I am part of Trade Nation's Influencer program and receive a monthly fee for using their TradingView charts in my analysis.
Like and subscribe and comment my ideas if you enjoy them!

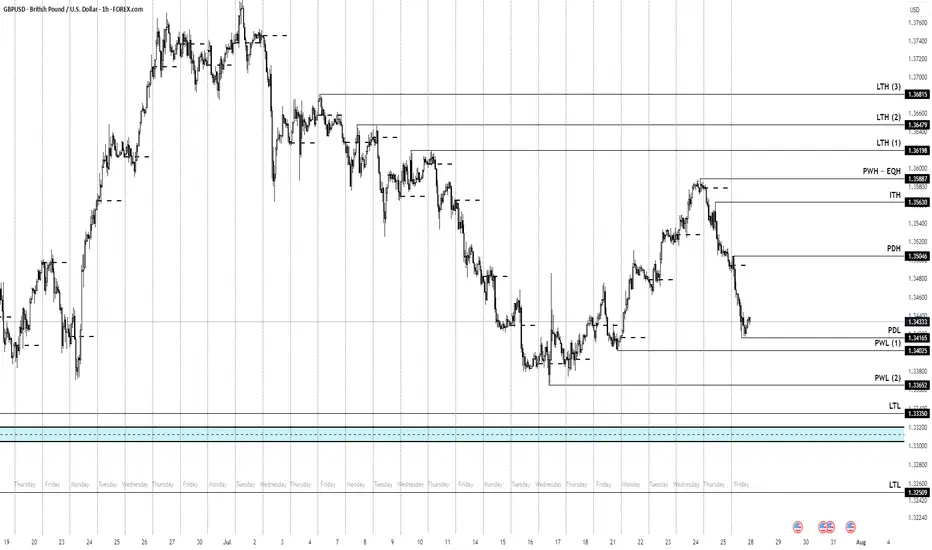
Cable Price Points to keep track off going into NFP/FOMC weekHeading into NFP week we have mixed bias.
Daily sais : BEARISH
Weekly is BULLISH (specially that we closed respecting a +FVG)
Ofc, being an NFP week we trade with care.
Nevertheless i highlighted some key Highs and Lows to keep track of.
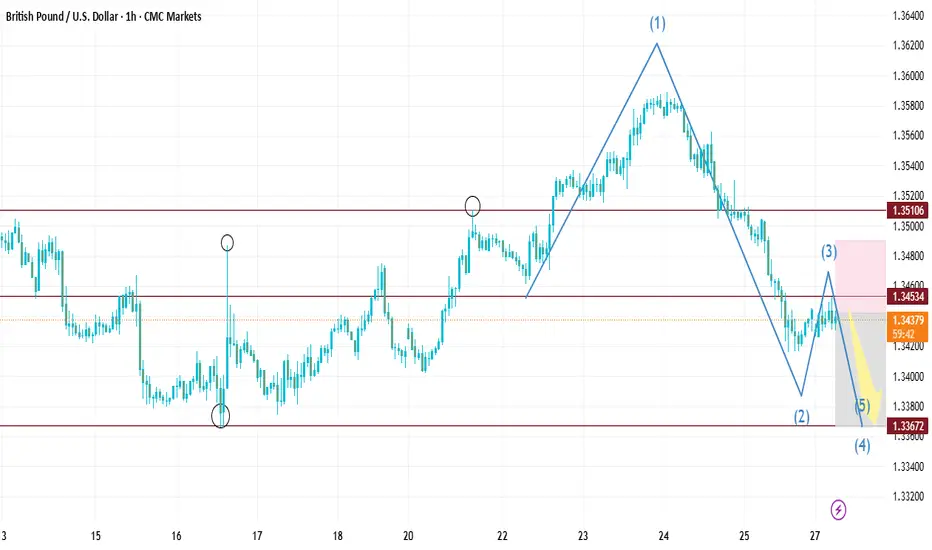
Short Opportunity on GBPUSD – Technical & Fundamentals AlignToday I want to look at the Short position opportunity in GBPUSD ( FX:GBPUSD ). So let's take a look at the GBPUSD pair from a fundamental and technical perspective.
Fundamental Analysis:
The British Pound remains under pressure due to growing expectations of a 25–50 bps rate cut by the Bank of England in early August. Markets are increasingly leaning toward easing as UK inflation hit 3.6% in June, the highest in over a year, while economic growth weakened and consumer confidence dropped to its lowest since early 2024
Ongoing fiscal concerns, including potential tax hikes and budget instability, continue to weigh on the pound. In contrast, the US Dollar( TVC:DXY ) remains relatively robust—supported by strong economic data and a safe-haven preference amid global uncertainty
Summary:
BoE easing becomes more likely due to weak UK data and inflation.
Fiscal risks and low consumer sentiment add downward pressure on GBP.
USD strength from solid data and safe-haven demand supports further GBPUSD downside.
-------------------------
In terms of technical analysis , in the 1-hour timeframe , GBPUSD is approaching the Resistance zone($1.356-$1.350) , the Potential Reversal Zone(PRZ) , and the 50_SMA(Daily) . Meanwhile, this return to Important Support lines could act as a pullback to these lines. Important support lines and 50_SMA(Daily) were broken last week.
In terms of Elliott Wave theory , GBPUSD appears to be completing a main wave 4 . Main wave 4 is likely to have a Zigzag Correction(ABC/5-3-5) .
I expect GBPUSD to start declining from the Potential Reversal Zone(PRZ) and reach the targets I have marked on the chart.
Note: Stop Loss(SL): 1.3575USD = Worst Stop Loss(SL)
Please respect each other's ideas and express them politely if you agree or disagree.
British Pound / U.S Dollar Analysis (GBPUSD), 1-hour time frame.
Be sure to follow the updated ideas.
Do not forget to put a Stop loss for your positions (For every position you want to open).
Please follow your strategy and updates; this is just my Idea, and I will gladly see your ideas in this post.
Please do not forget the ✅' like '✅ button 🙏😊 & Share it with your friends; thanks, and Trade safe.

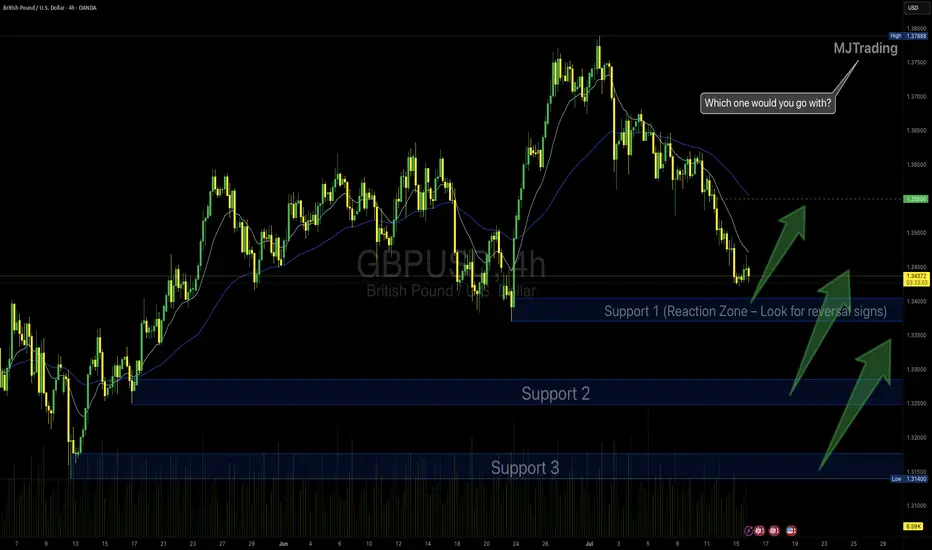
GBPUSD Idea – Demand Zones & Potential Reversal Play🧠 MJTrading:
After a steady downtrend, GBPUSD is now approaching a strong 4H demand zone (Support 1), where we previously saw explosive bullish reactions.
Price is also extended from both EMAs, showing potential for a technical pullback or full reversal.
💡Scenarios to consider:
🔹 If Support 1 holds → we may see a bounce toward 1.3500+
🔹 If broken → Support 2 & 3 offer deeper liquidity and high-probability demand zones
👀 Watch for:
Bullish reversal candles (engulfing / hammer)
Bullish divergence on lower timeframes
Volume spikes on reaction
⚠️ Invalidation:
If Support 3 breaks with strong momentum, we might enter a bearish continuation phase.
#GBPUSD #Forex #ChartDesigner #SmartMoney #PriceAction #MJTrading #ForexSetup #TrendReversal #SupportZones