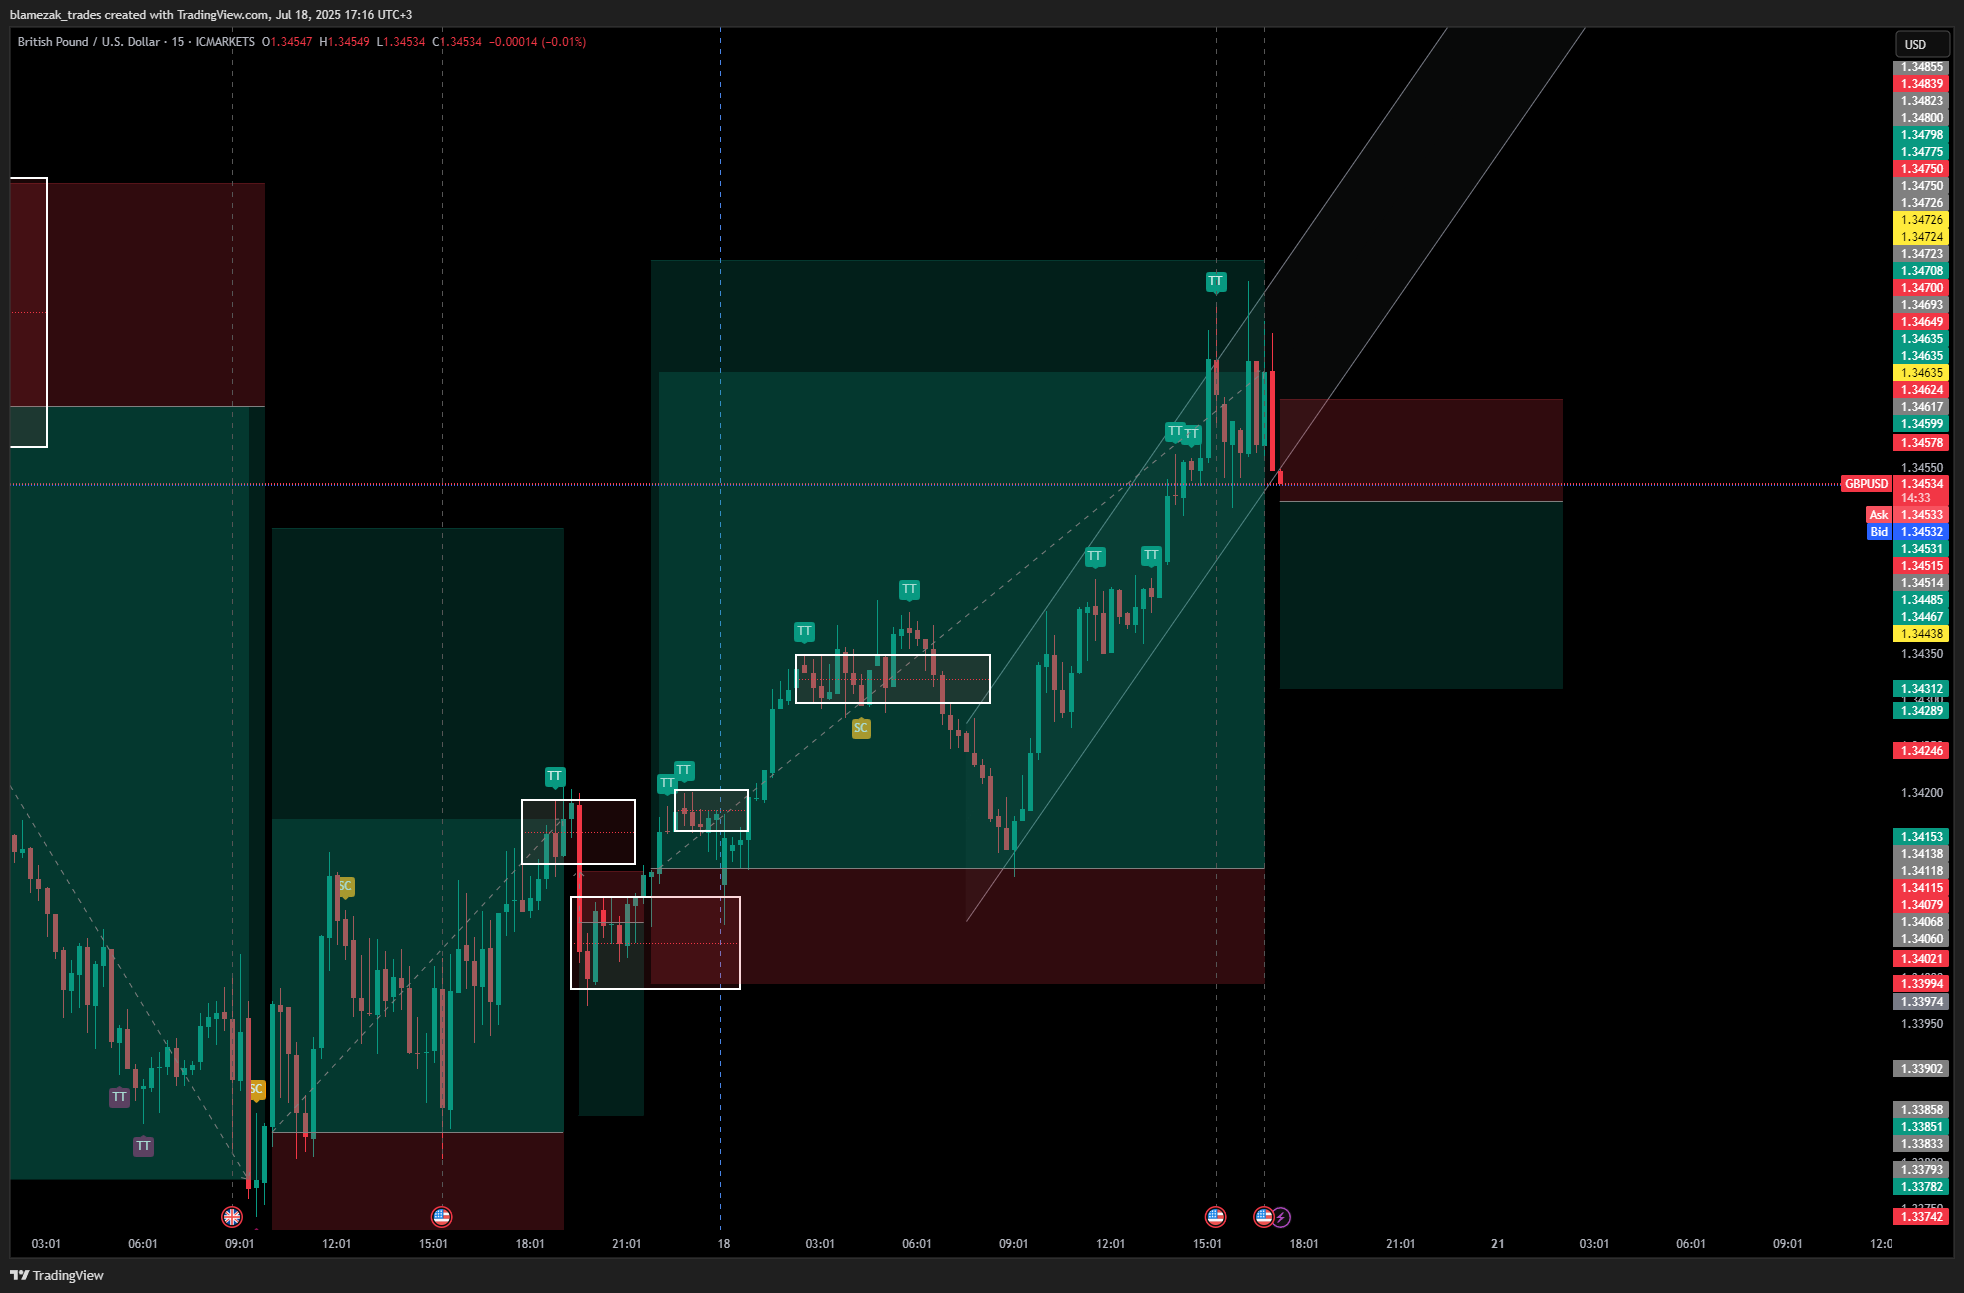
blamezak_trades3 hours agoGBPUSD Some Steel Ball shit going on in there at a low pace, before the close of Market in 30 mins! Have a great weekend traders! C ya'll the next week.
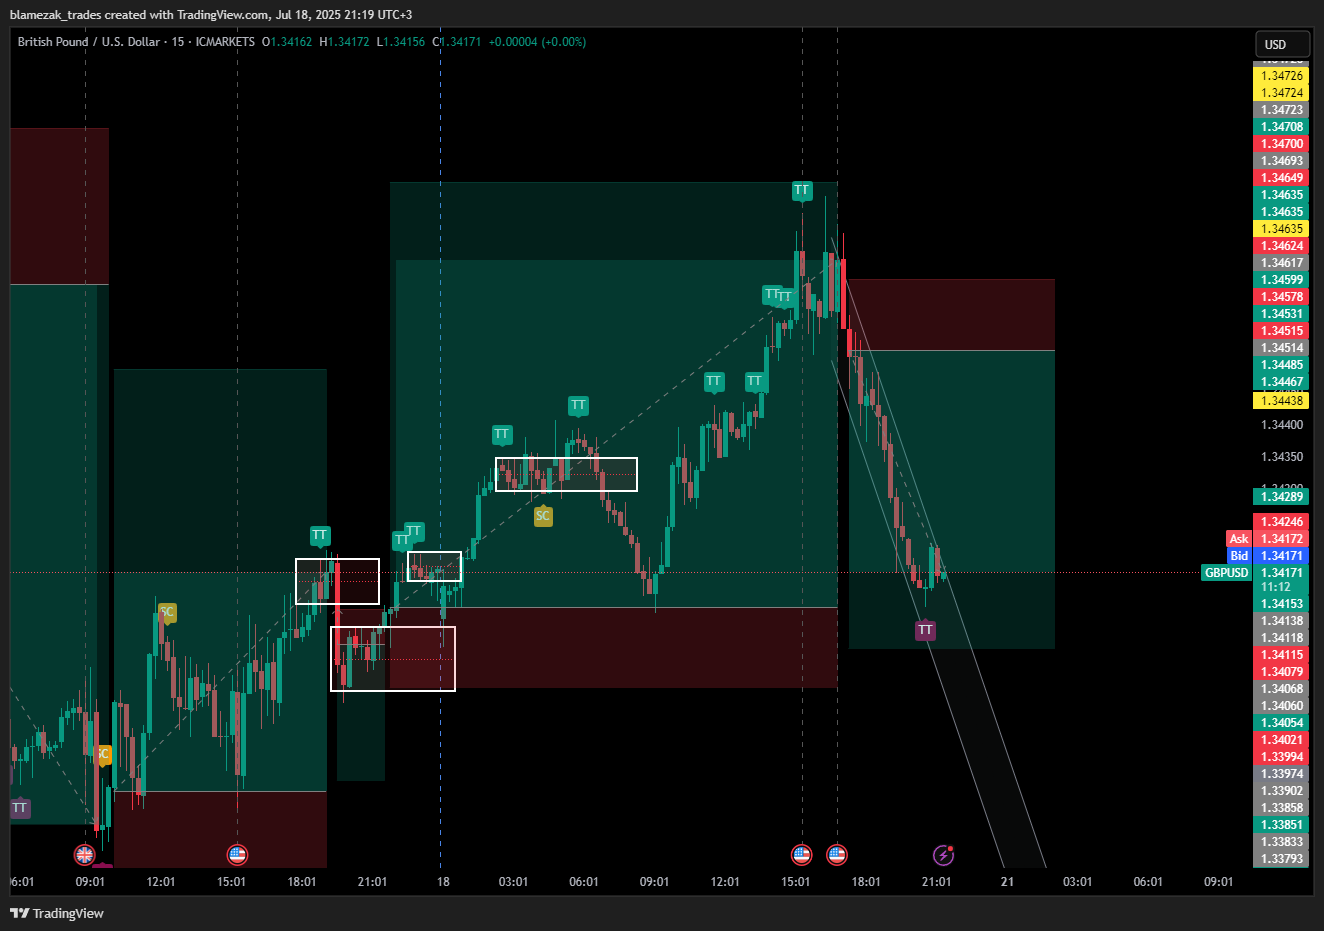
blamezak_trades5 hours agoGBPUSD We are back into Sell Side Targets! Look for reactions at this area!