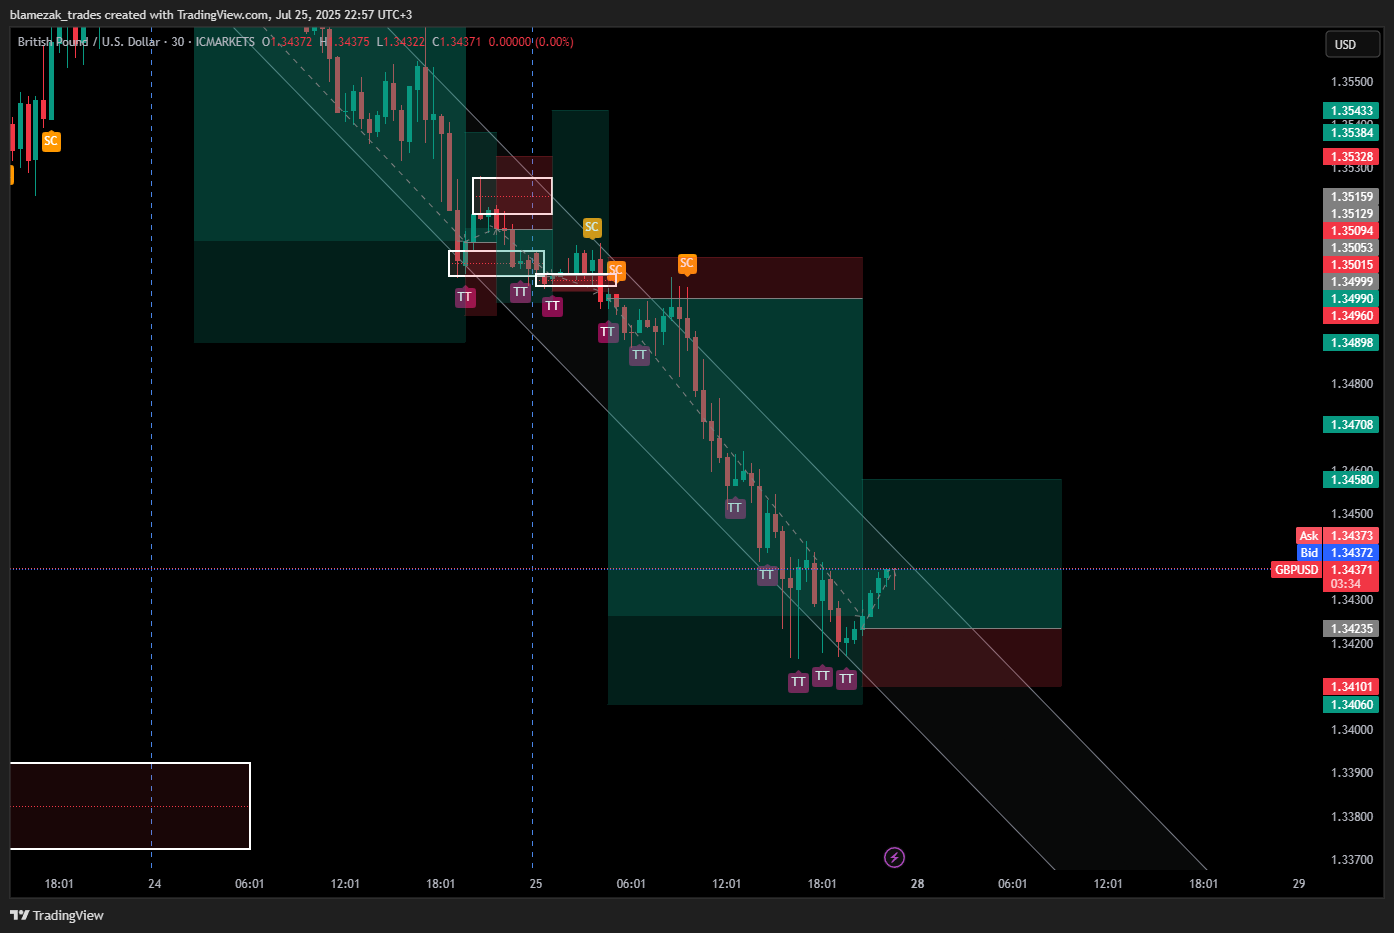
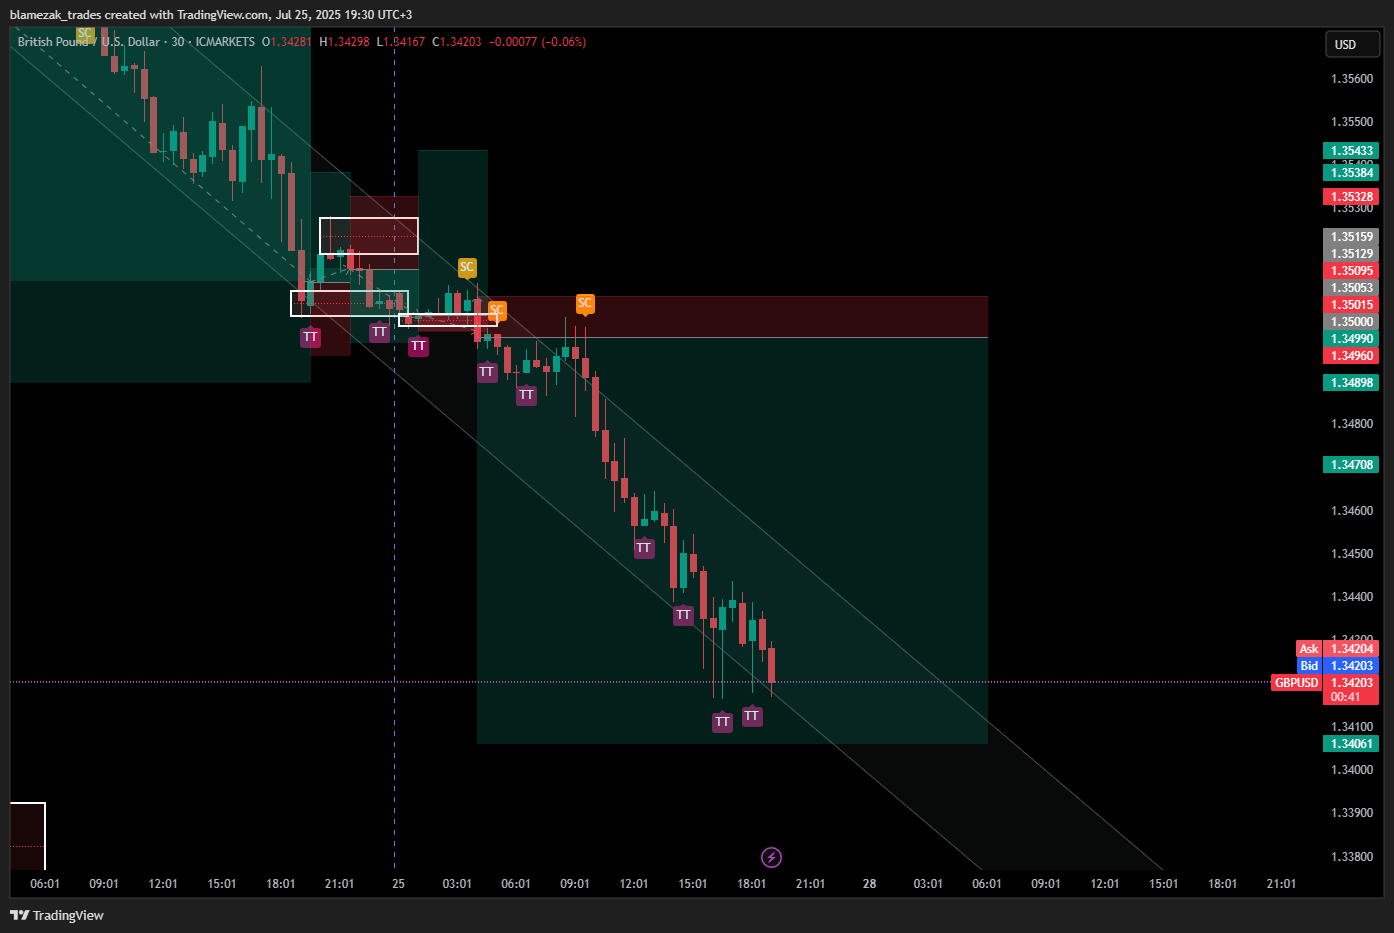
GBPUSD it was a beautiful ride down secured a awesome amount i don't want to stay open over the weekend so took an exist will enter again on monday where there is a pull back if the market is still heading lower and if not then will analyse for the next move....
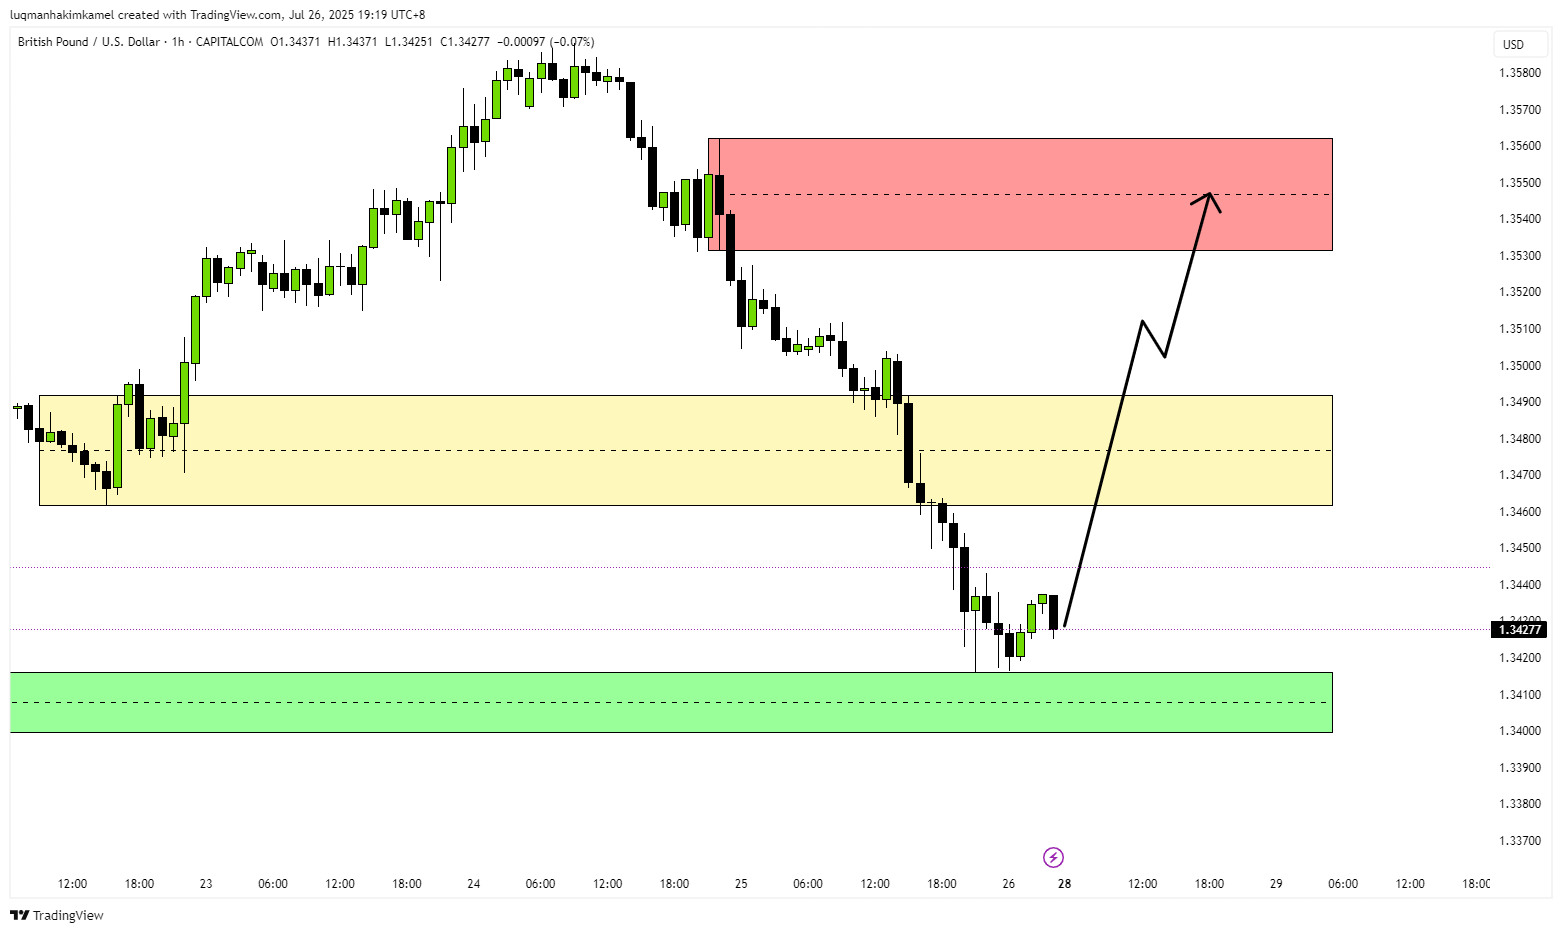
GBPUSD Already in the BUY, counter trades are the key to catch a large move. Yet they are very risky like a small fish trying to escape from the powerful jaws of a shark, risking getting stuck in its teeth.
And its Friday! So don't become the weekend party meal.