GBPUSD Breakdown The Ascending Channel selling strong 📉 GBPUSD Breakdown Alert
– 4H Timeframe
Cable has broken down from the ascending channel with a strong bearish candle, confirming seller strength. We're now eyeing short setups from 1.34400.
🎯 Technical Targets
🔻 1st Target: 1.33500 – Demand Zone
🔻 2nd Target: 1.32700 – Demand Zone
🔻 3rd Target: 1.31800 – Major Support
🛑 Stop Loss: 1.36000 – Bearish Order Block (OB)
🔥 Bias: Bearish
🕓 Timeframe: 4H
💡 Strategy: Sell the pullback, ride the momentum.
—
💬 Like, comment, and follow for more updates!
🚀 Join our trading squad and level up your analysis!
#GBPUSD #ForexSignals #PriceAction #LiviaTrades 😜
GBPUSD_SPT trade ideas

GBPUSD Will Move Lower! Sell!
Please, check our technical outlook for GBPUSD.
Time Frame: 1D
Current Trend: Bearish
Sentiment: Overbought (based on 7-period RSI)
Forecast: Bearish
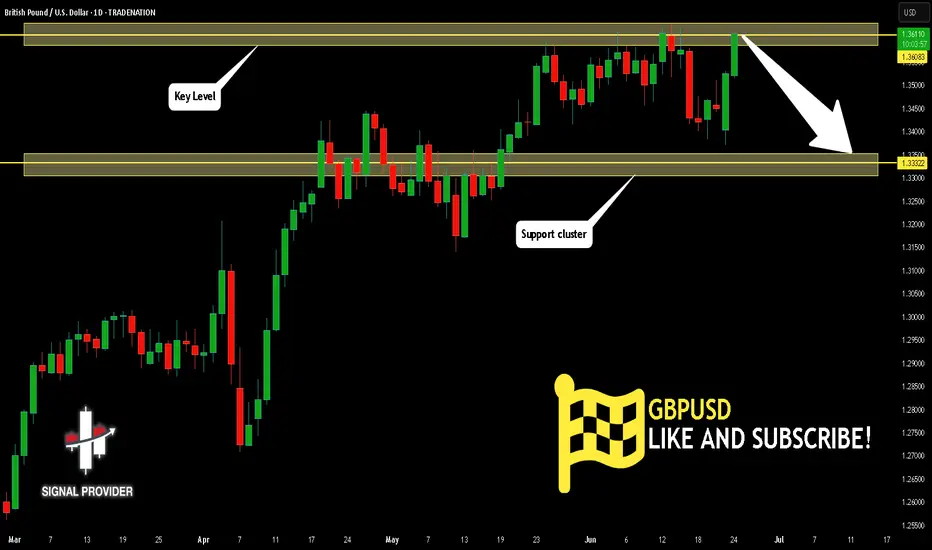
The market is approaching a key horizontal level 1.360.
Considering the today's price action, probabilities will be high to see a movement to 1.333.
P.S
Please, note that an oversold/overbought condition can last for a long time, and therefore being oversold/overbought doesn't mean a price rally will come soon, or at all.
Disclosure: I am part of Trade Nation's Influencer program and receive a monthly fee for using their TradingView charts in my analysis.
Like and subscribe and comment my ideas if you enjoy them!
GBPUSD SHORT FORECAST Q2 W26 D24 Y25GBPUSD SHORT FORECAST Q2 W26 D24 Y25
Professional Risk Managers👋
Welcome back to another FRGNT chart update📈
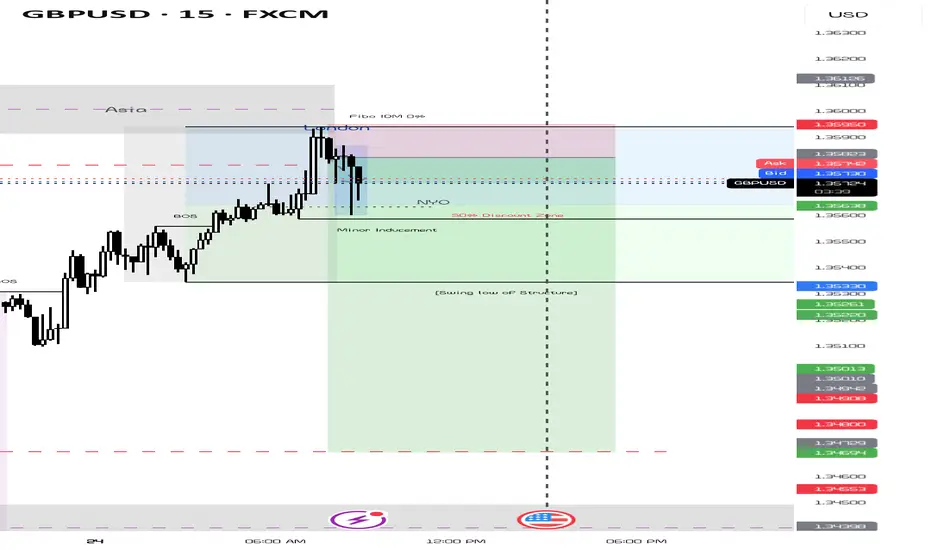
Diving into some Forex setups using predominantly higher time frame order blocks alongside confirmation breaks of structure.
Let’s see what price action is telling us today!
💡Here are some trade confluences📝
✅Daily order block
✅1H Order block
✅Intraday breaks of structure
✅4H Order block
🔑 Remember, to participate in trading comes always with a degree of risk, therefore as professional risk managers it remains vital that we stick to our risk management plan as well as our trading strategies.
📈The rest, we leave to the balance of probabilities.
💡Fail to plan. Plan to fail.
🏆It has always been that simple.
❤️Good luck with your trading journey, I shall see you at the very top.
🎯Trade consistent, FRGNT X

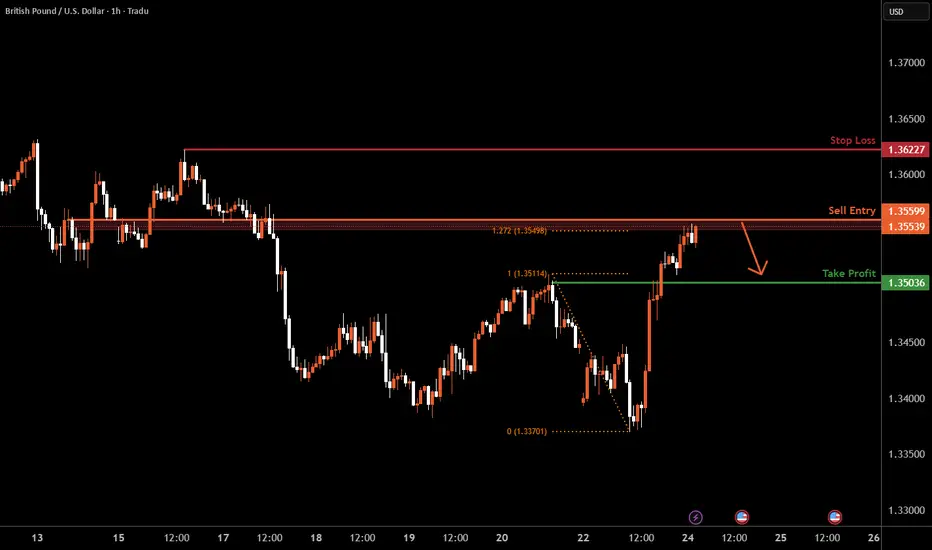
GBPUSD H1 I Bearish Reversal Based on the H4 chart, the price is trading near our sell entry level at 1.3559, a pullback resistance that aligns with the127.2Fib extension.
Our take profit is set at 1.3503, a pullback support.
The stop loss is set at 1.3622, a swing high resistance.
High Risk Investment Warning
Trading Forex/CFDs on margin carries a high level of risk and may not be suitable for all investors. Leverage can work against you.
Stratos Markets Limited (tradu.com ):
CFDs are complex instruments and come with a high risk of losing money rapidly due to leverage. 63% of retail investor accounts lose money when trading CFDs with this provider. You should consider whether you understand how CFDs work and whether you can afford to take the high risk of losing your money.
Stratos Europe Ltd (tradu.com ):
CFDs are complex instruments and come with a high risk of losing money rapidly due to leverage. 63% of retail investor accounts lose money when trading CFDs with this provider. You should consider whether you understand how CFDs work and whether you can afford to take the high risk of losing your money.
Stratos Global LLC (tradu.com ):
Losses can exceed deposits.
Please be advised that the information presented on TradingView is provided to Tradu (‘Company’, ‘we’) by a third-party provider (‘TFA Global Pte Ltd’). Please be reminded that you are solely responsible for the trading decisions on your account. There is a very high degree of risk involved in trading. Any information and/or content is intended entirely for research, educational and informational purposes only and does not constitute investment or consultation advice or investment strategy. The information is not tailored to the investment needs of any specific person and therefore does not involve a consideration of any of the investment objectives, financial situation or needs of any viewer that may receive it. Kindly also note that past performance is not a reliable indicator of future results. Actual results may differ materially from those anticipated in forward-looking or past performance statements. We assume no liability as to the accuracy or completeness of any of the information and/or content provided herein and the Company cannot be held responsible for any omission, mistake nor for any loss or damage including without limitation to any loss of profit which may arise from reliance on any information supplied by TFA Global Pte Ltd.
The speaker(s) is neither an employee, agent nor representative of Tradu and is therefore acting independently. The opinions given are their own, constitute general market commentary, and do not constitute the opinion or advice of Tradu or any form of personal or investment advice. Tradu neither endorses nor guarantees offerings of third-party speakers, nor is Tradu responsible for the content, veracity or opinions of third-party speakers, presenters or participants.
GBP/USD 4H – Bearish Supply Zone Reaction SetupTrade Breakdown:
Price broke structure to the downside after rejecting the 4H supply zone around 1.35800, creating bearish momentum. We’ve now pulled back aggressively into that same supply zone, aligning with a clean imbalance just above 1.35577. This area is now prime for a reversal.
I’m looking for a bearish engulfing confirmation or strong rejection wick inside the zone to enter short. Once confirmed, this could be a clean swing back to the imbalance fill and potential target zone at 1.33352.
Imbalance:
Clear imbalance left just below 1.35577, sitting right inside the supply zone. Expecting price to mitigate this inefficiency before resuming bearish pressure.
Entry Criteria:
Only entering if a bearish engulfing forms within the supply zone. No confirmation = no trade. ✅
SL: 1.35868
TP: 1.33352
RR: 7.65:1
Bias: Bearish 🔻
Session: London / NY overlap preferred for execution
⸻
🖊️ Trade Simple. Live Lavish.™ – Jaquil Taylor

The area above recent highs, where buy stops are likely resting.BSL (Buy-Side Liquidity):
The area above recent highs, where buy stops are likely resting.
Marked near the 1.36200–1.36400 zone.
The price is projected to sweep this area.
SSL (Sell-Side Liquidity):
The area below previous lows, where sell stops are likely resting.
Marked near the 1.33600–1.33800 zone.
Price previously swept this level before a sharp move upward.
Market Behavior Analysis:
Liquidity Sweep Pattern:
The price dipped below the SSL zone (stop-hunting weak longs).
A strong bullish move followed, aiming toward BSL.
The projected path suggests price may tap the BSL, then reverse.
Bearish Outlook Post-Liquidity Grab:
After hitting BSL (liquidity sweep), price is expected to reverse.
A potential bearish swing may take price back to SSL or lower.
Likely Strategy Indicated:
Short Setup After Liquidity Sweep:
Wait for confirmation (e.g., bearish engulfing or break of structure).
Entry near 1.36200 zone with target near SSL (1.33600 zone).

Marked with “EQH” (Equal Highs), indicating a liquidity area.Chart Elements:
Instrument & Timeframe:
Pair: GBP/USD (British Pound / U.S. Dollar)
Timeframe: 4-hour chart (each candlestick = 4 hours)
Key Zones Highlighted:
Top Green Box (~1.36000–1.36500):
This represents a resistance zone where price has previously struggled to break above.
Marked with “EQH” (Equal Highs), indicating a liquidity area or potential stop-hunt zone.
Bottom Green Box (~1.33500–1.34200):
This is a support zone where price has bounced before.
The price is currently near this support level.
Price Movement Forecast (White Zigzag Line):
Indicates a bullish projection:
Suggests a potential bounce from the current support zone.
A possible rally back towards the resistance zone (~1.36000–1.36500), potentially to grab liquidity above the EQH.
Current Price:
Shown around 1.34656, which is near the bottom support zone.
Candlestick Structure:
Price has recently had a sharp move down into the support zone.
A possible reversal setup is forming based on the projection.
Interpretation:
The chart suggests a bullish scenario for GBP/USD:
The price is expected to hold the support zone.
If buying pressure comes in, the price may rise toward the resistance level to test or sweep the equal highs.

GBPUSD SHORTI'm seeing price come up towards the last point of supply I've got marked out so I'd like to see if the lower timeframes give me an entry to go as I do see some potential in this move.

GBPUSD ZONE TO ZONE
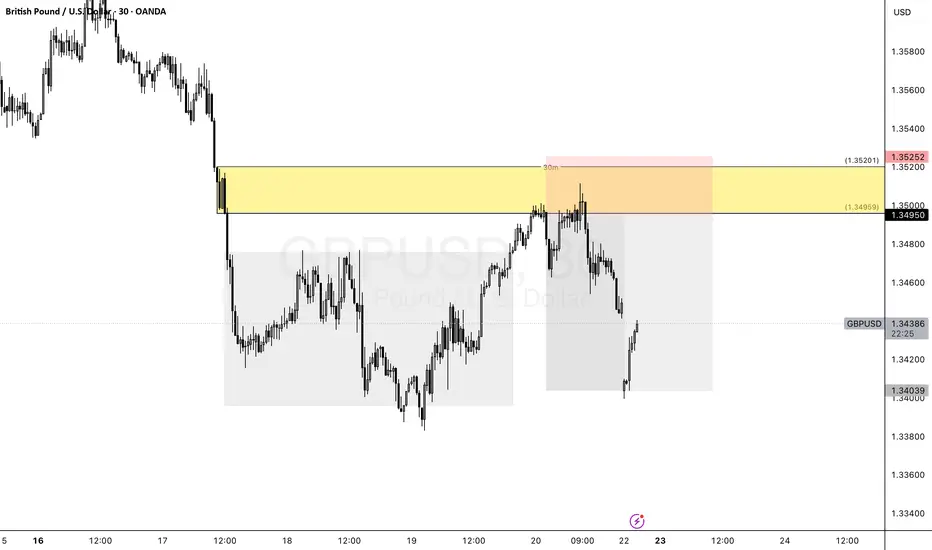
Price is trading beneath the 1.35 level, which is likely to act as resistance. A downside move toward 1.33 remains the base case.

GBPUSD Trading Strategy for the WeekGBPUSD is reacting at the support zone of 1.34000. This is the last important support zone that the pair is facing. If this support zone is broken, the pair will enter a prolonged Downtrend phase. 1.325 could be the target for this decline.
If the 1.34000 zone is pushed up by buyers, the pair will touch the 1.35000 border zone. If this zone is broken, the pair will form a double bottom pattern and continue to increase back to the peak of last week around 1.36000. In case the buying force is not strong enough to break 1.35000, the pair will return to the sideway in the rectangular border.
Support: 1.32500
Resistance: 1.36000
Break out: 1.34000-1.35000
Recommended good trading strategy:
Trade when price confirms in Break out zone.
BUY 1.32600-1.32400 Stoploss 1.32000
SELL 1.35900-1.36100 Stoploss 1.36400

GBPUSD Buys from the weekly FVG.It is clear that weekly fvg, liquidity sweep and time macro are superior in regarding to quick profitability. Patience is the overall recipe. #ICT concepts.

GBPUSD Is Very Bearish! Sell!
Take a look at our analysis for GBPUSD.
Time Frame: 5h
Current Trend: Bearish
Sentiment: Overbought (based on 7-period RSI)
Forecast: Bearish
The market is testing a major horizontal structure 1.357.
Taking into consideration the structure & trend analysis, I believe that the market will reach 1.351 level soon.
P.S
The term oversold refers to a condition where an asset has traded lower in price and has the potential for a price bounce.
Overbought refers to market scenarios where the instrument is traded considerably higher than its fair value. Overvaluation is caused by market sentiments when there is positive news.
Disclosure: I am part of Trade Nation's Influencer program and receive a monthly fee for using their TradingView charts in my analysis.
Like and subscribe and comment my ideas if you enjoy them!

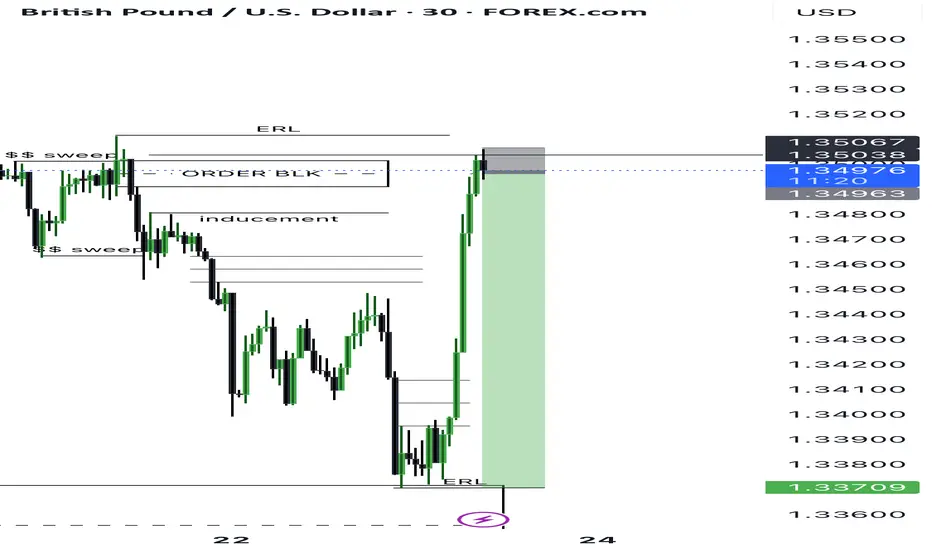
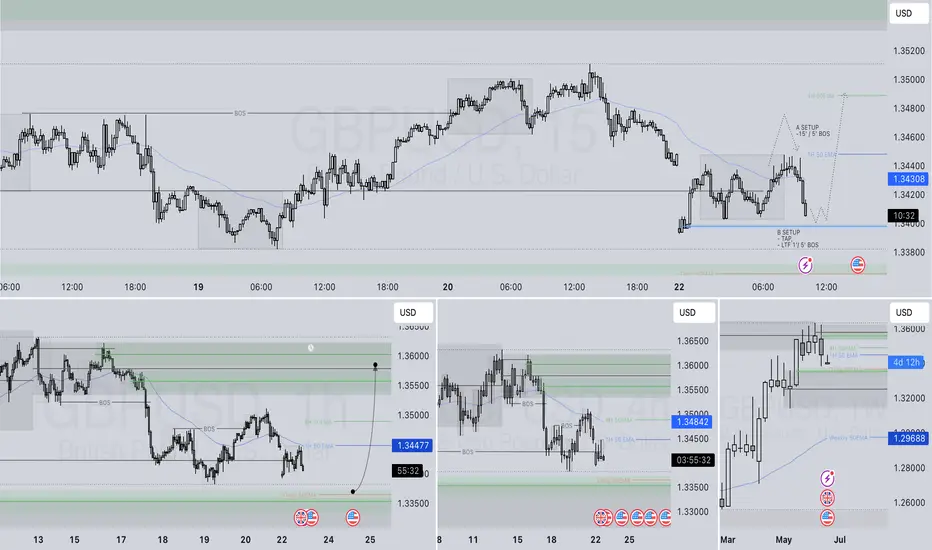
GBPUSD LONG FORECAST Q2 W26 D23 Y25GBPUSD LONG FORECAST Q2 W26 D23 Y25
Professional Risk Managers👋
Welcome back to another FRGNT chart update📈
Diving into some Forex setups using predominantly higher time frame order blocks alongside confirmation breaks of structure.
Let’s see what price action is telling us today!
💡Here are some trade confluences📝
✅Daily order block
✅15' order block
✅Intraday breaks of structure
✅4H Order block
🔑 Remember, to participate in trading comes always with a degree of risk, therefore as professional risk managers it remains vital that we stick to our risk management plan as well as our trading strategies.
📈The rest, we leave to the balance of probabilities.
💡Fail to plan. Plan to fail.
🏆It has always been that simple.
❤️Good luck with your trading journey, I shall see you at the very top.
🎯Trade consistent, FRGNT X
GBPUSD MARKET STRUCTURE CHANGED FROM DOWNTREND TO UPTREND.GBPUSD MARKET STRUCTURE CHANGED FROM DOWNTREND TO UPTREND.
Market started forming higher high, which shows Bullish trend.
Market may Hit the Target of 1.35000 in upcoming trading sessions.
on lower side market may test the level of 1.33800

GU-Mon-23/06/25 TDA-Lots of PMI news incoming today!Analysis done directly on the chart
Follow for more, possible live trades update!
Middle east tensions intensify, follow closely
what's happening as it might influence hugely
on price movement, volatility, fluctuation.
Active in London session!
Not financial advice, DYOR.
Market Flow Strategy
Mister Y

GBPUSD BUY OPPORTUNITY Am seeing a buy Opportunities on GBPUSD
ENTRY: 1 .33900
Sl: 1.33800
TP: 1.35180
Comment your opinion pls 🙏
For Account management. Contact me via X @shajudeakinoba1

gbpusd 30 supply great example on the 30 min timeframe.
drop base drop , fair value. supply identified for a one to three risk to reward.
GBPUSDDID YOU KNOW THAT YOUR COUNTRY CENTRAL BANKS HAVE ANOTHER
CENTRAL BANK AND IS CALLED BIS(BANK OF INTERNATIONAL SETTLEMENTS )???
The Bank for International Settlements (BIS) was established in 1930 at the Hague Conference, making it the world's oldest international financial institution. Its initial purpose was to facilitate the settlement of World War I reparations and to promote cooperation among central banks.
The BIS trading market refers to the role of the Bank for International Settlements (BIS) as a key intermediary and facilitator in global financial markets, particularly in foreign exchange (FX) and central bank transactions
BIS is a secretive institution with sovereign immunity that can move trillions without oversight. aka central bank of central banks in Basel Swissland with over 63 members in the world which are centrals banks of countries that make up 95% of world GDP.
Key Points about BIS and Its Trading Market Role:
Central Bank’s Central Bank: BIS acts as a bank for central banks and international organizations, providing banking services such as accounts, gold and currency transactions, asset management, and short-term collateralized loans.
Market Intermediary: BIS frequently conducts large-scale transactions on behalf of central banks in the foreign exchange and gold markets. These trades are often substantial, reflecting central banks’ reserve management or monetary policy operations.
Avoiding Market Misinterpretation: When BIS buys or sells currencies or assets, it is usually acting for a central bank, not itself, helping avoid markets mistaking these large trades for speculative or official government interventions.
Forum for Cooperation: BIS provides a platform for central banks to exchange information, coordinate policies, and cooperate on monetary and financial stability, which indirectly influences market dynamics.
Research and Statistics: BIS publishes data and analysis on global banking, FX, derivatives markets, and financial stability, supporting informed decision-making in the trading community.
Summary
The BIS trading market is not a public exchange but a specialized, high-level market where BIS facilitates and conducts financial transactions for central banks, particularly in foreign exchange and gold. Its activities help central banks manage reserves and implement monetary policy while fostering international financial cooperation.
if you know you know because BOE (BANK OF ENGLAND ) and FED (FEDERAL RESERVE ) are members .
GBPUSD 10 YEAR BOND YIELD ,INTEREST RATE ,INTEREST RATE DIFFERENTIAL AND CARRY TRADE ADVANTAGE .
1. Current Rates and Yields
Metric United Kingdom (GBP) United States (USD) Differential (UK - US)
10-Year Bond Yield 4.54% 4.38% +0.16% (16 bps)
Policy Interest Rate 4.25% 4.25%–4.50% -0.25% to -0.01%
UK Context: The Bank of England (BoE) held rates at 4.25% amid sticky inflation (3.4% YoY in May ) but signaled potential cuts in August.
US Context: The Federal Reserve held rates at 4.25%–4.50%, prioritizing inflation control despite slowing growth .
2. Interest Rate Differential and Carry Trade Advantage
Yield Spread: The UK 10-year gilt yields 0.16% more than the US 10-year Treasury, creating a modest yield pickup for GBP-denominated bonds .
Policy Rate Spread: The USD offers a 0.25% higher short-term rate (using the Fed’s 4.50% upper bound vs. BoE’s 4.25%) .
Carry Trade Mechanics:
GBP-USD Strategy: Borrow USD at 4.50% and invest in GBP assets at 4.54% (10-year gilt) for a net carry of +0.04%.
USD-GBP Strategy: Borrow GBP at 4.25% and invest in USD assets at 4.38% (10-year Treasury) for a net carry of +0.13%.
Key Risks:
Currency Volatility: GBP/USD at 1.34–1.35 could erase gains if the dollar strengthens.
Policy Shifts: BoE rate cuts (expected August 2025) may narrow the yield spread , while Fed cuts could reduce USD rate advantages .
3. Market Outlook
UK Focus: Inflation persistence may delay BoE cuts, supporting GBP yields near-term .
US Focus: Fed’s "higher for longer" stance and tariff-related inflation risks could sustain USD yield appeal .
Carry Viability: The USD-GBP strategy offers a slight edge (0.13% carry) but requires hedging against GBP appreciation risks.
Summary
Yield Advantage: UK 10-year gilts yield 0.16% more than US Treasuries, but USD short-term rates are 0.25% higher.
Optimal Carry: Borrowing GBP to invest in USD assets (0.13% carry) is marginally favorable, though policy uncertainty warrants caution.
Critical Factors: Monitor BoE/Fed rate decisions and GBP/USD trends for carry trade adjustments.

GBPUSD OVERVIEWPrice is currently coming from supply zones and looking for sells this coming week.On this chart i show zones that were left unmitigated expecting a bearish orderflow


GBPUSD: Bullish Continuation & Long Signal
GBPUSD
- Classic bullish setup
- Our team expects bullish continuation
SUGGESTED TRADE:
Swing Trade
Long GBPUSD
Entry Point - 1.3449
Stop Loss - 1.3413
Take Profit - 1.3520
Our Risk - 1%
Start protection of your profits from lower levels
Disclosure: I am part of Trade Nation's Influencer program and receive a monthly fee for using their TradingView charts in my analysis.
❤️ Please, support our work with like & comment! ❤️
