GBPUSDPrice reached a major weekly resistance and started selling with the daily giving a strong bearish engulfing last week. H4 formed a double top and started creating lower highs. H1 has formed a third bearish wedge. Waiting for clear breakout to look for shorts. Watch out for fundamentals this week.
GBPUSD_SPT trade ideas

GBPUSD: Market of Sellers
The analysis of the GBPUSD chart clearly shows us that the pair is finally about to tank due to the rising pressure from the sellers.
Disclosure: I am part of Trade Nation's Influencer program and receive a monthly fee for using their TradingView charts in my analysis.
❤️ Please, support our work with like & comment! ❤️

Passing through alot on GBPUSD since yesterday i don really know if my psychology is playing pranks on me .or are we in a choppy market? ...i have been working the market to dance to my tune lol ...but this pair keeps doing what it wants ... holding trade for hours in blues for price to reverse and hit SL or BE ....wtf

SELL CONTINUATION Price has broken structure twice to the downside creating a protected high at the lower high( below 1.36600). Also price has created a nice looking order block, inducement that closed above a high! Further confirmation tells us that price is also now at the premium level of the swing leg, suggesting a good short set up. Now we wait for price to tap into the order block, a good change of character on the lower time frame will give a nice sell action to the external low!
TRADE CAREFULLY AND RISK WISELY

GBPUSD Forecast – Clean Supply Rejection, Eyes on Next Liquidit📉 GBPUSD Forecast – Clean Supply Rejection, Eyes on Next Liquidity Level (1.35130)
Price rejected perfectly from our 1.36349–1.36481 supply zone, showing clear bearish intent. Now all eyes are on the next major liquidity pool.
🟥 Supply Zone: 1.36349–1.36481
📍 Target: 1.35130 – Marked liquidity level
🔍 This is the power of zone + structure confluence — no indicators, just precision levels.
💡 Mark → Wait → Execute
That’s the FXFOREVER approach.
#FXFOREVER #GBPUSD #ForexForecast #SmartMoneyZones #SupplyAndDemand #PriceAction #ForexTrading

GBPUSD INTRADAY LONG TRADE PLANThe pair is trading near a strong key zone. Expecting a bullish impulse from this zone.
Please do your own analysis before placing any trades.
Cheers and Happy Trading !!!!

GBPUSD"My current expectation is that the price will continue to move within the descending channel on the 1-hour timeframe. I'm waiting for the price to retest the upper boundary of the channel. If a valid bearish confirmation signal (such as a reversal candlestick pattern) forms at that level, I plan to enter a short position."

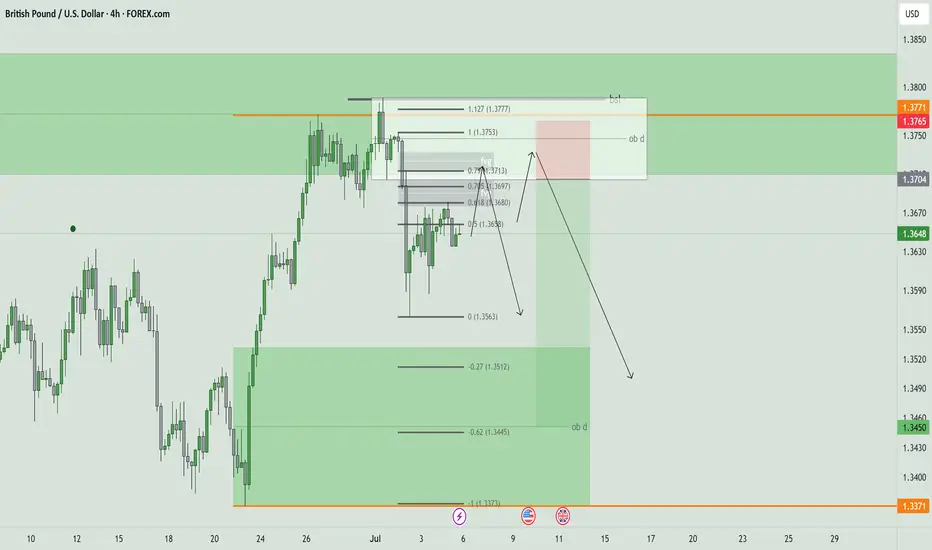
GBP/USD30 Mins Frame
🧠 Technical Overview:
Price is currently testing a strong resistance zone after a gradual upward movement, with signs of a potential bearish reversal.
A rising wedge pattern is forming — typically a bearish reversal pattern, especially if broken to the downside.
🧩 Key Technical Elements:
1. Supply Zone:
Defined between 1.3675 and 1.3717 — a previously strong resistance area.
Price is currently facing rejection within this zone, showing weakening bullish momentum.
2. Entry Point:
Sell at 1.36560, triggered by rejection from the resistance zone and a potential breakdown below the ascending support (blue line).
3. Stop Loss:
1.37177, placed above the supply zone — a logical level that invalidates the bearish setup if reached.
4. Targets:
First Target: 1.35602 – a clear previous support level and logical profit-taking zone.
Second Target: 1.34207 – a stronger, more significant support zone, likely to be tested if bearish momentum continues.
📉 Expected Price Action:
The chart shows a weak rising wedge pattern, indicating potential buyer exhaustion.
A break below the ascending trendline (blue) may trigger strong downside movement.
The expected move is illustrated with the red arrow on the chart, indicating a bearish trajectory.
🔥 Risk-to-Reward Ratio (R:R):
First Target:
Potential Reward: ~95 pips
Risk (SL): ~61 pips
→ R:R ≈ 1.56:1
Second Target:
Potential Reward: ~235 pips
→ R:R ≈ 3.85:1
✅ Very favorable, especially toward the second target.
✅ Conclusion:
The short setup is technically valid and supported by price structure and resistance confirmation.
The supply zone has proven strong, and price is struggling to break above it.
A solid trade opportunity for short- to medium-term traders with clearly defined risk and reward.

Gbpusd long scalp Same idea as previous post, I want to see a close above 1.35832 and a return into that level would be my entry. 3 targets as depicted.

DeGRAM | GBPUSD got out from the triangle📊 Technical Analysis
● Price pierced the blue-labelled trend-line and is threatening to exit a month-long contracting triangle; successive higher lows since 3 Jul show demand absorbing every dip.
● A confirmed H1 close above 1.3650 completes the pattern, unlocking the 1.3700-1.3720 supply zone (June range cap) with measured-move scope toward the broader channel midpoint at 1.3770.
💡 Fundamental Analysis
● Post-election political clarity and an uptick in UK 2-yr gilt yields narrow the policy-gap, while Friday’s softer US NFP trims Fed-rate expectations—both favouring sterling over the dollar.
✨ Summary
Buy 1.3620-1.3650; break >1.3650 targets 1.3700 → 1.3770. Long bias void on an H1 close below 1.3590.
-------------------
Share your opinion in the comments and support the idea with a like. Thanks for your support!

GBPUSD swing sell GBPUSD brexit was never a good idea, it looks bullish, many will have that bias and if you look carefully tapped into 4h supply multiple times, and its due for a correction

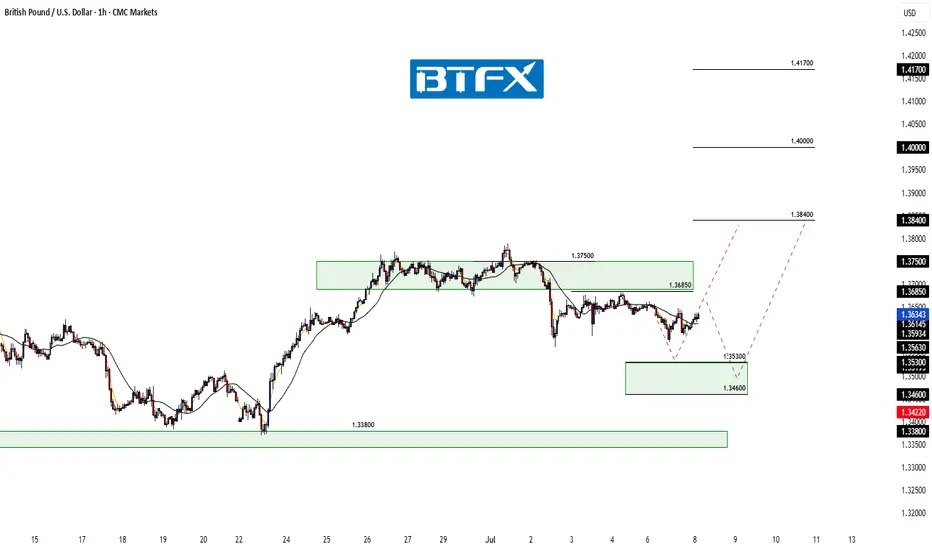
GBP/USD: Short‑Term Pullback Likely Before Fresh Upside AttemptHi everyone,
GBP/USD continues to consolidate below the 1.36850 level. We expect a retest of this level today; should price fail to break above, we anticipate a move lower to find buying interest between the 1.35300 and 1.34600 zones. A drop into this area appears to be the more probable short‑term path and could set the stage for another push higher.
As previously noted, a decisive break above 1.37500 would renew our expectation for further upside, with the next key target around 1.38400. We'll be monitoring price action closely to see how it unfolds.
We’ll continue to provide updates on the projected path for GBP/USD as price approaches this target.
The longer-term outlook remains bullish, and we expect the rally to continue extending further from the 1.20991 January low towards 1.40000 and 1.417000.
We’ll be keeping you updated throughout the week with how we’re managing our active ideas. Thanks again for all the likes/boosts, comments and follows — we appreciate the support!
All the best for the week ahead. Trade safe.
BluetonaFX
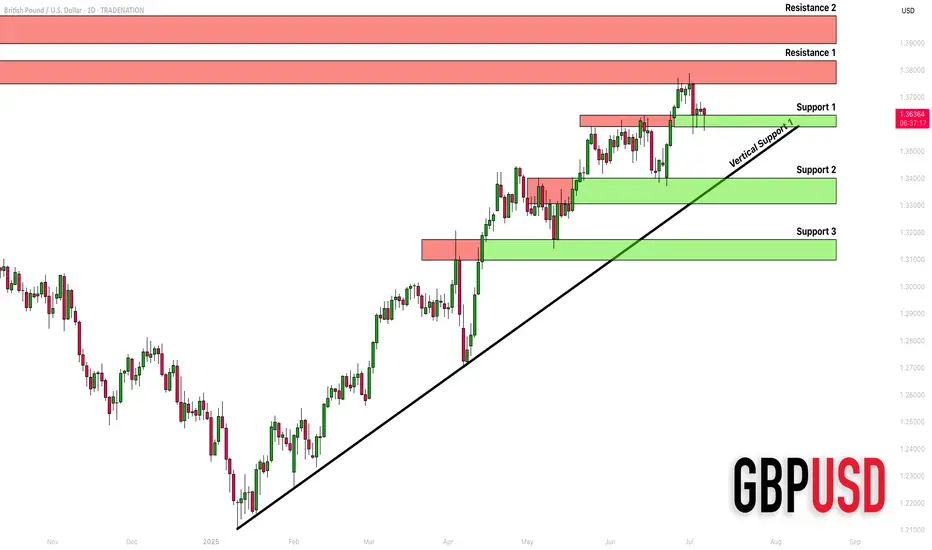
GBPUSD: Detailed Support & Resistance Analysis 🇬🇧🇺🇸
Here is my structure analysis for GBPUSD.
Horizontal Structures
Support 1: 1.3588 - 1.3633 area
Support 2: 1.3305 - 1.3400 area
Support 3: 1.3097 - 1.3175 area
Resistance 1: 1.3748 - 1.3835 area
Resistance 2: 1.3900 - 1.3400 area
Vertical Structures
Vertical Support 1: rising trend line
Consider these structures for pullback/breakout trading.
❤️Please, support my work with like, thank you!❤️
I am part of Trade Nation's Influencer program and receive a monthly fee for using their TradingView charts in my analysis.
GBPUSD Long Re-entry, 07 JulyAsia Fill & Volume-Based Setup
This is a momentum-driven long based on Asia Fill and a strong bullish shift on LTF, with clear DXY correlation. HTF doesn't offer major confluence, but intraday price action supports the idea.
📍 Entry: Waiting for a retest of the 5m OB left behind after a strong bullish move
📈 Confluence: 1m BOS + 15m Extreme OB + high buyer volume
🔁 Risk: Price may not return to 5m OB – if missed, it's a no-trade
🎯 Target: Asia high (but first 1:3 RR), quick BE if we catch the move
Clean setup with structure and volume in our favor – execution depends on retest.

GBPUSD IN 4HGBUSD is currently in an ascending channel on the 4-hour timeframe.
My expectation is that the price will reach the area I've marked with a blue box. I will then wait for a confirmation candle on the 1-hour or 15-minute timeframe before entering a long position.

GBPUSD BUY OPPORTUNITY Buy GBPUSD Now. It on key level
Entry: 1.35800
Stoploss: 1.35600
Take profit: 1.3700
Comment your opinion now.
For Fund Management Contact me on X @shajudeakinoba1

GBPUSD overbought pullback support at 1.3544The GBPUSD remains in a bullish trend, with recent price action showing signs of a corrective pullback within the broader uptrend.
Support Zone: 1.3544 – a key level from previous consolidation. Price is currently testing or approaching this level.
A bullish rebound from 1.3544 would confirm ongoing upside momentum, with potential targets at:
1.3770 – initial resistance
1.3830 – psychological and structural level
1.3890 – extended resistance on the longer-term chart
Bearish Scenario:
A confirmed break and daily close below 1.3544 would weaken the bullish outlook and suggest deeper downside risk toward:
1.3500 – minor support
1.3440 – stronger support and potential demand zone
Outlook:
Bullish bias remains intact while the FTSE holds above 1.3544. A sustained break below this level could shift momentum to the downside in the short term.
This communication is for informational purposes only and should not be viewed as any form of recommendation as to a particular course of action or as investment advice. It is not intended as an offer or solicitation for the purchase or sale of any financial instrument or as an official confirmation of any transaction. Opinions, estimates and assumptions expressed herein are made as of the date of this communication and are subject to change without notice. This communication has been prepared based upon information, including market prices, data and other information, believed to be reliable; however, Trade Nation does not warrant its completeness or accuracy. All market prices and market data contained in or attached to this communication are indicative and subject to change without notice.

GBPUSD Long, 07 JulyAsia Fill Setup
This is a pure Asia Fill trade, backed by recent bullish LTF structure and a clean reaction from a 15m decisional OB. Although HTF isn’t perfectly aligned for longs, the momentum and intraday structure make this setup valid.
📍 Entry: 1m BOS from 15m OB, refined entry from 1m OB
📈 Confluence: Trend, structure, and Asia high as a clear target
🔁 Risk: SL doesn’t fully cover the OB, but BOS + clean reaction justifies the entry
🎯 Target: Asia High (1:3 RR), with BE secured quickly if price moves favorably
Not a perfect setup HTF-wise, but strong intraday alignment makes it worth the shot.

GU-Mon-07/07/25 TDA-Good support zone,but possible sell continueAnalysis done directly on the chart
Follow for more, possible live trades update!
I often share my live trades in Tradingview public chat in London session, stay tuned!
A simple idea plan (like Tradingview public posts) won't describe everything.
No one can predict how market will move, it's always good to react to how it moves.
It gives an idea of how price might move, but no one come from FUTURE.
So I always encourage people to openly and actively discuss in real time.
I don't give signals blindly, people should learn
and understand the skill.
Following blindly signals you won't know how to
manage the trade, lot size and replicate the move
over time.
That's why you need active real time discussions.
Trading is not get rich quick scheme!
Active in London session!
Not financial advice, DYOR.
Market Flow Strategy
Mister Y

GBPUSD THIS WEEKGBPUSD this week going in level 61.8-70.2-79 or OTE and going for Sell in OB Daily.
RR 1:4 and Stoploss is above OB
Weekly hat 2 candle bearish and Daily it is Market structur shift for Bearish
Price going for retracment Fib and SELL
ALL this analysis its only my opinion not your to trade
Lingrid | GBPUSD Potential Bounce at Key Psychological LevelThe price perfectly fulfilled my previous idea . FX:GBPUSD is consolidating above the upward trendline after forming a local double top near the 1.3787 resistance zone. The price is currently retesting the 1.3611–1.3660 support cluster, aligned with the trendline and previous impulse breakout area. A successful bounce from this zone could initiate another rally toward the upper boundary of the resistance range.
📈 Key Levels
Buy zone: 1.3600–1.3660 (trendline + support overlap)
Sell trigger: breakdown below 1.3600
Target: 1.3787 – resistance ceiling with prior rejection
Buy trigger: bullish reaction from 1.3611 area with strong candle close
💡 Risks
Breakdown below 1.3600 may expose deeper retracement to 1.3367
Repeated rejection at 1.3787 could form a longer-term double top
Macro data surprises could shift short-term direction suddenly
If this idea resonates with you or you have your own opinion, traders, hit the comments. I’m excited to read your thoughts!

GBPUSD MARKET OUTLOOK!GBPUSD Price just dropped lower following the recent release in US NFP report. Therefore I anticipate a bullish price action to develop away from 1.3500 and 1.3400 level
We’re still looking forward to seeking more bullish price action developments

GBPUSD forming bearish trend in 1 hour time frameGBPUSD forming bearish trend in 1 hour time frame.
Market is forming lower low which shows indicates bearish trend.
Price is also forming Bearish flag pattern.
Market is expected to remain bearish in upcoming trading sessions.
On lower side market can hit the target levels of 1.35800 & 1.35100.
On higher side market may test the resistance level of 1.37900.
