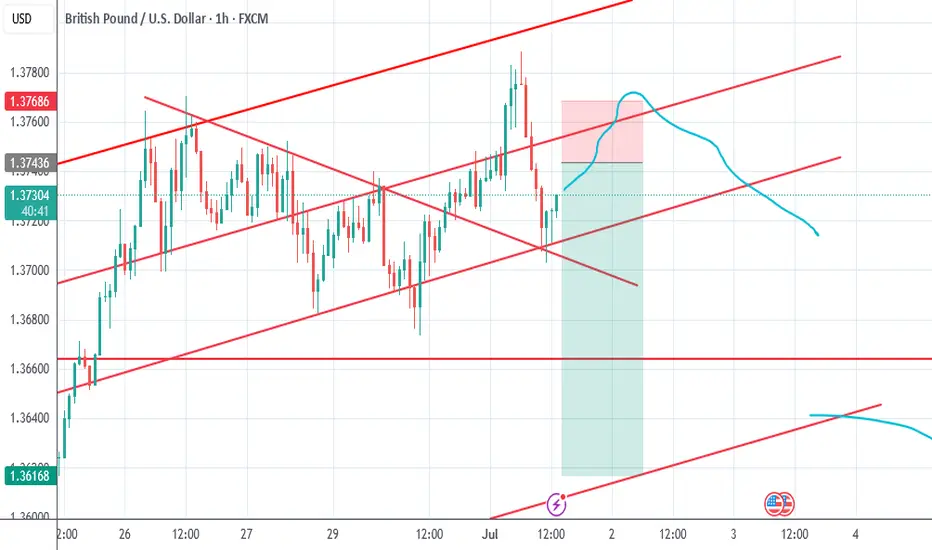
GU-Thu-03/07/25 TDA-UK political turmoil triggers market selloffAnalysis done directly on the chart
Follow for more, possible live trades update!
I often share my live trades in Tradingview public chat in London session, stay tuned!
I don't give signals blindly, people should learn
and understand the skill.
Following blindly signals you won't know how to
manage the trade, lot size and replicate the move
over time.
That's why you need active real time discussions.
Trading is not get rich quick scheme!
Active in London session!
Not financial advice, DYOR.
Market Flow Strategy
Mister Y
GBPUSD_SPT trade ideas

Gbpusd short idea I like the daily bearish momentum to the down side.
Not trying to pick the top or anything but I think will will see a follow through.
I like one of the nearest internal range liquidity pool depicted with green line.
Let's see how it goes!

Excepting a bullish movement on GBPUSD H4GBPUSD has been on a strong bullish momentum for months now, though having some correctional moves. GBPUSD gave two demand zones, forming a rally base rally, given a buy signal (bullish pin bar) on H4,we expect a bullish run to the first resistance before any corrections.


Proven Results | GBP/USD Trade Recap & Premium Signal AccessYesterday’s trades achieved 75% of all target levels, showcasing the consistency and precision behind my strategy. Today followed with another strong performance—first a successful long trade, then a clean short setup based on evolving price action and structure.
These aren’t random calls—they’re calculated, disciplined, and backed by real-time analysis.
If you're looking for reliable forex signals that actually deliver, my premium service offers:
🔔 Instant trade alerts with entry, stop-loss, and take-profit
📊 Clear trade breakdowns and market logic
💬 Direct access for questions and guidance
💵 Affordable plans designed for serious traders
Join a growing community of traders who are turning insights into results. 📲 Subscribe now and start trading with confidence.

GU-Wed-02/07/25 TDA-Market positioning not the best atmAnalysis done directly on the chart
Follow for more, possible live trades update!
I often share my live trades in Tradingview public chat in London session, stay tuned!
Another factor that plays huge your trade setups, ideas is
market positioning. Your ideas might be good, but with
bad market positioning there's high chance price might
stop you out before going to your direction.
Active in London session!
Not financial advice, DYOR.
Market Flow Strategy
Mister Y

Fundamental Market Analysis for July 2, 2025 GBPUSDOn Wednesday, during the Asian trading session, the GBP/USD pair is trading unchanged at around 1.37450. However, dovish statements by US Federal Reserve Chairman Jerome Powell and growing concerns about the budget may put pressure on the dollar in the near term. Investors are awaiting the ADP report on US employment for June, which will be released later on Wednesday, in the hope of new momentum.
Powell said on Tuesday that the US central bank would be patient about further interest rate cuts, but did not rule out a rate cut at its July meeting, although the decision would depend on incoming data. According to the CME FedWatch tool, short-term interest rate futures now price in the probability of a rate cut in July at almost 1 in 4, up from less than 1 in 5 previously.
Investors are concerned about US President Donald Trump's massive tax and spending bill, which could increase the national debt by $3.3 trillion. The bill will return to the House of Representatives for final approval. Fiscal concerns could dampen optimism and contribute to a decline in the US dollar.
As for the pound sterling, Bank of England (BoE) Governor Andrew Bailey said last week that there are currently signs of a weakening UK labor market and stressed that interest rates are likely to continue to fall. The UK central bank is expected to cut interest rates three times by the end of 2025, bringing them to 3.5% to combat sluggish economic growth and a weakening labor market. Rate cuts are expected in August, September, and November 2025, with possible quarterly reductions.
Trading recommendation: SELL 1.37450, SL 1.37900, TP 1.36750

GBPUSD – Multi-Timeframe Bearish Divergence | Trend Weakening AcGBPUSD – Multi-Timeframe Bearish Divergence | Trend Weakening Across the Board 🐻📉
Hey traders 👋
GBPUSD is flashing clear signs of weakness, and this time it’s not just on the lower timeframes. We’re seeing bearish divergence on the 4H, Daily, and Weekly charts — a rare alignment that typically signals a bigger move is brewing.
📉 Technical Breakdown
4H: Price pushing higher, but RSI lagging = short-term exhaustion
Daily: Momentum fading, divergence forming against structure
Weekly: Long-term bearish divergence developing = macro weakness
That kind of multi-timeframe divergence doesn’t just whisper — it screams caution for bulls.
💵 DXY (Dollar Index) Just Hit 0.71 Level
DXY tapping into a key fib level (0.71) — suggesting a short-term correction or pullback
If DXY cools off temporarily, GBPUSD might fake a bounce or wick up
But once that correction is done, expect GBPUSD to resume its slide
This is where timing becomes everything.
🎯 Trade Strategy
Already short from current divergence signals? ✅ Good spot.
Stop-loss: Reasonable level above last high or structure break — no need to choke the trade
If SL gets hit: Don’t chase — wait for next bearish divergence or retest fail, then re-enter with structure confirmation
This is about patience, not prediction. The setup is clean — now it’s all about execution.

Short Scalp With Swing OpportunityGBPUSD formed a perfect wedge top, setting up a potential short opportunity in the next days.
1. The move is composed of a clear 3-Push Pattern.
2. The last push/leg is the strongest, indicating a possible exhaustion (Climatic Move).
3. At the top of the last leg, there's a sequence of 5 bars with lots of overlapping - Al Brooks' Final Flag Pattern
With a good bearish signal bar, it's worth scalping part of the position towards to the 20 EMA and swing the rest of it until the Bull TL.

Sintra Signals: Central Banks Stay Cautious The ECB Forum in Sintra brought together the heads of the world’s most influential central banks—Lagarde (ECB), Powell (Fed), Bailey (BOE), Ueda (BOJ), and Rhee (BOK).
Across the board, central banks are remaining cautious and data-driven, with no firm commitments on timing for rate changes.
Fed Chair Powell said the U.S. economy is strong, with inflation manageable despite expected summer upticks. He noted tariffs have delayed potential rate cuts and confirmed the Fed is proceeding meeting by meeting.
BOE’s Bailey highlighted signs of softening in the UK economy and said policy remains restrictive but will ease over time. He sees the path of rates continuing downward.
BOJ’s Ueda noted headline inflation is above 2%. Any hikes will depend on underlying core inflation which remains below target.

GBPUSDAccording to my Technical analysis GBPUSD pair continue to bearish, i adjust my TP as per price action.
Eurusd And Gbpusd Sell ideas EU 1H
Currently we are in a bulllish trend on EU/GU
And this High might be a short term Top and
EU/GU should sell according to my idea
(This is Counter trend idea And not financial advice
I

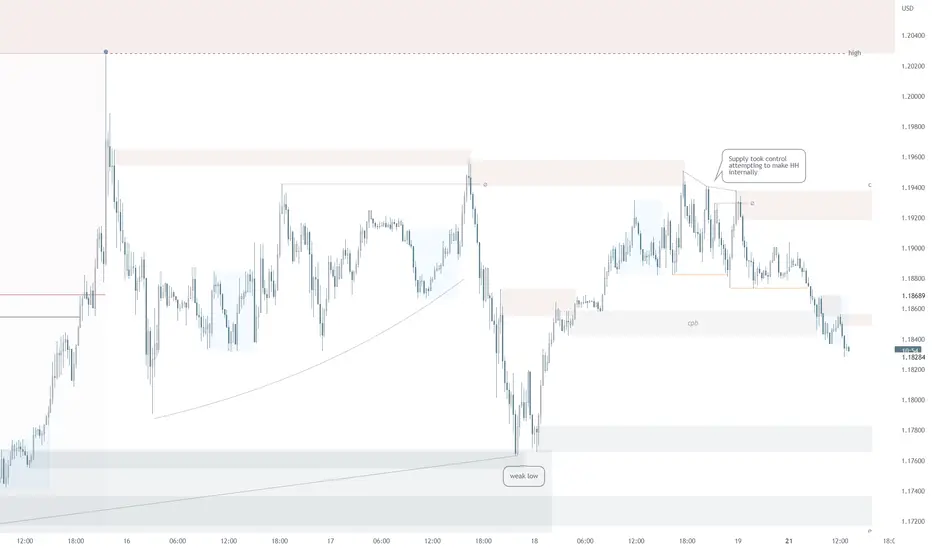
GBPUSD – Short-Term Entry Model (Price Action Based)Education time!
This is a quick-execution on GBPUSD this London session based on a failed breakout and structure shift.
Price initially broke above the previous high but failed to sustain the breakout. The second push failed to print a higher high (HH), signaling potential exhaustion. Once the higher low (HL) that led to the failed HH was broken to the downside, a valid short setup was confirmed.
The trade targets the 161.8% Fibonacci extension of the initial move that failed to hold above the high.
📉 Result: The setup played out cleanly, hitting the target with a +17 pip gain.

GBP/USD Trade Update: Re-Entry After SL Hit – Bullish Bias MaintAfter the initial stop-loss was triggered, price action has realigned with the original bullish outlook. Market structure remains intact, and the recent move appears to be a liquidity sweep rather than a full reversal. I’ve re-entered the buy position at a more favorable level, with a clear invalidation point and defined upside targets.
This re-entry reflects confidence in the broader setup and a commitment to disciplined execution. Sometimes, the best trades require patience and a second entry when the market shakes out weak hands.
📈 Follow for live trade updates, risk management insights, and GBP/USD strategy breakdowns. 💬 Let’s navigate the volatility with precision and purpose.

GBP/USD – Bullish Bias Holding Above Demand Zones (1H Chart)📈 GBP/USD – Bullish Bias Holding Above Demand Zones (1H Chart)
The pair is consolidating above key demand zones after a strong bullish move. Price structure suggests buyers are still active.
🔹 First Demand Zone: 1.36561–1.36683
🔹 Secondary Demand Zone: 1.35908–1.36226
🔹 Current Price: 1.37375
📍 As long as price holds above 1.36561, bullish continuation remains on the table. A clean rejection from demand with LTF confirmation could offer fresh long setups.
⚠️ No need to rush — let price test the zone and show intent before buying.
#GBPUSD #FXFOREVER #DemandZone #SmartMoneyTrading #PriceAction #ForexForecast #BullishScenario #StructureSupport

GBPUSD D1 LongD1 Long GBPUSD
Based on trend and candle structure
80% probability
TP on next PSYchological level not far at all

GBP/USD – Macro Outlook & Why It’s a Top Pick This WeekMacro Fundamentals (ENDO):
The UK macro backdrop remains inflationary, with solid growth data and resilient employment figures, supporting further GBP strength. Conversely, the US shows increasing deflationary signals and a softer macro pulse.
COT Positioning:
Institutional positioning is highly supportive, with a 74% long bias and strong “flip percentile.” This shows that “smart money” is increasingly positioned for further GBP/USD upside.
Z-Score (Positioning Extremes):
There are no extreme positioning imbalances in Z-Score for GBP or USD, suggesting the trend can continue without risk of a mean-reversion squeeze.
EXO Signals (Risk/Reward, Bias, Interest Rate Outlook):
Risk/reward metrics and bias signals favor the long side. The current risk-on sentiment in global markets also acts as a tailwind for GBP.
FX Sentiment:
The broader sentiment is risk-on, supporting currencies like GBP that tend to outperform in such environments.
Summary & Trading Plan:
Bias: Long GBP/USD
Conviction: High (9.5/10, all key signals aligned)
Ideal Holding Period: 1–3 weeks, as long as risk-on sentiment persists. Exit immediately if risk-off conditions emerge.
Why This Pair?
Because GBP/USD is the rare case where macro, institutional positioning, and market sentiment all support the same direction. This reduces “crosswinds” and increases the probability of a clean swing move. Watch for sustained risk-on flows and monitor for any macro or sentiment shifts.


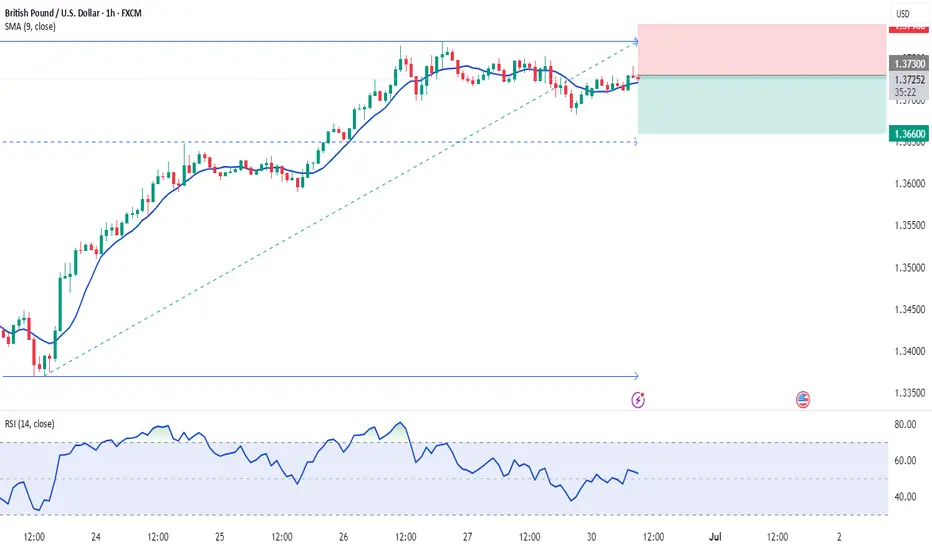
30.06.2025 #GBPUSDSELL 1.37300 | STOP 1.37900 | TAKE 1.36600 | Downward local corrective price movement.
GBP/USD Testing Resistance at 2022 HighsSterling marked an outside weekly-reversal through slope resistance last week with the rally trading just below resistance into the close of the month at the 2022 swing high at 1.3749. Look for support at the June high at 1.3633 IF price is heading higher on this stretch with a breach / close higher exposing the 61.8% extension of the 2022 advance at 1.4003. Weekly support rests with the 78.6% retracement at 1.3414 with media-term bullish invalidation now raised to the April high-week close (HWC) at 1.3270.
-MB

GBPUSD bullishExpecting GU to continue bullish after clear rejection from the 1H support. We wait for a bullish confirmation candle before entry.

The Day Ahead A packed data slate and central bank commentary will shape market sentiment today. Key focus will be on China’s official PMIs for June, offering the first major insight into the health of the global manufacturing cycle as Q3 begins. A soft print could amplify global growth concerns, while a surprise to the upside may support risk sentiment across Asia and commodities.
In the US, attention will turn to the June MNI Chicago PMI and the Dallas Fed manufacturing activity index for further clarity on the state of US industry after mixed regional data earlier this month. The consumer credit and M4 money supply data, along with Q1 current account figures, could influence the USD via their implications for domestic demand and external balances.
The UK sees the release of the Lloyds Business Barometer, which will provide a gauge of corporate confidence amid sticky inflation and persistent BoE rate cut speculation.
In the Eurozone, eyes will be on Germany’s June CPI flash estimate, retail sales, and import prices, all feeding into inflation expectations ahead of the ECB’s July policy meeting. Italy’s CPI and Eurozone May M3 will also be watched closely for signs of disinflation and liquidity trends.
From Japan, May industrial production and housing starts will help assess whether the domestic economy is managing to maintain momentum amid a weak yen and global headwinds.
On the central bank front, the ECB Forum in Sintra kicks off, running through July 2. President Christine Lagarde is due to speak, and any remarks on the rate path or inflation outlook will be closely parsed. Markets will also hear from Fed’s Bostic and Goolsbee, potentially offering clues on the FOMC’s stance amid rising speculation around a September cut.
This communication is for informational purposes only and should not be viewed as any form of recommendation as to a particular course of action or as investment advice. It is not intended as an offer or solicitation for the purchase or sale of any financial instrument or as an official confirmation of any transaction. Opinions, estimates and assumptions expressed herein are made as of the date of this communication and are subject to change without notice. This communication has been prepared based upon information, including market prices, data and other information, believed to be reliable; however, Trade Nation does not warrant its completeness or accuracy. All market prices and market data contained in or attached to this communication are indicative and subject to change without notice.
