GBPUSD – Bearish Set-up Maintains Its GripGBPUSD – Bearish Set-up Maintains Its Grip
The bearish scenario for GBPUSD remains valid, aligning with our previous analysis. Despite expectations of a softer U.S. dollar, ongoing geopolitical tensions—particularly the escalating war—have sustained dollar strength. This resilience in the dollar undermines any near-term bullish recovery for GBPUSD.
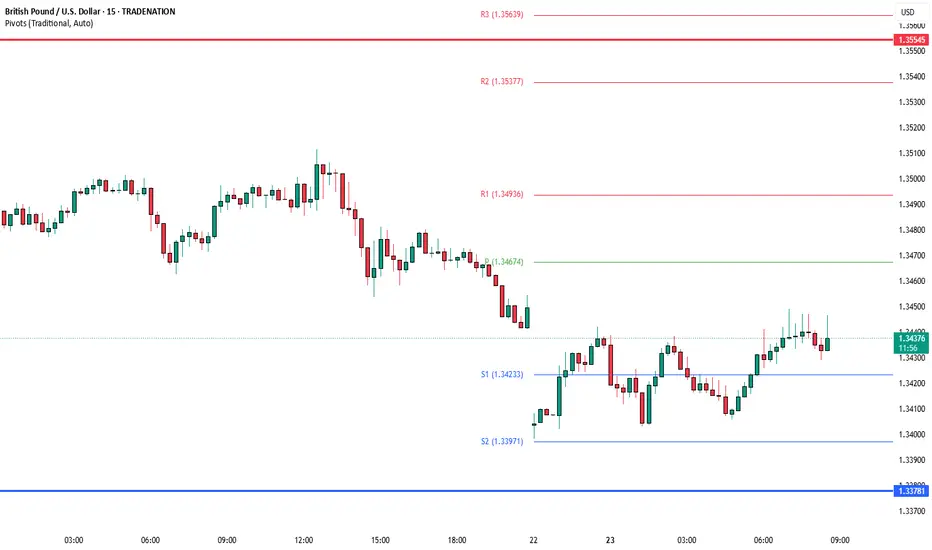
Resistance zone 1.35500 / 1.36000
Support Levels 1.33500 / 1.32500
Technically, the pair continues to trade under key resistance zones, with lower highs confirming bearish momentum. Unless we see a decisive shift in the geopolitical narrative or major macroeconomic data supporting GBP recovery, the bearish bias remains intact.
you may find more details in the chart Ps Support with like and comments for more analysis.
GBPUSD_SPT trade ideas
GBPUSD (Daily + H4) – Bullish Symmetry with Shark Execution & El
Hello awesome traders!
I hope your trading week has been phenomenal. Let’s close out the week strong with this GBPUSD analysis combining Daily structure with lower-timeframe execution.
Main Chart: SYMMETRY (Daily) – Bullish Setup
Price has completed a perfect AB=CD symmetry structure with clear legs from the May rally. We now sit inside a strong PCZ (Potential Completion Zone) between the 78.6% and 100% projections, near a prior breakout zone. This type of measured pullback often sets the base for continuation when confirmed by lower timeframes.
Execution Chart: SHARK (H4) – Entry Strategy
On the 4H, we have a clean SHARK pattern terminating deep within the same PCZ as the daily symmetry. Price tagged 161.8% then immediately bounced, printing a bullish engulfing structure above the 127.2% fib. That’s our signal to focus long.
We define the entry above the minor high / 200 SMA retest — at 1.34450, with stops just below 1.33800 (under the wick and invalidation zone). Targets are aligned with fib retracement and extension zones, 61.8% first, 127% for the extended leg.
Elliot Context (H4 + Daily Overview)
On the H4, price completed a 5-leg Elliott drive with wedge structure and a sharp exhaustion push down to PRZ.
On the Daily, the Elliott overview shows price respecting impulsive wave alignment and now positioning for a corrective rally that aligns with our symmetry leg expectation.
Next Steps:
Execution: Enter long above 1.34450 only on confirmation.
First target: 1.34920 zone (61.8% fib).
Extended target: 1.36083 (127.2% fib).
Invalidation: Below 1.33800 — if price closes below the PRZ, setup is void.
Risk Management:
Clear stop placement and PRZ-based entry. Confluence from Daily + H4 structure + Elliott logic supports the long idea. No FOMO — only execute on confirmation. Let the market come to you.
Hope you all have a great weekend!
Let’s stay disciplined, trust the structure, and trade like the pros.
—Constantino DeLa
Tradechartpatternslikethepros.

GBPUSD Supply and Demand AnalysisPrice still looking bearish, if we are to pull back we a strong area of supply higher up that could be mitigated to fuel the move back to the downside.
GBPUSDit’s a clear sign that this pair is selling for now.
We just have to get good entries at a correct time. In bearish move

GBP/USD Weakens Ahead of PMI ReleasesGBP/USD fell to around 1.3405 during Monday’s Asian session as safe-haven flows strengthened the US dollar amid rising Middle East tensions. Fears of Iranian retaliation after US airstrikes on three nuclear sites lifted demand for the Greenback. Trump said Iran’s facilities were “totally obliterated” and warned of stronger attacks unless peace is reached. Iran vowed to respond, saying it “reserves all options.”
Investors await June PMI data from the UK and US due later Monday. The Pound remains under pressure after UK retail sales dropped 2.7% MoM in May, well below the expected 0.5% decline and April’s revised 1.3% gain.
The BoE held rates at 4.25% last Thursday. Governor Bailey said rates are on a gradual downward path but warned of global unpredictability. Reuters expects 25 bps cuts in both August and Q4.
Resistance is seen at 1.3500, while support holds at 1.3415.

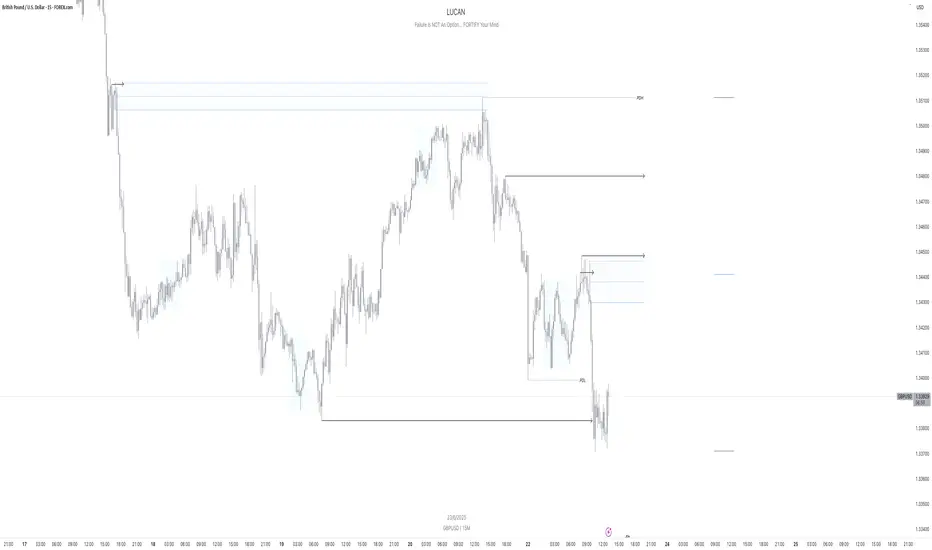
GU = Asian Highs > Asian LowsAs per my morning forecast on GU shared this morning. Price action did exactly that. Sweeped the Asian highs and plummeted towards the Asian lows at around 1.34.
- Aman

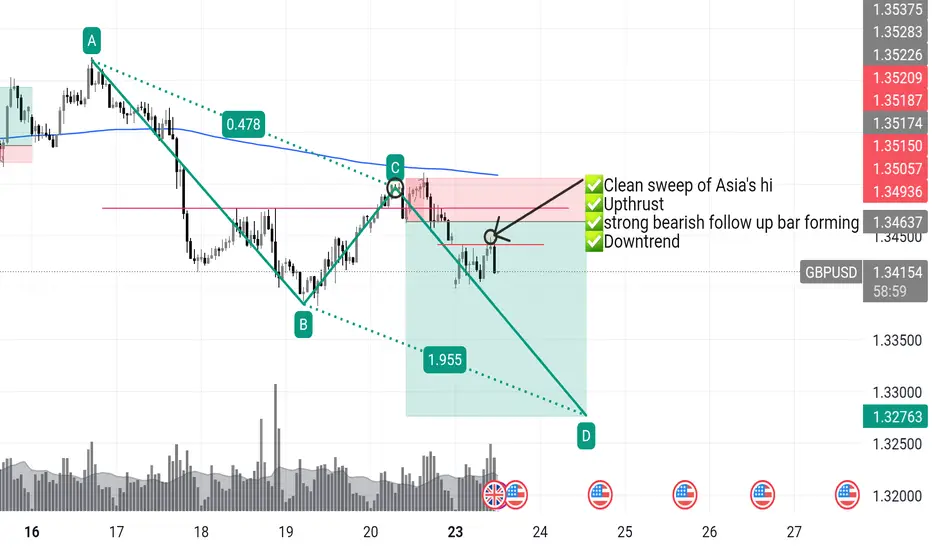
GBPUSD short re-entryGBPUSD – I Got Clipped. Now I’m Coming Back With Intent.
📅 Monday | June 23, 2025
Yes — I got stopped out. That’s execution, not failure.
Clean sweep of Asia’s high. Textbook.
Liquidity taken. Weak hands shaken. Now the real move can begin.
🔁 This 1H close is my greenlight for re-entry.
I don’t hesitate when the market gives me the same setup twice —
It’s still:
✅ Downtrend dominant
✅ Upthrust confirmed
✅ Sellers stepping back in
✅ Price under key rejection zone
If this bar closes bearish, I’m short again — this time with full intent.
📉 Target: 3r+ and beyond
🔥 London
GBPUSD INTRADAY bullish consolidation supported at 1.3380The GBPUSD currency pair maintains a bullish price action structure, supported by the ongoing rising trend. Current intraday movement appears to be a corrective pullback within a consolidation phase, potentially offering a buying opportunity within the broader uptrend.
Key Technical Levels:
Support (Key Trading Level): 1.3380 (prior consolidation zone)
Additional Support: 1.3340 and 1.3300
Upside Resistance Targets:
1.3480
1.3550
1.3600 (longer-term target)
Bullish Scenario:
A bounce from the 1.3380 support would confirm the continuation of the bullish trend. Sustained upside momentum could then target 1.3480, with further extensions toward 1.3550 and 1.3600 over the medium term.
Bearish Alternative:
A confirmed daily close below 1.3380 would invalidate the bullish outlook and suggest deeper downside retracement. In that case, the next support levels to monitor would be 1.3340 and 1.3300.
Conclusion:
The bias remains bullish while GBPUSD holds above 1.3380. A rebound from this level supports long positions toward higher resistance zones. However, a break and close below 1.3380 would shift the outlook to neutral-to-bearish, favouring further downside correction. Traders should watch price action around 1.3380 for directional confirmation.
This communication is for informational purposes only and should not be viewed as any form of recommendation as to a particular course of action or as investment advice. It is not intended as an offer or solicitation for the purchase or sale of any financial instrument or as an official confirmation of any transaction. Opinions, estimates and assumptions expressed herein are made as of the date of this communication and are subject to change without notice. This communication has been prepared based upon information, including market prices, data and other information, believed to be reliable; however, Trade Nation does not warrant its completeness or accuracy. All market prices and market data contained in or attached to this communication are indicative and subject to change without notice.

The Day Ahead Economic Data:
Markets will focus on early June PMI data from the US, UK, Japan, Germany, France, and the Eurozone, giving a snapshot of global economic health. The US May existing home sales report will show how housing is holding up under high mortgage rates.
Central Banks:
Several Fed officials (Waller, Bowman, Goolsbee, Williams, Kugler) will speak—investors will watch for hints on rate cuts. From the ECB, speeches by President Lagarde and Nagel may offer insight into the pace of European rate cuts.
Other:
The EU-Canada summit may highlight cooperation on trade, clean tech, and key resources, though it's unlikely to move markets much.
This communication is for informational purposes only and should not be viewed as any form of recommendation as to a particular course of action or as investment advice. It is not intended as an offer or solicitation for the purchase or sale of any financial instrument or as an official confirmation of any transaction. Opinions, estimates and assumptions expressed herein are made as of the date of this communication and are subject to change without notice. This communication has been prepared based upon information, including market prices, data and other information, believed to be reliable; however, Trade Nation does not warrant its completeness or accuracy. All market prices and market data contained in or attached to this communication are indicative and subject to change without notice.
The 3 Step Rocket Booster Strategy – Bullish Setup BreakdownHey traders!
Here’s a trade idea on GBP/USD using a multi-timeframe trend strategy I call the Rocket Booster Strategy. It’s based on trend strength, oscillator signals, and price action confirmation.
---
📊 Weekly Chart – The Big Picture
The Stochastic RSI on the weekly chart recently pulled back near the 80 zone. This isn’t a reversal — it’s a healthy pause in a strong uptrend. I’m watching for a breakout continuation as momentum builds up.
---
📉 Daily Chart – Oversold Alert
On the daily chart, the Stochastic RSI dropped below 20, signaling that GBPUSD might be ready for a bullish reversal. It’s setting the stage for a solid long opportunity — as long as the trend agrees.
---
🕯 4H Chart – Bullish Engulfing Entry
This is where it gets exciting — a clear Bullish Engulfing pattern has formed on the 4-hour chart. That’s my entry trigger. This confirms the reversal idea with a strong price action signal.
---
✅ Rocket Booster Strategy Criteria
To take a long trade using this strategy, I require all 3 of the following:
1. ✅ Price is above the 50 EMA
2. ✅ Price is above the 200 EMA
3. ✅ A breakout or gap-up is either happening or imminent
All three conditions are currently aligning on GBPUSD — this is a potential high-probability setup.
---
💡 Optional Tip for Automation
If you’d like to automate this entry using alerts on TradingView, you’ll need a paid monthly plan to unlock multiple alerts and advanced conditions like candlestick detection or EMA confirmation.
---
⚠️ Disclaimer
Trading is risky. Always use:
Proper risk management
Well-placed stop-losses
A demo account to test your strategy
And take profits with discipline 🧠💰
---
🔚 Final Thoughts
This is a clean example of trend trading with structure and precision.
I used multi-timeframe analysis, the Stochastic RSI, and price action to time the entry. If you're learning trading, this is a great case to study or test in your journal.
Let me know what you think or how you'd manage this trade.
Happy trading! 📈💥
---

GBPUSD London Session | Live Forex Analysis & Trade ideasIn today’s London session, we conducted a detailed intraday analysis on the GBPUSD currency pair using wave structure analysis on the 5-minute (M5) timeframe.
Price action confirmed a break below bullish market structure that had previously formed the Asian session high, signalling a potential shift in market sentiment to the downside. This breakdown confirmed short-term bearish momentum shift.
Following the completion of the bearish wave, the price retraced to form a structural pullback (trend reset), providing a discounted price zone for new short positions and offering profit-taking opportunities for earlier sellers.
Our trading plan for this session is to sell GBPUSD at 1.3488, anticipating a move below the midline (ML) support at 1.3462. The technical target for this trade, based on our London-New York session projection, is set at 1.3417.
The stop-loss for this setup is placed above MH of the bearish structure at 1.3505, maintaining proper risk management.
This trade idea aligns with our trend-following strategy and is supported by real-time price action analysis.
📉 Short Bias Confirmed
🎯 Entry: 1.3488
🛑 Stop Loss: 1.3505
✅ Take Profit: 1.3417
Trade safe, manage your risk, and stay blessed.

GBPUSD DID YOU KNOW THAT YOUR COUNTRY CENTRAL BANKS HAVE ANOTHER
CENTRAL BANK AND IS CALLED BIS(BANK OF INTERNATIONAL SETTLEMENTS )???
The Bank for International Settlements (BIS) was established in 1930 at the Hague Conference, making it the world's oldest international financial institution. Its initial purpose was to facilitate the settlement of World War I reparations and to promote cooperation among central banks.
The BIS trading market refers to the role of the Bank for International Settlements (BIS) as a key intermediary and facilitator in global financial markets, particularly in foreign exchange (FX) and central bank transactions
BIS is a secretive institution with sovereign immunity that can move trillions without oversight. aka central bank of central banks in Basel Swissland with over 63 members in the world which are centrals banks of countries that make up 95% of world GDP.
Key Points about BIS and Its Trading Market Role:
Central Bank’s Central Bank: BIS acts as a bank for central banks and international organizations, providing banking services such as accounts, gold and currency transactions, asset management, and short-term collateralized loans.
Market Intermediary: BIS frequently conducts large-scale transactions on behalf of central banks in the foreign exchange and gold markets. These trades are often substantial, reflecting central banks’ reserve management or monetary policy operations.
Avoiding Market Misinterpretation: When BIS buys or sells currencies or assets, it is usually acting for a central bank, not itself, helping avoid markets mistaking these large trades for speculative or official government interventions.
Forum for Cooperation: BIS provides a platform for central banks to exchange information, coordinate policies, and cooperate on monetary and financial stability, which indirectly influences market dynamics.
Research and Statistics: BIS publishes data and analysis on global banking, FX, derivatives markets, and financial stability, supporting informed decision-making in the trading community.
Summary
The BIS trading market is not a public exchange but a specialized, high-level market where BIS facilitates and conducts financial transactions for central banks, particularly in foreign exchange and gold. Its activities help central banks manage reserves and implement monetary policy while fostering international financial cooperation.
if you know you know because BOE (BANK OF ENGLAND ) and FED (FEDERAL RESERVE ) are members .
GBPUSD 10 YEAR BOND YIELD ,INTEREST RATE ,INTEREST RATE DIFFERENTIAL AND CARRY TRADE ADVANTAGE .
1. Current Rates and Yields
Metric United Kingdom (GBP) United States (USD) Differential (UK - US)
10-Year Bond Yield 4.54% 4.38% +0.16% (16 bps)
Policy Interest Rate 4.25% 4.25%–4.50% -0.25% to -0.01%
UK Context: The Bank of England (BoE) held rates at 4.25% amid sticky inflation (3.4% YoY in May ) but signaled potential cuts in August.
US Context: The Federal Reserve held rates at 4.25%–4.50%, prioritizing inflation control despite slowing growth .
2. Interest Rate Differential and Carry Trade Advantage
Yield Spread: The UK 10-year gilt yields 0.16% more than the US 10-year Treasury, creating a modest yield pickup for GBP-denominated bonds .
Policy Rate Spread: The USD offers a 0.25% higher short-term rate (using the Fed’s 4.50% upper bound vs. BoE’s 4.25%) .
Carry Trade Mechanics:
GBP-USD Strategy: Borrow USD at 4.50% and invest in GBP assets at 4.54% (10-year gilt) for a net carry of +0.04%.
USD-GBP Strategy: Borrow GBP at 4.25% and invest in USD assets at 4.38% (10-year Treasury) for a net carry of +0.13%.
Key Risks:
Currency Volatility: GBP/USD at 1.34–1.35 could erase gains if the dollar strengthens.
Policy Shifts: BoE rate cuts (expected August 2025) may narrow the yield spread , while Fed cuts could reduce USD rate advantages .
3. Market Outlook
UK Focus: Inflation persistence may delay BoE cuts, supporting GBP yields near-term .
US Focus: Fed’s "higher for longer" stance and tariff-related inflation risks could sustain USD yield appeal .
Carry Viability: The USD-GBP strategy offers a slight edge (0.13% carry) but requires hedging against GBP appreciation risks.
Summary
Yield Advantage: UK 10-year gilts yield 0.16% more than US Treasuries, but USD short-term rates are 0.25% higher.
Optimal Carry: Borrowing GBP to invest in USD assets (0.13% carry) is marginally favorable, though policy uncertainty warrants caution.
Critical Factors: Monitor BoE/Fed rate decisions and GBP/USD trends for carry trade adjustments.

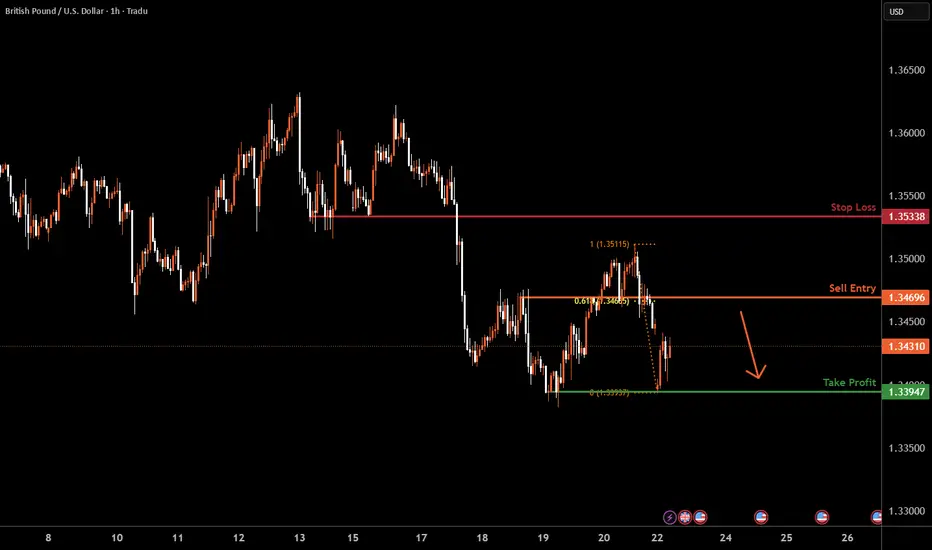
GBPUSD H1 I Bearish Reversal Based on the H4 chart, the price is rising our sell entry level at 1.3469, a pullback resistance that aligns with the 61.8% Fib retracement.
Our take profit is set at 1.3394, a swing low support.
The stop loss is set at 1.3533, a pullback resistance.
High Risk Investment Warning
Trading Forex/CFDs on margin carries a high level of risk and may not be suitable for all investors. Leverage can work against you.
Stratos Markets Limited (tradu.com ):
CFDs are complex instruments and come with a high risk of losing money rapidly due to leverage. 63% of retail investor accounts lose money when trading CFDs with this provider. You should consider whether you understand how CFDs work and whether you can afford to take the high risk of losing your money.
Stratos Europe Ltd (tradu.com ):
CFDs are complex instruments and come with a high risk of losing money rapidly due to leverage. 63% of retail investor accounts lose money when trading CFDs with this provider. You should consider whether you understand how CFDs work and whether you can afford to take the high risk of losing your money.
Stratos Global LLC (tradu.com ):
Losses can exceed deposits.
Please be advised that the information presented on TradingView is provided to Tradu (‘Company’, ‘we’) by a third-party provider (‘TFA Global Pte Ltd’). Please be reminded that you are solely responsible for the trading decisions on your account. There is a very high degree of risk involved in trading. Any information and/or content is intended entirely for research, educational and informational purposes only and does not constitute investment or consultation advice or investment strategy. The information is not tailored to the investment needs of any specific person and therefore does not involve a consideration of any of the investment objectives, financial situation or needs of any viewer that may receive it. Kindly also note that past performance is not a reliable indicator of future results. Actual results may differ materially from those anticipated in forward-looking or past performance statements. We assume no liability as to the accuracy or completeness of any of the information and/or content provided herein and the Company cannot be held responsible for any omission, mistake nor for any loss or damage including without limitation to any loss of profit which may arise from reliance on any information supplied by TFA Global Pte Ltd.
The speaker(s) is neither an employee, agent nor representative of Tradu and is therefore acting independently. The opinions given are their own, constitute general market commentary, and do not constitute the opinion or advice of Tradu or any form of personal or investment advice. Tradu neither endorses nor guarantees offerings of third-party speakers, nor is Tradu responsible for the content, veracity or opinions of third-party speakers, presenters or participants.

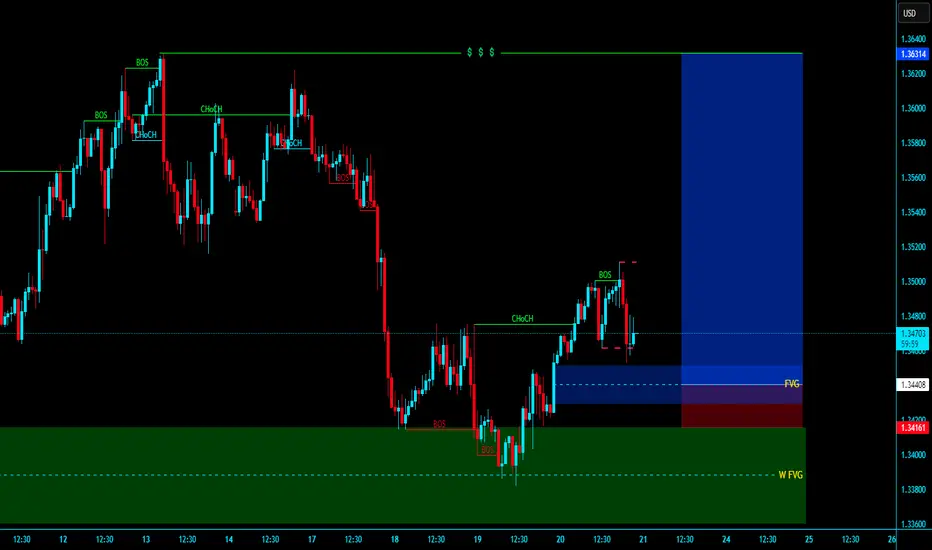
Bearish GBP/USD Outlook: Shorting the Pound Against the DollarI can write a lot of text here but let make it short, liek and sub from you for that:
3 options:
pump till PDH then dump to weekly FVG 1.34 area
dump from here till weekly FVG 1.34 area
if it breaks above PWH with good volume and closing at least on 4h then only longs

GBPUSD TRADE SETUPWait for retest the entry level then take a trade for Sell othewise skip this setup

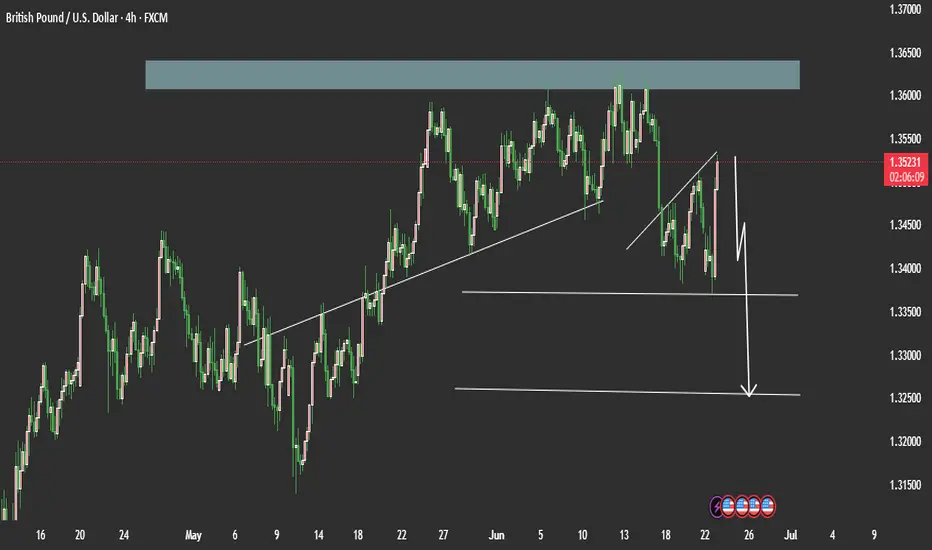
GBP/USD H4 AnalysisPrice has broken below the daily trendline, where it found support on four separate occasions.
When retesting the trendline last week, price appeared to reject with 2 consecutive 4 hour bearish candles.
If you agree with this analysis then look for a sell setup that meets your strategy rules.

GBP/USD Potential Bullish ReversalGBP/USD Potential Bullish Reversal 📈🦾
📊 Technical Analysis Overview:
The chart showcases a well-defined horizontal range between the support (~1.31900) and resistance (~1.36200) zones. The price action has respected these levels multiple times, forming a clear accumulation zone at the bottom and rejection at the top.
🔄 Pattern Formation:
A Rounded Bottom (Cup) structure is visible forming from the June low.
The price made a bullish bounce near the key support level at 1.33930, marked by an orange circle, suggesting a potential higher low formation.
The blue downtrend line from the recent high (red arrow) has been broken, indicating a trend reversal attempt.
📍 Current Price: 1.34494
🎯 Target Zone: 1.35734
🛑 Support to Watch: 1.33930
📈 Bullish Confirmation:
A break above the minor neckline (around current price) would confirm a cup & handle breakout with a projected target of 1.35734.
Strong buying pressure and higher lows are reinforcing bullish strength.
⚠️ Risk Management Tip:
A breakdown below 1.33930 would invalidate the bullish setup and could retest the major support zone (~1.31900).
✅ Bias: Bullish, unless price closes below 1.33930
🕒 Outlook: Short- to Mid-term Upside Potential

Weekly Market Analysis
This is my Weekly Analysis for GBPUSD using volume profile, price action and ICT hybrid.

-0.5% Week | A Tough Reminder: Risk Management is EverythingFirst trade hit 2R , exited early due to the bank holiday.
Next day, I gave it all back. 3 stop-losses. Poor risk management .
I got overconfident after being in profit and paid the price.
Also realized mobile tools (like SL placement on TradingView app) can hurt if not set up right.
Last week was +6% with strict risk rules.
This week? A reminder that trading is 90% mindset and discipline.
Lessons:
• Protect your capital, always.
• Don’t loosen your rules after a win.
• Your edge only works if you follow your plan.
Stay disciplined. Survive the noise. Let your edge play out.

NEXT WEEK CHECK GBPUSD SIGNAL READ CAPTAINEntry: around 1.34490) 1.34390✅
Take Profit 1.34100 ✅
Take Profit 2:1.33740 ✅
Last Target:1.33340✅
Stop Loss: 1.34800❌

GBPUSDFor this pair my bias is leaning to the sellers making there way into the market for the upcoming week june 23-june 27 week ahead we have several news factors that could affect the market also the on going war in the middle east

# GBPUSD WEEKLY FVG MITIGATED AND MSS ENTYR IN FVG # GBPUSD Weekly FVG Mitigated and mss our entry in fvg and target is our BSL