GBPUSD Sellers In Panic! BUY!
My dear friends,
Please, find my technical outlook for GBPUSD below:
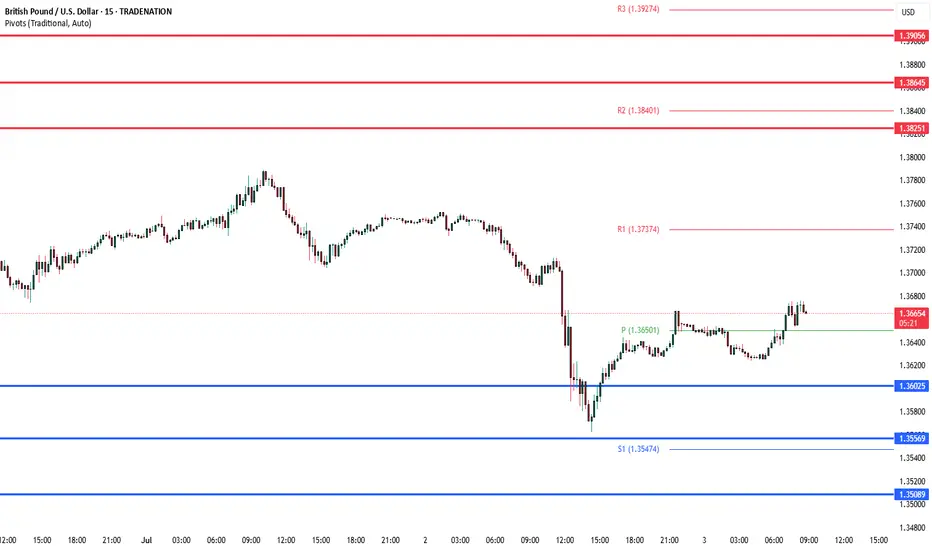
The price is coiling around a solid key level - 1.3638
Bias - Bullish
Technical Indicators: Pivot Points Low anticipates a potential price reversal.
Super trend shows a clear buy, giving a perfect indicators' convergence.
Goal - 1.3653
About Used Indicators:
The pivot point itself is simply the average of the high, low and closing prices from the previous trading day.
Disclosure: I am part of Trade Nation's Influencer program and receive a monthly fee for using their TradingView charts in my analysis.
———————————
WISH YOU ALL LUCK
GBPUSD_SPT trade ideas

GU| - Bullish Ride in Motion | Key Zone Hold into New WeekPair: GBPUSD
Bias: Bullish
Timeframes: 4H, 2H, 30M
• 4H showing strong bullish momentum — price pushed aggressively, and we caught the move. Heading into next week, the bullish continuation is still valid unless price tells us otherwise.
• 30M gave a sweep from a refined OB zone — circled area shows the key move. Watching closely to see if bulls truly hold that ground.
• 2H gives a clear picture of structure — smooth directional flow confirming the bias.
🔹 Entry: After break of micro LH for confirmation
🔹 Entry Zone: Will be found within price flow — post-shift
🔹 Target: Structure highs — same continuation goal if bulls follow through
Mindset: No chasing. We wait, let price do the heavy lifting. Our job is to react with clarity, not emotion.
Bless Trading!

Gbpusd long idea after reversalUpdate of previous call after we broke structure.
I see this one attacking buyside liquidity at equal highs formed on Tuesday.
Possible market maker buy model playing out here.

LONGS EN GBP USDFIBO
MONTHLY OB AND 50% CANDLE OF POWER
WEEKLY OB
VALIDATION OF STRUCUTURE
POTENTIAL TRADE 65 to 75% el probability of accomplishment


GBPUSD WEEKLY CRTMonthly: Bearish bias maintained
Weekly: Retrace into imbalance → bearish rejection watch
Daily: Ideal for SMC traders to hunt short setups

Gbpusd short idea I like this premium zone.
I am looking at 1.36544 to 1.36498 as good price to sell from.
Target is still same, refer to previous post.

GBPUSD 1.3600 support retestThe GBPUSD currency pair continues to exhibit a bullish price action bias, supported by a sustained rising trend. Recent intraday movement reflects a sideways consolidation breakout, suggesting potential continuation of the broader uptrend.
Key Technical Level: 1.3600
This level marks the prior consolidation range and now acts as pivotal support. A corrective pullback toward 1.3600 followed by a bullish rejection would reinforce the bullish trend, targeting the next resistance levels at:
1.3825 – Near-term resistance
1.3865 – Minor swing high
1.3900 – Longer-term bullish objective
On the other hand, a decisive daily close below 1.3600 would invalidate the bullish setup, shifting the outlook to bearish in the short term. This could trigger a deeper retracement toward:
1.3550 – Initial support
1.3500 – Key downside target
Conclusion:
As long as 1.3600 holds as support, the technical outlook remains bullish, favoring long positions on dips. A confirmed break below this level would signal a shift in sentiment and open the door to a corrective pullback phase.
This communication is for informational purposes only and should not be viewed as any form of recommendation as to a particular course of action or as investment advice. It is not intended as an offer or solicitation for the purchase or sale of any financial instrument or as an official confirmation of any transaction. Opinions, estimates and assumptions expressed herein are made as of the date of this communication and are subject to change without notice. This communication has been prepared based upon information, including market prices, data and other information, believed to be reliable; however, Trade Nation does not warrant its completeness or accuracy. All market prices and market data contained in or attached to this communication are indicative and subject to change without notice.

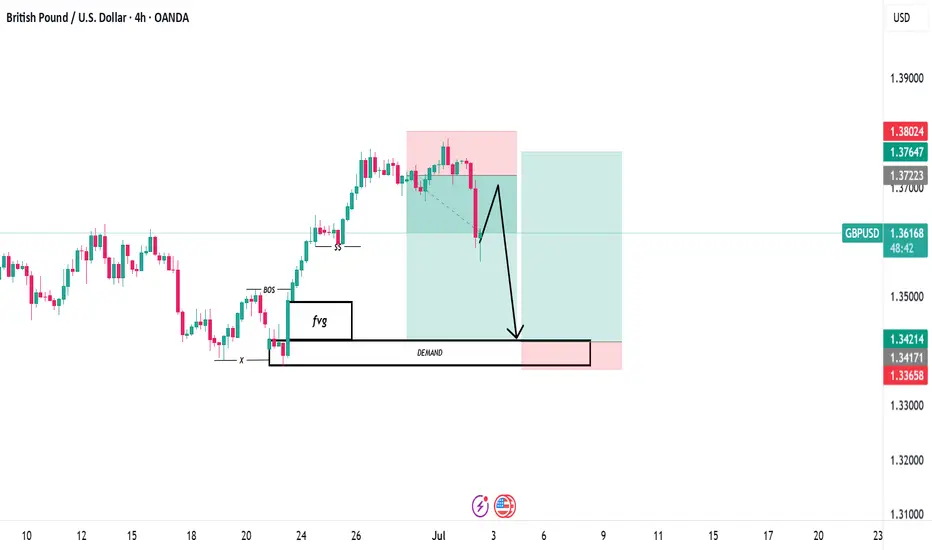
GBPUSD LongLooking to the upside got BoS pull back into FVG with the second retest. Looking for the bullish extension to the upside.

The Day Ahead - US Employment, NFP in focus Thursday, July 3 – Market Focus
Key Economic Data:
US:
June Jobs Report – Crucial for gauging labor market momentum and Fed rate expectations.
ISM Services PMI (June) – Offers insight into the largest sector of the economy.
May Trade Balance, Factory Orders, Initial Jobless Claims – Together provide a fuller picture of external demand, industrial health, and labor market stress.
China:
Caixin Services PMI (June) – Reflects private sector service activity and post-pandemic demand strength.
UK:
June Official Reserve Changes – Could hint at FX intervention patterns or reserve rebalancing.
Italy:
Services PMI (June) – A regional gauge of Eurozone service sector strength.
Canada:
May International Merchandise Trade – Key for assessing external demand and commodity flow impact.
Switzerland:
June CPI – Critical for SNB policy outlook, especially post recent rate cut.
Central Bank Highlights:
ECB:
June Meeting Account – May provide clarity on the timing and pace of further policy normalization.
Fed:
Bostic Speaks – Watch for clues on his stance regarding rate cuts amid mixed data signals.
BoJ:
Takata Speaks – Important for any policy tone shift as the market eyes potential tightening.
BoE:
June Decision Maker Panel (DMP), Q2 Bank Liabilities & Credit Conditions Surveys – These offer insights into business inflation expectations and credit supply constraints, key for the BoE’s future policy path.
This communication is for informational purposes only and should not be viewed as any form of recommendation as to a particular course of action or as investment advice. It is not intended as an offer or solicitation for the purchase or sale of any financial instrument or as an official confirmation of any transaction. Opinions, estimates and assumptions expressed herein are made as of the date of this communication and are subject to change without notice. This communication has been prepared based upon information, including market prices, data and other information, believed to be reliable; however, Trade Nation does not warrant its completeness or accuracy. All market prices and market data contained in or attached to this communication are indicative and subject to change without notice.
GBP/USD Slides with Fiscal WorriesGBP/USD edged lower toward 1.3625 in Asian trading, pressured by a sharp selloff in UK government bonds and growing fiscal concerns.
Gilts suffered their biggest drop since October 2022 after the government’s decision to cut welfare benefits and mounting doubts over the Chancellor’s political future.
Marc Chandler, Chief Market Strategist at Bannockburn Global Forex LLC, noted: “The drop isn’t limited to the British Pound, UK gilts are also under heavy selling. It seems to be a broader crisis of confidence in the Labour government.”
Resistance is at 1.3675, while support holds at 1.3570.

GU-Thu-03/07/25 TDA-UK political turmoil triggers market selloffAnalysis done directly on the chart
Follow for more, possible live trades update!
I often share my live trades in Tradingview public chat in London session, stay tuned!
I don't give signals blindly, people should learn
and understand the skill.
Following blindly signals you won't know how to
manage the trade, lot size and replicate the move
over time.
That's why you need active real time discussions.
Trading is not get rich quick scheme!
Active in London session!
Not financial advice, DYOR.
Market Flow Strategy
Mister Y

GBPUSD 30m – Elliott Wave + AO ConfirmationPrice is currently testing the 1.36277 zone. I’m closely monitoring for a break of structure below this level. If it breaks, I’ll be watching for a pullback setup to short, ideally aligning with BBMA/EMA confluence.
The wave structure looks clean:
• ✅ Wave (1), (2), (3), and (4) are completed.
• ✅ AO histogram also confirms momentum waves (1) to (4), with the current move likely to complete Wave (5) to the downside.
• 🔻 Wave (4) retraced into the previous imbalance zone and respected resistance, giving further confluence for bearish continuation.
Looking to target below 1.3500 for Wave (5) completion.
Key Levels to Watch:
• 🔑 Break below 1.36277 = Bearish confirmation
• 🎯 Potential TP Zone: 1.3450 – 1.3425
• 🚫 Invalidation if price closes above 1.3700 with momentum
Let’s see how price reacts at this key level 👀
#GBPUSD #ElliottWave #AO #PriceAction #BreakOfStructure #TradingView

Gbpusd short idea I like the daily bearish momentum to the down side.
Not trying to pick the top or anything but I think will will see a follow through.
I like one of the nearest internal range liquidity pool depicted with green line.
Let's see how it goes!

GBPUSD InsightHello to all subscribers,
Please feel free to share your personal opinions in the comments. Don’t forget to hit the booster and subscribe!
Key Points
- According to the ADP National Employment Report, U.S. private employment in June decreased by 33,000 compared to the previous month — the first negative figure since March 2023. This has strengthened expectations for interest rate cuts.
- U.S. President Donald Trump announced that a trade agreement has been reached with Vietnam. Reportedly, Vietnam has agreed to significantly lower its tariffs to 20% in exchange for opening its market. This has raised hopes for progress in ongoing trade negotiations with other countries.
- The EU trade team is currently in Washington, D.C., negotiating with the U.S. side and is reportedly requesting preemptive tariff exemptions in certain sectors.
- In the U.K., the welfare reform plan proposed by the Labour government has been significantly scaled back. Prime Minister Keir Starmer has not confirmed his confidence in Chancellor Rachel Reeves, leading to growing speculation that she may be replaced. If Reeves — who has emphasized fiscal discipline — is replaced, there are concerns that fiscal control could loosen.
Key Economic Events This Week
+ July 3: U.S. Non-Farm Payrolls (June), U.S. Unemployment Rate (June)
GBPUSD Chart Analysis
After maintaining an upward trend, GBPUSD experienced a sharp drop. However, the pair appears to have regained its bullish momentum with support from the trendline. The upward view will be maintained toward the resistance level of 1.40000, the trend’s previous high.
That said, caution is advised near the 1.38000 level, where the previous sharp decline occurred, as this zone could introduce volatility.

Sell to Buy ModelTho the sell hit sl but still went according to plan. Still Bullish and holding this buy for NFP happening tomorrow

Political Uncertainty, Dollar Weakness & A Projected CorrectionDespite being a technical trader, there are some fundamental factors floating in the background of today's trading idea.
1) We saw weakness on the GBP today due to some political uncertainty & investors having concerns over the stability of the UK's leadership and economic direction.
2) We saw a drop in the ADP Non-Farm Employment Change for the US Dollar today which is starting to look like a trend rather than a one-off.
Why this is important is because, despite the very bearish day that the FX:GBPUSD had today, I don't think the GBP reaction is as relevant as it's shown and I do think the USD is weaker than it's shown on this particular chart, due to the reactions that we've seen on other crosses.
All in all, that this means is that I wouldn't be shocked to see today's move corrected and price is at the perfect technical level to do just that.
If you have any questions, comments or opinions, please don't hesitate to leave them below.
Akil

Bearish reversal off 50% Fibonacci resistance?The Cable (GBP/USD) is rising towards the pivot and could drop to the 1st support.
Pivot: 1.3681
1st Support: 1.3595
1st Resistance: 1.3746
Risk Warning:
Trading Forex and CFDs carries a high level of risk to your capital and you should only trade with money you can afford to lose. Trading Forex and CFDs may not be suitable for all investors, so please ensure that you fully understand the risks involved and seek independent advice if necessary.
Disclaimer:
The above opinions given constitute general market commentary, and do not constitute the opinion or advice of IC Markets or any form of personal or investment advice.
Any opinions, news, research, analyses, prices, other information, or links to third-party sites contained on this website are provided on an "as-is" basis, are intended only to be informative, is not an advice nor a recommendation, nor research, or a record of our trading prices, or an offer of, or solicitation for a transaction in any financial instrument and thus should not be treated as such. The information provided does not involve any specific investment objectives, financial situation and needs of any specific person who may receive it. Please be aware, that past performance is not a reliable indicator of future performance and/or results. Past Performance or Forward-looking scenarios based upon the reasonable beliefs of the third-party provider are not a guarantee of future performance. Actual results may differ materially from those anticipated in forward-looking or past performance statements. IC Markets makes no representation or warranty and assumes no liability as to the accuracy or completeness of the information provided, nor any loss arising from any investment based on a recommendation, forecast or any information supplied by any third-party.

Bullish bouce off major support?GBP/USD has bounced off the support level which is an overlap support that lines up with the 38.2% Fibonacci retracement and could rise from this level to our take profit.
Pivot: 1.3609
Why we like it:
There is an overlap support level which lines up with the 38.2% Fibonacci retracement.
Stop loss: 1.3534
Why we like it:
There is a pullback support that is slightly above the 61.8% Fibonacci retracement.
Take profit: 1.3750
Why we like it:
There is a pullback resistance.
Enjoying your TradingView experience? Review us!
Please be advised that the information presented on TradingView is provided to Vantage (‘Vantage Global Limited’, ‘we’) by a third-party provider (‘Everest Fortune Group’). Please be reminded that you are solely responsible for the trading decisions on your account. There is a very high degree of risk involved in trading. Any information and/or content is intended entirely for research, educational and informational purposes only and does not constitute investment or consultation advice or investment strategy. The information is not tailored to the investment needs of any specific person and therefore does not involve a consideration of any of the investment objectives, financial situation or needs of any viewer that may receive it. Kindly also note that past performance is not a reliable indicator of future results. Actual results may differ materially from those anticipated in forward-looking or past performance statements. We assume no liability as to the accuracy or completeness of any of the information and/or content provided herein and the Company cannot be held responsible for any omission, mistake nor for any loss or damage including without limitation to any loss of profit which may arise from reliance on any information supplied by Everest Fortune Group.

GBPUSD I Weekly CLS I Model 1 I Target 50%Hey, Market Warriors, here is another outlook on this instrument
If you’ve been following me, you already know every setup you see is built around a CLS Footprint, a Key Level, Liquidity and a specific execution model.
If you haven't followed me yet, start now.
My trading system is completely mechanical — designed to remove emotions, opinions, and impulsive decisions. No messy diagonal lines. No random drawings. Just clarity, structure, and execution.
🧩 What is CLS?
CLS is real smart money — the combined power of major investment banks and central banks moving over 6.5 trillion dollars a day. Understanding their operations is key to markets.
✅ Understanding the behavior of CLS allows you to position yourself with the giants during the market manipulations — leading to buying lows and selling highs - cleaner entries, clearer exits, and consistent profits.
📍 Model 1
is right after the manipulation of the CLS candle when CIOD occurs, and we are targeting 50% of the CLS range. H4 CLS ranges supported by HTF go straight to the opposing range.
"Adapt what is useful, reject what is useless, and add what is specifically your own."
— David Perk aka Dave FX Hunter ⚔️
👍 Hit like if you find this analysis helpful, and don't hesitate to comment with your opinions, charts or any questions.

Excepting a bullish movement on GBPUSD H4GBPUSD has been on a strong bullish momentum for months now, though having some correctional moves. GBPUSD gave two demand zones, forming a rally base rally, given a buy signal (bullish pin bar) on H4,we expect a bullish run to the first resistance before any corrections.

skraaaaaa!!!check my previous post and you will see the before of this trade and a comprehensive explanation of my bias and analysis knowledge truly is power want learn SMC concept reach out to me and get a comprehensive understanding today
GBPUSD sweep of lowGBPUSD sweep of low reclaim of low and respecting liquidity aree take to weekly high cautiously after that short of lifetime
