CHECK GBPUSD SIGNAL READ CAPTAINgbpusd buy now ✅
entry point (1.34450) (1.34350)
TAKE PROFIT 1: (1.34350)
TAKE PROFIT 2: (1.35050)
LAST TARGET (1.35400)
STOP LOSS (1.34000)
GBPUSD_SPT trade ideas

Bearish till 1.35158.Price has created a bearish Type 1 dealing range on the 1 hour chart within a type 2 dealing range. This warrants bearish price action till 1.35158. My entry is at 1.35892 which lines up with both the equilibrium price level of the range as well as the consequent encroachment of the balanced price range. Furthermore, note the market maker sell model formation on the 1H chart. This poses a high probability sell set-up.

Short till 1.34557Price has entered the sellside curve of the market maker sell model. This has warranted bearish momentum down to 1.34557.

Bullish bounce off overlap support?GBP/USD is falling towards the support level which is an overlap support that aligns with the 38.2% Fibonacci retracement and could bounce from this level to our take profit.
Entry: 1.3443
Why we like it:
There is an overlap support level.
Stop loss: 1.3359
Why we like it:
There is a pullback support that is slightly below the 50% Fibonacci retracement.
Take profit: 1.3530
Why we like it:
There is a pullback resistance level.
njoying your TradingView experience? Review us!
Please be advised that the information presented on TradingView is provided to Vantage (‘Vantage Global Limited’, ‘we’) by a third-party provider (‘Everest Fortune Group’). Please be reminded that you are solely responsible for the trading decisions on your account. There is a very high degree of risk involved in trading. Any information and/or content is intended entirely for research, educational and informational purposes only and does not constitute investment or consultation advice or investment strategy. The information is not tailored to the investment needs of any specific person and therefore does not involve a consideration of any of the investment objectives, financial situation or needs of any viewer that may receive it. Kindly also note that past performance is not a reliable indicator of future results. Actual results may differ materially from those anticipated in forward-looking or past performance statements. We assume no liability as to the accuracy or completeness of any of the information and/or content provided herein and the Company cannot be held responsible for any omission, mistake nor for any loss or damage including without limitation to any loss of profit which may arise from reliance on any information supplied by Everest Fortune Group.

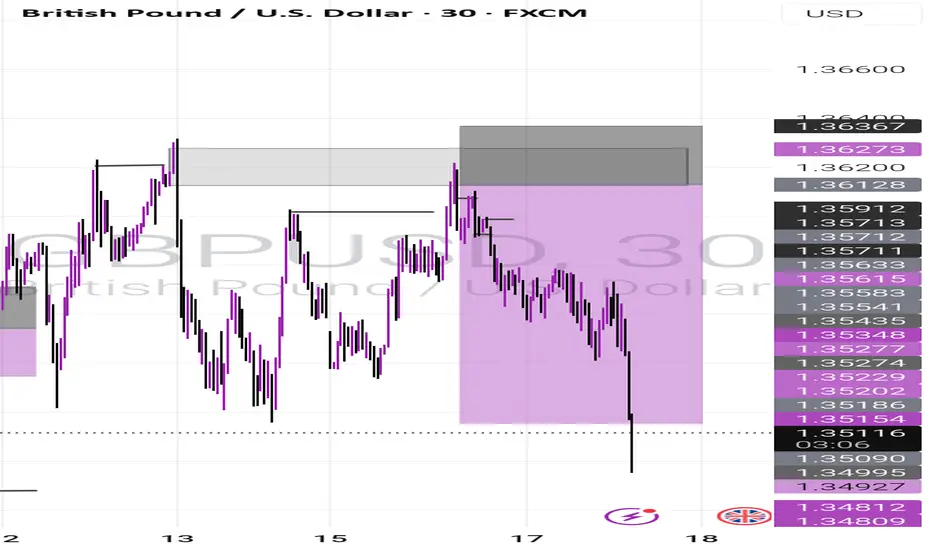
GBPUSD Sell Limit Activated June 17 2025This trade was taken today, (tuesday- june 17, 2025). Based on 1H timeframe Supply. I wait for London Session and check for possible liquidity sweep in 15 min and 5min timeframe. I noticed a CHOCH followed by tap in Supply zone of the schematics. I decide to create a sell limit order during New York Session to maximize the Risk to Reward Ratio. (Check the charts for detailed label and movement). 1:7RR
Wyckoff schematics in 1H timeframe--> confluence of supply in lower timeframes for validity.
RR:7
Another classic distribution. patience is the key :)
#wyckoff
#sell
#supplyanddemand

GBPUSD I Daily CLS I KL - OB I Model 1 I High riskHey, Market Warriors, here is another outlook on this instrument
If you’ve been following me, you already know every setup you see is built around a CLS Footprint, a Key Level, Liquidity and a specific execution model.
If you haven't followed me yet, start now.
My trading system is completely mechanical — designed to remove emotions, opinions, and impulsive decisions. No messy diagonal lines. No random drawings. Just clarity, structure, and execution.
🧩 What is CLS?
CLS is real smart money — the combined power of major investment banks and central banks moving over 6.5 trillion dollars a day. Understanding their operations is key to markets.
✅ Understanding the behavior of CLS allows you to position yourself with the giants during the market manipulations — leading to buying lows and selling highs - cleaner entries, clearer exits, and consistent profits.
📍 Model 1
is right after the manipulation of the CLS candle when CIOD occurs, and we are targeting 50% of the CLS range. H4 CLS ranges supported by HTF go straight to the opposing range.
"Adapt what is useful, reject what is useless, and add what is specifically your own."
— David Perk aka Dave FX Hunter ⚔️
👍 Hit like if you find this analysis helpful, and don't hesitate to comment with your opinions, charts or any questions.

#GBPUSDlooking for trades for this trade, no short entry for now no #financial advice, waiting for signals to enter.

Why I Think GBPUSD Will Sell...Technical AnalysisHey Rich Friends,
I hope you're well today. I wanted to share why I think GBPUSD will sell today and maybe more this week. This is only my technical analysis so make sure you check the news and cross reference the indicators you have on your chart. This is what I am looking at:
- The market hit a swing high on 4H and has been creating lower highs.
- The momentum is picking up for the sellers based on candle bodies.
- The stochastic is facing down, the slow line (orange) is on top of the fast line (blue) and both lines have crossed below 50. These are bearish confirmations for me.
Additional information:
- Wait for the stochastic to cross below 20.
- Wait for a break of structure below 1.35320.
- I will be setting sell stops so that my trades trigger on the way down. I will set previous highs as my SL and previous lows as my TPs.
Good luck if you decide to take this trade!
Peace and Profits,
Cha

GBPUSD ANALYSIS AND TRADE We've been tapped into the trade for GBPUSD
Let's see how the market would react.
Trade just became active, you can still join in

#GBPUSD: Smaller Time-Frame Tells A Different Story! GBPUSD has exhibited strong bullish sentiment in shorter timeframes. However, an analysis of shorter timeframes reveals a different picture. The current price trend is upward, and it is anticipated to continue. Nevertheless, we anticipate a price correction around 1.3470, followed by a continuation of the bullish move. We strongly recommend conducting your own analysis before making any investment decisions.
Best of luck in your trading endeavours, and please remember to prioritise safety.
Kindly consider liking, commenting, and sharing this analysis for further insights.
Team Setupsfx_

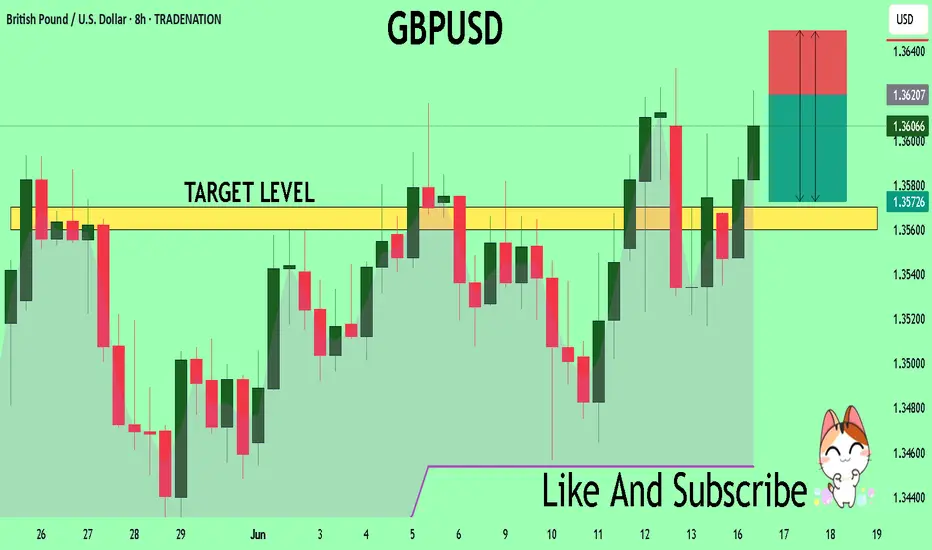
GBPUSD Will Collapse! SELL!
My dear friends,
Please, find my technical outlook for GBPUSD below:
The price is coiling around a solid key level - 1.3619
Bias - Bearish
Technical Indicators: Pivot Points Low anticipates a potential price reversal.
Super trend shows a clear sell, giving a perfect indicators' convergence.
Goal - 1.3570
Safe Stop Loss - 1.3649
About Used Indicators:
The pivot point itself is simply the average of the high, low and closing prices from the previous trading day.
Disclosure: I am part of Trade Nation's Influencer program and receive a monthly fee for using their TradingView charts in my analysis.
———————————
WISH YOU ALL LUCK
Target hit Last post I talked about the bearish momentum which gbpusd had and how it will follow up the chart. I'm now done for the day, anticipate more sell till it reaches my buy zone
GBPUSD - Shot Sell Story : Market has broken the strong support level of 1.35141 with good bearish momentum candle. This is a good sign of trend continuation. we plan our entry simply at the 0.382 level of fib once the market retraces which is 1.35279.
Anticipate : we anticipate market to remain bearish as it has broken the support level
Plan : we place our stoploss before the last LH and TP1 and TP2 with risk and reward of 1:1 and 1:2 accordingly.

GBPUSD - Next point of interestAfternoon All,
So our GBPUSD trade from earlier didn't quite go to plan however I knew full well that we were building liquidity to the left on the higher timeframe.
This will be my next point of interest for a potential long.
Lets see how price plays out when we get down there.
GBPUSD: Expecting Bullish Movement! Here is Why:
It is essential that we apply multitimeframe technical analysis and there is no better example of why that is the case than the current GBPUSD chart which, if analyzed properly, clearly points in the upward direction.
Disclosure: I am part of Trade Nation's Influencer program and receive a monthly fee for using their TradingView charts in my analysis.
❤️ Please, support our work with like & comment! ❤️

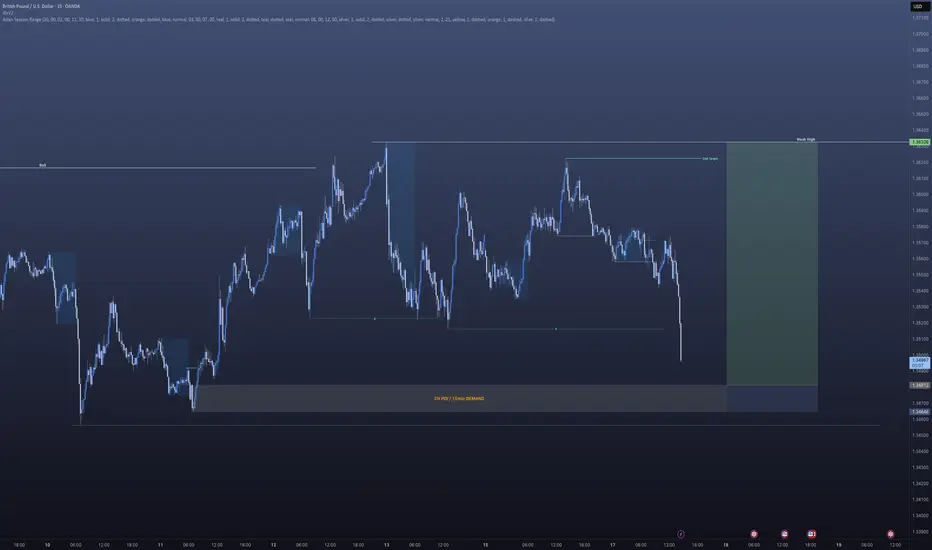
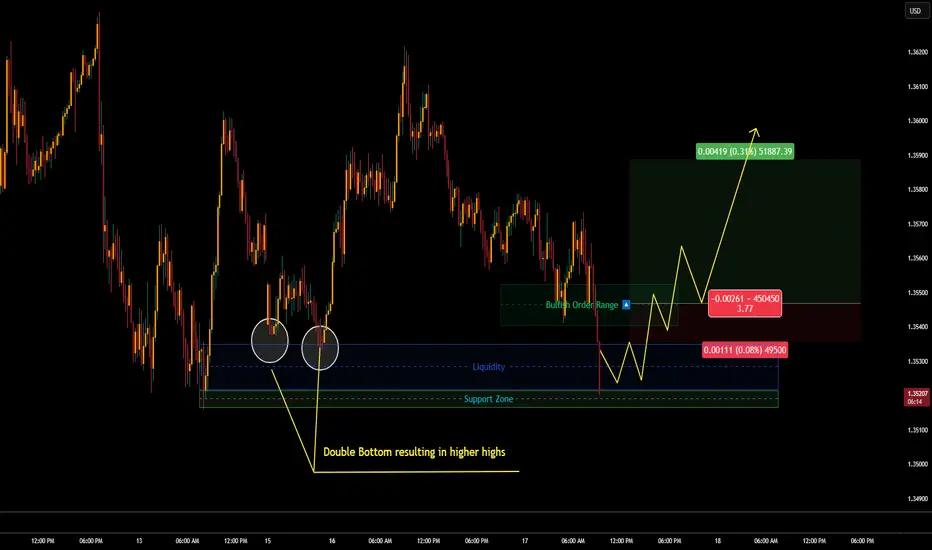
GBP/USD June 17th 20205 (Long)Just going to leave this here. Price is already extending below a secondary VWAP band. Its headed towards a low where liquidity was left from a double bottom.
This double bottom resulted in a set of higher highs. This shows significant buying levels at these prices. Liquidity sitting just above the supper area.
My entry model for today is:
Long @ 1.35468
Final Target: 1.35887
I would open this with 3 contracts on a 50k account
1st TP @ 1.35642 to close out 2 contracts.
GBPUSD Pre-NY + News SetupPressure to the downside ... until mid-week reversal
Snacking with this one:
GBPUSD BuyFollowing intraday market structure and order flow. Also, Daily cycle is yet to be completed.


GBPUSD SHORT FORECAST Q2 W25 D17 Y25GBPUSD SHORT FORECAST Q2 W25 D17 Y25
Professional Risk Managers👋
Welcome back to another FRGNT chart update📈
Diving into some Forex setups using predominantly higher time frame order blocks alongside confirmation breaks of structure.
Let’s see what price action is telling us today!
💡Here are some trade confluences📝
✅Weekly order block
✅15' order block
✅Intraday 15' break of structure
✅Tokyo ranges to be filled
🔑 Remember, to participate in trading comes always with a degree of risk, therefore as professional risk managers it remains vital that we stick to our risk management plan as well as our trading strategies.
📈The rest, we leave to the balance of probabilities.
💡Fail to plan. Plan to fail.
🏆It has always been that simple.
❤️Good luck with your trading journey, I shall see you at the very top.
🎯Trade consistent, FRGNT X

GBPUSD - LongUnfortunately I can't post the idea on the 5min to give you a better idea of where we are at in terms of the entry for this.
However I am looking to be tagged into this trade and have a limit order where I have set it.
Hoping to be tagged in. If we aren't we move on. and if we lose we move on.
If im able to help with any questions you may have do send them my way

GBPUSD - LONG Looking at GBPUSD
We have a great set up occurring on the 5min timeframe for a potential long.
We will see how it plays out and will do an update video on this later.

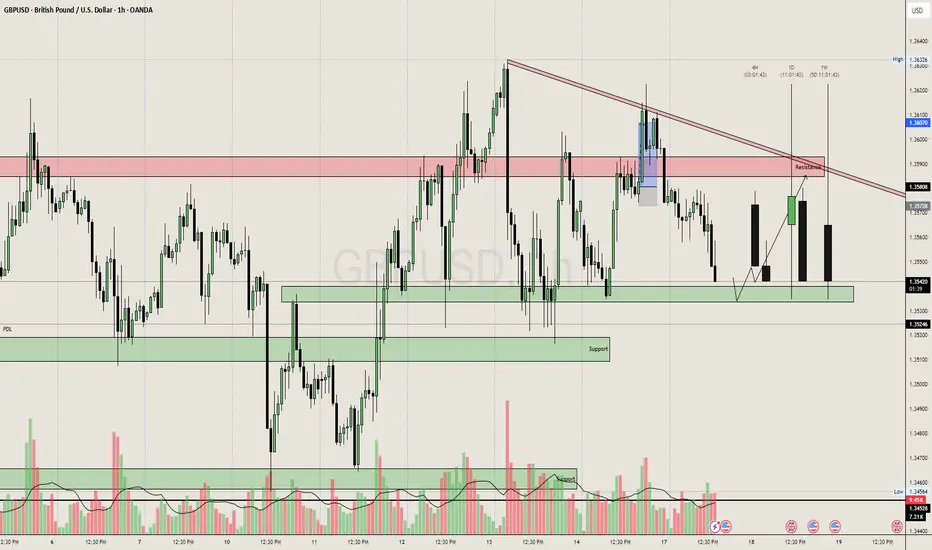
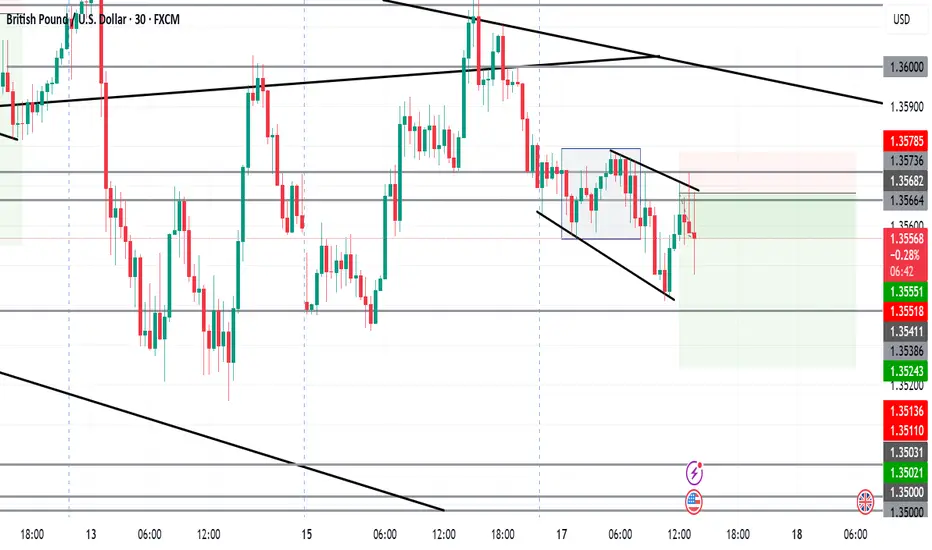
Here’s detailed breakdown for GBPUSD (1H chart)🏦 GBPUSD Analysis – June 17, 2025 | 1H Chart
🔻 Market Structure Overview
Currently ranging between 1.3524 support and 1.3607 resistance.
Price is inside a descending triangle – bearish structure.
Clean rejections from descending trendline; each retest brings in lower highs.
🔍 Key Zones
🔴 Resistance (1.3580–1.3610)
Multiple rejections + prior breaker block.
Last rally into this zone (highlighted in blue) was immediately sold off → liquidity grab.
Trendline confluence above it adds extra weight.
🟢 Support (1.3524–1.3544)
Price has bounced here 3 times → forming short-term demand.
However, each bounce is losing momentum – classic absorption sign.
🧠 Institutional Clues
Volume Spikes on down moves = sellers active at highs.
Up candles = low volume, weak buyer intent.
That wick fake-out at 1.3580 → clear stop hunt.
📉 Sell-Side Setup (Bias: Bearish)
Entry Concepts:
Sell on retest of broken structure near 1.3578–1.3590.
OR Breakdown play below 1.3524, wait for candle close & retest.
🎯 Targets:
TP1: 1.3500 psychological + low volume node
TP2: 1.3465 (marked previous low)
TP3: 1.3420–1.3400 (daily imbalance fill area)
🛑 Invalidation:
Break & hold above 1.3610, invalidates the triangle and flips to bullish breakout.
💡 Trade Idea Example:
Sell Limit @ 1.3580
SL: 1.3615
TP1: 1.3500
TP2: 1.3465
RR: ~1:3+
🔮 Final Thoughts:
GBPUSD is coiling inside a tightening structure; a breakdown is more likely due to bearish pressure, trendline resistance, and repeated absorption of buyers.
Watch DXY strength too — any bullish push on USD can trigger a clean flush.