Bullish Bias Holds for GBP/USD – Focus on 1.37500 BreakHi everyone,
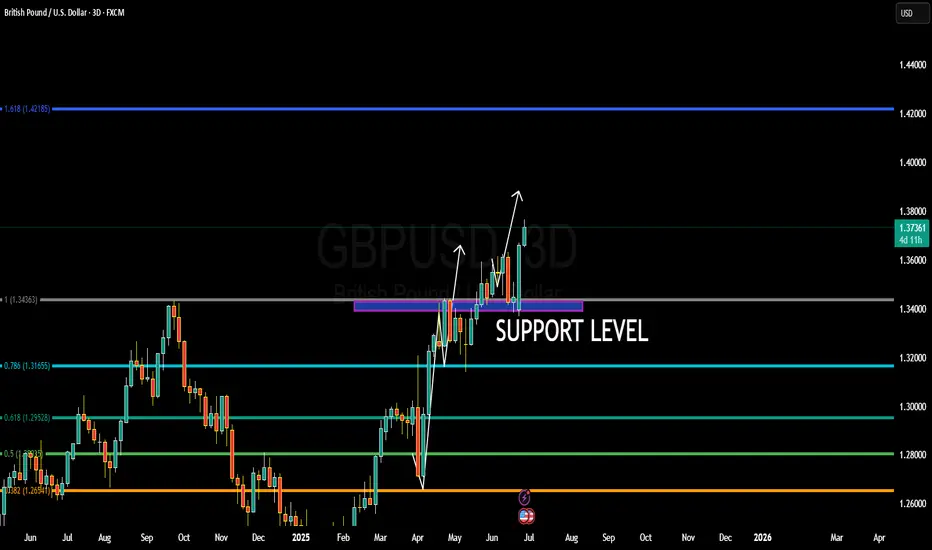
A strong push up from our highlighted support level at 1.33800 toward 1.36850 saw GBP/USD enter a brief period of consolidation. During the week, price action ranged between this newly established support and the 1.37500 resistance level.
Looking ahead, we anticipate a decisive break above 1.37500, which could open the way for further upside.
As previously noted, the clearance of these levels strengthens our expectation for further upside, with the next key level of interest around 1.38400. We'll be watching to see how price action develops from here.
We’ll continue to provide updates on the projected path for GBP/USD as price approaches this target.
The longer-term outlook remains bullish, and we expect the rally to continue extending further from the 1.20991 January low towards 1.40000 and 1.417000.
We’ll be keeping you updated throughout the week with how we’re managing our active ideas. Thanks again for all the likes/boosts, comments and follows — we appreciate the support!
All the best for the week ahead. Trade safe.
BluetonaFX
GBPUSD_SPT trade ideas


GBPUSD opportunity to go SHORTThe pair has been showing weakness for some time through RSI divergence.
On hourly chart it printed the indecision candle followed by two red candles. This gives us the cue for bearish momentum.
Since we need multiple reasons to short sell so we identify the recent low and if the price goes lower than this than we initiate a short trade.
For ready reference the TPs have been marked on chart.
wishing you a PROFIT-able trading.

GBPUSD Will Move Lower! Short!
Please, check our technical outlook for GBPUSD.
Time Frame: 12h
Current Trend: Bearish
Sentiment: Overbought (based on 7-period RSI)
Forecast: Bearish
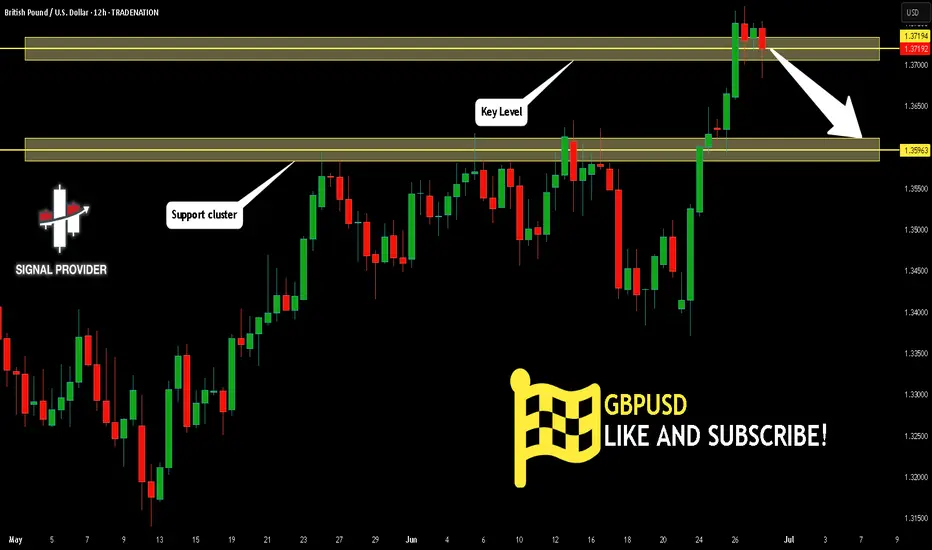
The market is approaching a key horizontal level 1.371.
Considering the today's price action, probabilities will be high to see a movement to 1.359.
P.S
We determine oversold/overbought condition with RSI indicator.
When it drops below 30 - the market is considered to be oversold.
When it bounces above 70 - the market is considered to be overbought.
Disclosure: I am part of Trade Nation's Influencer program and receive a monthly fee for using their TradingView charts in my analysis.
Like and subscribe and comment my ideas if you enjoy them!
GBPUSD sweep of lowGBPUSD sweep of low reclaim of low and respecting liquidity aree take to weekly high cautiously after that short of lifetime

GBPUSDCable still have some upside towards the level highlighted on the chart.
Disclosure: We are part of Trade Nation's Influencer program and receive a monthly fee for using their TradingView charts in our analysis.

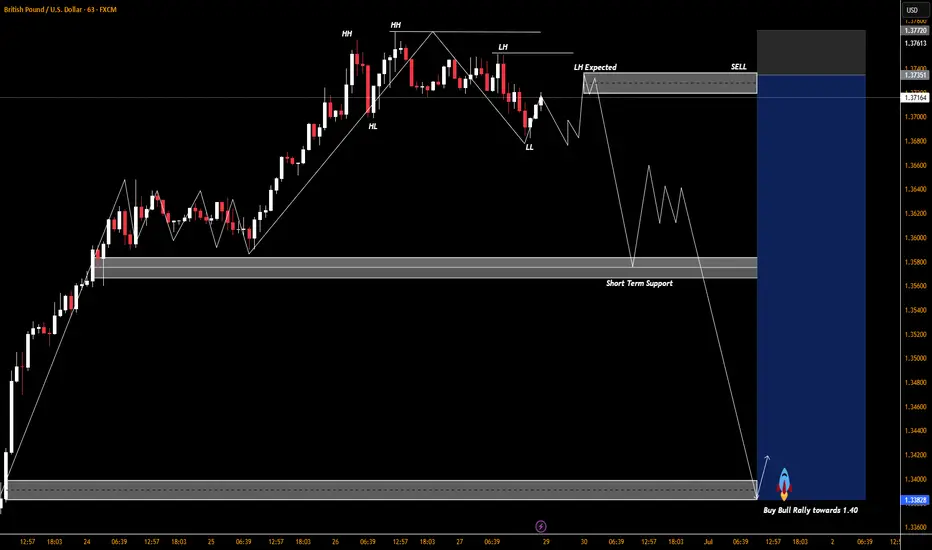
GU Bearish Friday ForecastHi everyone, hope we've all had a good week.
Here is my forecast for GBPUSD for today. After a fairly bullish week, I'm expecting some bearish price action to give us that top wick on the weekly candle close.
I'm looking at 2 price points, a pivot from 1.375 towards key level 1.37.
I'll post an update at the end of the day on how price ended up unfolding.
Regards,
Aman | SMC Wolf FX
1-1 student onboarding is currently open (website in my signature & profile)

GBPUSD Next Week MondayThe GBP/USD pair has recently shown resilience, trading above 1.3700 and near multi-year highs, but technical and fundamental indicators suggest that a bearish tone could emerge early next week, particularly on Monday. While the pair is currently supported by a bullish bias according to some short-term indicators, there are several factors that could shift momentum to the downside.

GBPUSD SCENARIo 26/06/2025English : According to our analysis, we anticipate a bearish scenario.
Morocan Darija : kanchofo d'apres l'analyse dyalna antsanaw hboot
ATENTION : I only share my ideas, not signals

GBPUSD SOLID BEARISH OR CONTINUATION OF UPTREND ? A strong bullish trend, marked by a series of higher highs and higher lows. Price hits resistance around 1.37800 and fails to break higher. After that a range/consolidation forming with small candles between 1.37000 – 1.37800. Sellers start stepping in, and momentum shows weakens of the trend. Neutral to slightly bullish in the very short term due to the latest recovery ,
Resistance: 1.37400 and 1.37800 (need a break above this for bullish continuation).
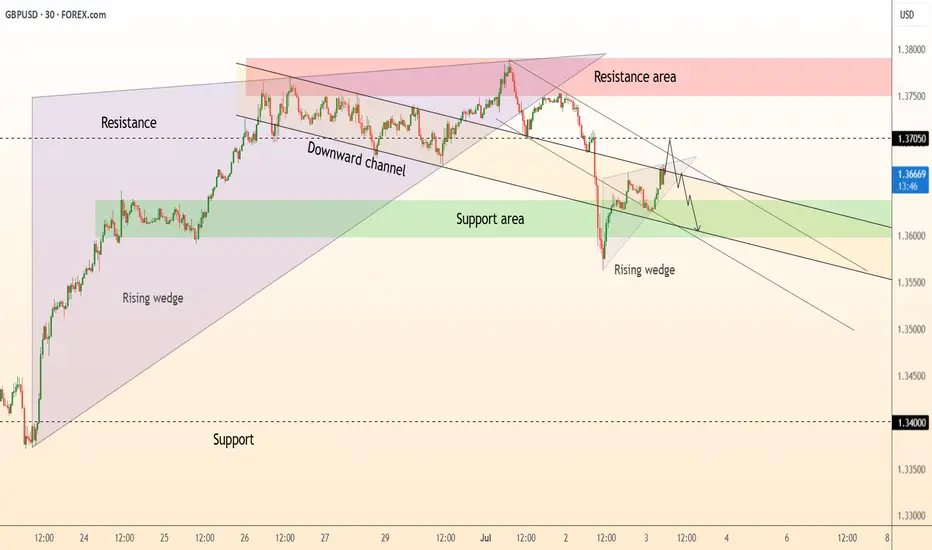
DeGRAM | GBPUSD will continue to correct📊 Technical Analysis
● Price retests the broken wedge-base & channel roof ≈ 1.370 inside a confluence resistance zone (pink). Lower-highs into this cap form a bear flag pointing toward 1.360.
● Intraday rising-wedge has already cracked; projected width and the broader descending channel intersect 1.352-1.355, reinforcing downside targets.
💡 Fundamental Analysis
● Softer UK PMI prices and pre-election caution keep BoE-cut probabilities elevated, while a stronger US JOLTS print plus hawkish FOMC minutes underpin the dollar, favouring renewed GBP/USD pressure.
✨ Summary
Fade rallies 1.368-1.372; slide below 1.360 unlocks 1.355 then 1.343. Bear thesis invalid on a 30 min close above 1.374.
-------------------
Share your opinion in the comments and support the idea with a like. Thanks for your support!
GBPUSDGBPUSD price is near the support zone 1.33917. If the price cannot break through 1.33917, it is expected that the price will have a chance to bounce back. Consider buying in the red zone.
🔥Trading futures, forex, CFDs and stocks carries a risk of loss.
Please consider carefully whether such trading is suitable for you.
>>GooD Luck 😊
❤️ Like and subscribe to never miss a new idea!

GBP/USD HEIST ALERT: Bullish Breakout or Bearish Trap?🌟 Hey! Hola! Ola! Bonjour! Hallo! Marhaba! 🌟
Calling all Market Robbers & Profit Pirates!💸💰
🔥 Thief Trading Intel: Our crew’s latest heist targets GBP/USD "The Cable"—bullish breakout incoming! Long entry only. High-risk Red Zone ahead: overbought, consolidating, and ripe for a reversal. Don’t get caught in the bear trap! 🏴☠️
"Take your loot and run, trader—you’ve earned this steal!" 💪🎯
🚪 ENTRY: The Heist Begins!
📈 "Wait for MA breakout (1.36000) then STRIKE—bullish profits await!"
Option 1: Buy Stop above Pink Resistance (breakout confirmation).
Option 2: Buy Limit at swing low/high (15-30 min TF).
📌 Pro Tip: SET AN ALERT! Don’t miss the breakout.
🛑 STOP LOSS: Escape Route
🔊 "Yo, listen up! 🗣️
Buy Stop orders? NO SL until after breakout! 🚀
Rebels: Place SL wherever—but you’ve been warned! ⚠️🔥
📍 Thief SL (Smart Crew): Recent/swing low (1.35000, 4H TF).
📍 Adjust based on your risk, lot size, and orders.
🎯 TARGET: Loot & Exit!
🎯 1.37500 (or escape early if the market turns!)
⚡ SCALPERS’ QUICK GRAB
👀 Long scalps ONLY!
Big wallets? Raid now.
Small stacks? Join swing traders.
Trailing SL = Your Money Shield! 🛡️💰
📢 WHY THIS HEIST? (GBP/USD Bullish Momentum)
"The Cable" is heating up! Key drivers:
Fundamentals (COT, Macro Data)
Sentiment & Intermarket Trends
Future Targets & Score Outlook
🔗 Full intel? Bio links below! 👉👉
⚠️ TRADING ALERT: News = Danger Zone! 📰🚨
News = Volatility Spikes! Protect your loot:
❌ Avoid new trades during news.
🔒 Trailing SL = Profit Lock.
💖 SUPPORT THE HEIST CREW!
💥 SMASH THAT BOOST BUTTON! 💥
More boosts = easier money grabs!
Stronger crew = bigger heists!
Profit daily with Thief Trading Style! 🏆🚀
Next heist coming soon—stay tuned! 🤑🐱👤🤩

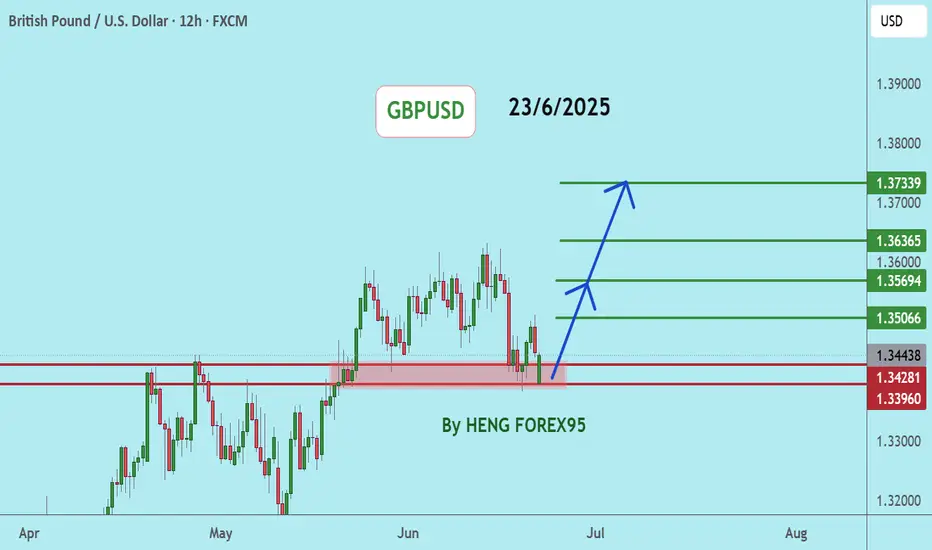
WHY GBPUSD BULLISH ???GBPUSD is unfolding exactly as anticipated, with price now hovering around the 1.3740 region and maintaining strong bullish momentum. Price has successfully bounced from the key support zone near 1.3430, which was previously a major resistance turned into solid demand. This level held firmly during multiple retests, confirming a clean breakout-retest continuation pattern. As long as this structure remains intact, I continue to hold a bullish bias targeting 1.4000 in the coming sessions.
From a fundamental perspective, the British Pound is gaining strength on the back of improved UK economic sentiment. The latest UK inflation data surprised to the upside, pushing annual CPI back above 3%, which reinforces expectations that the Bank of England may need to act sooner rather than later on rate hikes. Markets are now pricing in higher probability of a rate adjustment before the end of Q3 2025. Meanwhile, the US Dollar is under moderate pressure as recent soft labor data and downward revisions in consumer confidence readings have dampened expectations for further tightening from the Fed.
Technically, GBPUSD has cleared major Fibonacci resistance levels and is now forming higher highs and higher lows across the higher timeframes. The current bullish wave is fueled by clean institutional demand and strong price action momentum. If the pair can sustain above 1.3650–1.3680, a swift move toward the psychological 1.4000 handle is highly probable. The 1.4218 Fibonacci extension aligns as a longer-term secondary target for swing traders holding this bullish continuation.
This setup offers a solid blend of macroeconomic backing and technical structure. GBPUSD remains one of the top trending forex pairs right now, favored by strong price action, central bank divergence, and global capital rotation. I'm closely monitoring for intraday pullbacks to add long positions, aiming for extended upside as the market follows through on this bullish breakout continuation.
GBPUSD retracement GBP/USD 4H Short Setup – ICT Concept
Price has created relative equal highs in premium, indicating a potential liquidity pool above. Following that, we’ve seen a bearish Break of Structure (BoS) on the 4H timeframe, confirming a shift in order flow.
Currently, price has returned to the discount zone for sells within the previous range (between 0.5–0.79 retracement), offering a potential entry point for shorts.
The setup aligns with smart money concepts:
Liquidity sweep above equal highs.
SMT divergence with EURUSD
BoS confirming bearish intent.
Price retracing into a premium zone for institutional sell interest.
Targets:
First target near the smaller demand zone ~1.36400.
Final target toward the larger imbalance and demand block near 1.34800.
Bias: Bearish below 1.37300 as long as structure and liquidity context remain intact.
GBP/USD will most likely have sell offs during Asia session allowing London session to manipulate into a daily discount before making legs down in New York session on Monday

DeGRAM | GBPUSD preparing for a correction📊 Technical Analysis
● Cable is pressing the rising-channel ceiling together with the March swing-high supply at 1.378-1.380; successive long-upper-wicks plus fading 4 h RSI signal bull exhaustion at this dual resistance.
● A tiny evening-star has formed inside the pink resistance band and price is slipping back under the broken inner trend-line; first objective is the former breakout shelf / median line near 1.360, with the lower rail and April pivot at 1.343 next in view.
💡 Fundamental Analysis
● UK election blackout, soft retail-sales surprise and firmer month-end USD funding bids narrow the short-rate gap again, sapping fresh sterling demand.
✨ Summary
Short 1.374-1.380; sustain below 1.360 opens 1.343. Bear view void on a 4 h close above 1.380.
-------------------
Share your opinion in the comments and support the idea with a like. Thanks for your support!
GBP/USD Reversal SignalGBP/USD showing clear reversal signs.
Sell now around 1.3750–1.3760
TP1: 1.3625
TP2: 1.3572
SL: 1.3878
Momentum fading — high probability drop incoming.

GBP/USD Made A Double Top Pattern , Short After Breakout ? Here is my opinion on GBP/USD 4H Chart , we have a reversal pattern ( Double Top ) but until now we have not a closure below neckline ,so i`m waiting for 4H Closure below it to confirm the pattern and hen we can sell it , if we have not a closure below then this idea will not be valid .

GBPUSD GBPUSD will either fall or breakout from the supply roof an ascending trendline ...structure never lies only traders lie.
#gbpusd

GU-Fri-27/06/25 TDA-Good resistance area 1.37500, PCE news laterAnalysis done directly on the chart
Follow for more, possible live trades update!
I often share my live trades in Tradingview public chat in London session, stay tuned!
Have priorities in your life.
What are the things that you consider to be top
before anything else?
Do you consider trading as top priority?
When facing doubts and insecurities, if you have
set a list of priorities, you'll likely to be more
oriented and not get lost easily shifting your focus
with your own top priorities.
Active in London session!
Not financial advice, DYOR.
Market Flow Strategy
Mister Y

Updated GBP/USD Trade Idea: New Setup If Price Reaches Key LevelAfter successfully executing the previous trade, I’m now monitoring GBP/USD for a fresh opportunity. If the price reaches this point, it aligns with a high-probability zone where market structure suggests a potential reaction. This area has historically acted as a decision point, and I’ll be watching closely for confirmation before entering the next position.
This updated idea reflects a disciplined, price-action-based approach—focused on timing, structure, and market behavior. Whether you're a day trader or swing trader, this setup offers a clean risk-to-reward profile and fits well within an intraday strategy.
📈 Stay tuned for real-time updates, trade management insights, and detailed breakdowns. 💬 Follow for more GBP/USD strategies and actionable forex content.

GBP/USD : First Long, Then SHORT! (READ THE CAPTION)By analyzing the GBP/USD chart on the 4-hour timeframe, we can see that the price is currently trading around 1.3625. I expect a new Fair Value Gap (FVG), formed by the recent sharp drop, to be filled soon.
The first target for this potential move is 1.3650, with the next bullish zone between 1.3670 and 1.3730.
Supply and demand zones are marked on the chart — keep a close eye on how the price reacts to these key levels!
Please support me with your likes and comments to motivate me to share more analysis with you and share your opinion about the possible trend of this chart with me !
Best Regards , Arman Shaban
