GBPUSD_SPT trade ideas

GBPUSD NEW WEEK OUTLOOK BULLISH TREEND 15/6/2025buy 1.35600 1.35300
tp 1.35800
tp 1.36000
tp 1.36200
sl 1.34800

GBPUSD – 1 Month Analysis (Long-Term Outlook)Strategy Used:
✔ Smart Money Concept (SMC)
✔ Elliott Wave Theory
✔ Wedge Pattern Breakout
---
🔍 Chart Overview:
The pair has completed a classic falling wedge pattern, hinting at a potential long-term bullish reversal.
Wave 5 completion suggests the start of a new cycle or correction (ABC).
Currently in a buyer-dominated zone, with momentum pushing towards the key supply area (seller zone) marked in blue.
A breakout above this zone could indicate continuation toward major highs, while rejection might trigger Wave C or a deeper corrective structure.
---
💡 Key Levels:
Immediate Support Zones:
1.2550 - 1.2700 (Buyer's Checkpoint)
1.2000 - 1.2200 (Deeper Buyer Interest)
Major Resistance / Supply Zone:
1.5500 - 1.6000
---
🧠 SMC Perspective:
Break of Structure (BoS) confirms bullish intent in multiple zones.
Expecting reaction from premium zone – either for continuation or smart money reversal.
---
🌀 Elliott Wave Outlook (Box Inset):
Current wave structure hints at a completed 5-wave impulsive decline.
Now in early stages of ABC correction.
Targeting Wave C to reach the major supply zone in the long-term.
---
📌 Summary:
A macro bullish opportunity is unfolding after years of consolidation and impulse decline. Keep eyes on higher timeframe confirmations and reactions at key zones. This chart aligns well with institutional footprints and macro price action logic.

Two downward-sloping channels (drawn with parallel white lines) Chart Details
Pair: GBP/USD
Timeframe: 1H (1 Hour)
Platform: TradingView
Price at capture: ~1.36020
Indicators: EMA 50 is mentioned, though not visibly prominent.
📉
Technical Analysis
Descending Channels: Two downward-sloping channels (drawn with parallel white lines) show past bearish movements.
Breakout: The price has broken out upwards from the latest descending channel, indicating a bullish impulse.
Supply Zone (Red Box):
Ranges between 1.36104 and 1.36233.
Likely a resistance/sell zone, where price is expected to reverse.
Demand Zone (Green Box):
Starts below the supply zone and represents a potential target zone for shorts.
Trade setup suggests entering a short position after a potential wick or touch into the red zone.
Projected Path (White Line):
Shows an anticipated bearish move after tapping into the red zone.
Suggests a short trade targeting the 1.34322 region (lower green box), potentially a support zone.
✅
Conclusion
The trader is expecting:
A short opportunity after a potential rejection from the 1.3610–1.3623 resistance area.
A move downward toward the 1.3432 level.

Let’s break down what's currently happening in the GBP/USD.GBP/USD Analysis in a Simple and Beginner
Let’s break down what's currently happening in the GBP/USD market, in a way that even someone without any trading experience can grasp easily.
At the moment, the market attempted to break out on the buy (upside), but it faced rejection, meaning it tried to go higher but couldn’t sustain that move and started falling down.
As the price dropped, it reached a point where a bullish engulfing pattern had previously formed this is a special pattern in trading which often signals a potential strong buying opportunity.
Now, here’s the key point:
📍 If the market comes back down to this engulfing buy zone, there's a high probability that it will bounce back up strongly from there think of it like a spring that’s been compressed and is ready to launch upward.
On the other hand:
📍 If the market doesn’t come down and instead continues moving upward, then we already have a bearish engulfing pattern waiting at a higher level. This is a zone where the market could face resistance and fall sharply again.
So what should you do?
✅ Be patient — let the market come to these important engulfing levels.
✅ Don’t rush into trades. Let the price touch these zones and then observe the reaction.
These engulfing zones are like magic they often predict powerful movements. Wait for the price to reach the level, and then watch the magic unfold.
Even if you're new to trading, this kind of analysis helps you understand when and where the market might turn without needing complicated indicators.
DYOR! Not Financial Advice.

GBPUSD| Bullish Structure HoldingGBPUSD continues to map out a bullish structure. While higher timeframe liquidity remains untouched, I’m anticipating a potential continuation on the lower timeframes.
Refined the 30-minute structure and confirmed bullish intent is intact. Now focused on price taking short-term liquidity and mitigating into the marked order block before considering any execution.
The setup is developing — staying patient and letting price come to me.
— Inducement King 👑
Bless Trading!

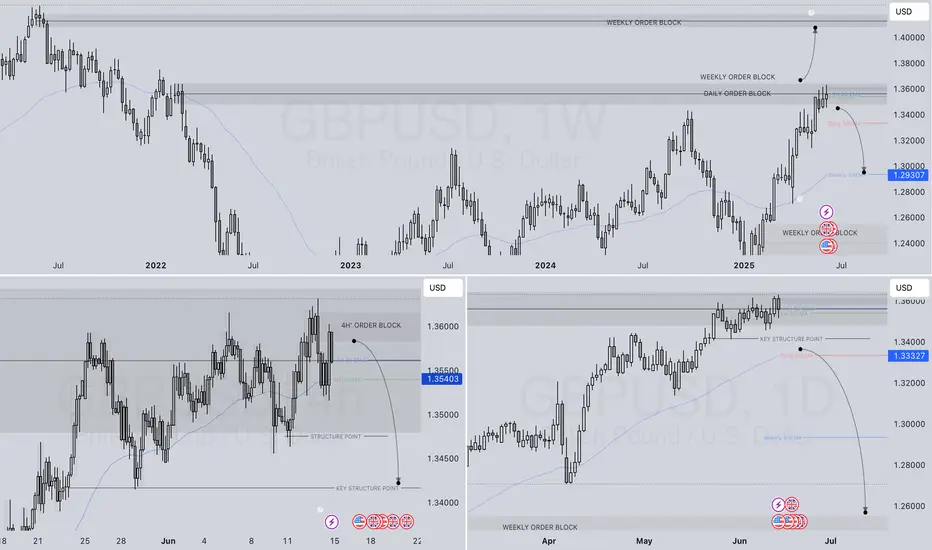
GBPUSD WEEKLY HTF FORECAST Q2 W25 Y25GBPUSD WEEKLY HTF FORECAST Q2 W25 Y25
Professional Risk Managers👋
Welcome back to another FRGNT chart update📈
Diving into some Forex setups using predominantly higher time frame order blocks alongside confirmation breaks of structure.
💭NOTE- If price closes above the key weekly/ daily order block with daily close- re evaluation will be required.
🔑 Remember, to participate in trading comes always with a degree of risk, therefore as professional risk managers it remains vital that we stick to our risk management plan as well as our trading strategies.
📈The rest, we leave to the balance of probabilities.
💡Fail to plan. Plan to fail.
🏆It has always been that simple.
❤️Good luck with your trading journey, I shall see you at the very top.
🎯Trade consistent, FRGNT X
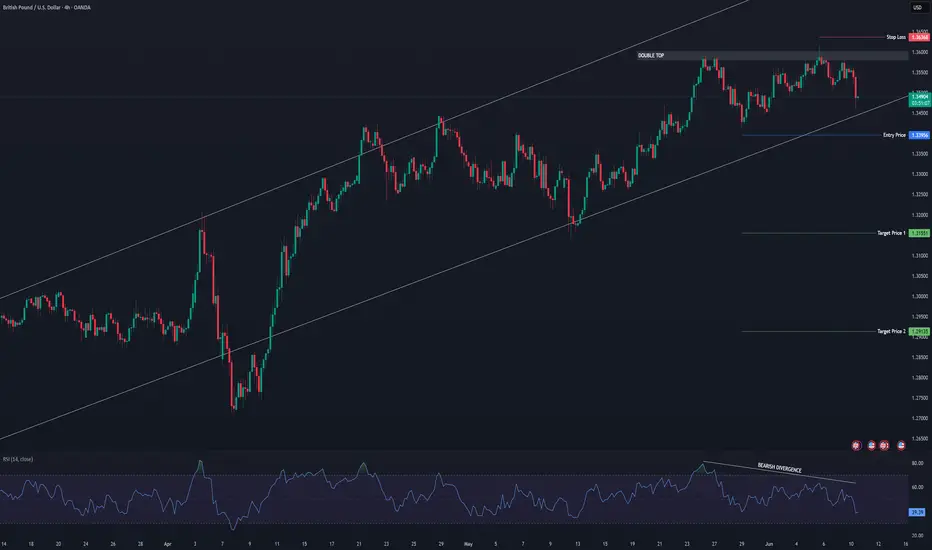
GBP/USD Technical OutlookGBP/USD is exhibiting signs of bearish momentum, with clear bearish divergence observed on the oscillator, signaling potential exhaustion of the recent uptrend. A double top formation is developing near the recent highs, further supporting the bearish bias. Price action is also approaching a key trendline and the lower boundary of an ascending channel. A confirmed break below these technical structures would validate the formation of a new lower high, offering a high-probability short setup.
GBPUSD COT and Liquidity AnalysisHey what up traders welcome to the COT data and Liquidity report. It's always good to go with those who move the market here is what I see in their cards. I share my COT - order flow views every weekend.
🎯 Non Commercials added significant longs and closed shorts at the same time. So for that reason I see the highs as a liquidity for their longs profits taking.
📍Please be aware that institutions report data to the SEC on Tuesdays and data are reported on Fridays - so again we as retail traders have disadvantage, but there is possibility to read between the lines. Remember in the report is what they want you to see, that's why mostly price reverse on Wednesday after the report so their cards are hidden as long as possible. However if the trend is running you can read it and use for your advantage.
💊 Tip
if the level has confluence with the high volume on COT it can be strong support / Resistance.
👍 Hit like if you find this analysis helpful, and don't hesitate to comment with your opinions, charts or any questions.
Analysis done on the Tradenation Charts
Disclosure: I am part of Trade Nation's Influencer program and receive a monthly fee for using their TradingView charts in my analysis.
"Adapt what is useful, reject what is useless, and add what is specifically your own."
— David Perk aka Dave FX Hunter ⚔️

GBPUSD: Your Trading Plan For Next Week 🇬🇧🇺🇸
GBPUSD formed an ascending triangle pattern on a daily time frame.
Your next signal to buy will be a bullish violation of its neckline.
To confirm a breakout, we will need a daily candle close above 1.362.
A bullish continuation will be expected to 1.37 level then.
❤️Please, support my work with like, thank you!❤️
I am part of Trade Nation's Influencer program and receive a monthly fee for using their TradingView charts in my analysis.


Massive GBP/USD Reversal Ahead? Head & Shoulders FormationGBP/USD is at a critical technical juncture following a sharp bullish impulse that pushed the pair above the 1.34 handle, printing a strong weekly bullish engulfing candle and breaking out of a multi-week consolidation zone. This move unfolded in a macro context where the U.S. Dollar Index (DXY) is showing clear signs of weakness, with Non-Commercial net long positions dropping drastically—from around 20,000 to less than 5,000 contracts. This shift points to a fading speculative appetite for the dollar, historically a leading indicator of upcoming corrective phases or broader declines in the DXY.
On the flip side, the Commitments of Traders (COT) report on the British Pound reveals that Non-Commercials (typically hedge funds and asset managers) remain net long on GBP, with a slight increase week-over-week. However, Commercials (generally institutions and hedgers) have aggressively built up a significant net short position—levels that in the past preceded major reversals on the pair. This divergence between speculators and institutional hedgers suggests short-term bullish potential, but with rising risk of exhaustion near current resistance levels.
Adding fuel to this outlook is the retail sentiment: approximately 63% of retail traders are currently short GBP/USD, with an average entry price around 1.3021. This kind of retail crowd positioning, typically inefficient from a historical perspective, adds contrarian support for further upside, as long as price holds above the 1.3340 structure.
From a seasonality perspective, June tends to be a mildly bullish-to-sideways month for GBP/USD, especially when looking at the 10- and 15-year seasonal averages. While the seasonal bias is not particularly strong, there’s also no statistical downward pressure this time of year, leaving room for technically-driven moves influenced by liquidity and sentiment rather than macro patterns alone.
On the technical front, the daily chart shows a steep rally capped by a large green candle on Monday, breaking cleanly through the 1.34 resistance zone. The price is now hovering inside a key supply area between 1.3499 and 1.3550—a historically reactive zone that has triggered major rejections in previous months. How price reacts here will likely shape the next major swing. A confirmed breakout and consolidation above 1.3550 would open the door for an extension toward 1.37–1.3750. Conversely, a sharp rejection followed by a break below 1.3412—and especially under 1.3340—would set the stage for a deeper correction toward 1.3170.
The RSI is currently showing early signs of momentum loss, although no strong bearish divergence has emerged yet. This implies that the pair could still fuel another push higher before running out of steam—possibly forming the right shoulder of a head & shoulders pattern if the rejection scenario plays out.

GBPUSD will continue to rise and break last week's highGBPUSD is correcting lower in the range at the end of the week. This pullback is heading towards the 1.350 support. There will be a bullish reaction at this area. Or if the selling pressure really takes over the market at this support area, then pay attention to the 1.346 bottom for the BUY strategy of this currency pair.
On the other hand, 1.360 will prevent the price increase. It will act as strategic resistance before a new extended breakout to the upside.
The uptrend is more likely to continue than the downtrend, so prioritizing BUY signals will bring better profits to the currency pair.
Support: 1.350, 1.346
Resistance: 1.360, 1.366

GBPUSD My Opinion! SELL!
My dear followers,
I analysed this chart on GBPUSD and concluded the following:
The market is trading on 1.3589 pivot level.
Bias - Bearish
Technical Indicators: Both Super Trend & Pivot HL indicate a highly probable Bearish continuation.
Target - 1.3538
About Used Indicators:
A super-trend indicator is plotted on either above or below the closing price to signal a buy or sell. The indicator changes color, based on whether or not you should be buying. If the super-trend indicator moves below the closing price, the indicator turns green, and it signals an entry point or points to buy.
Disclosure: I am part of Trade Nation's Influencer program and receive a monthly fee for using their TradingView charts in my analysis.
———————————
WISH YOU ALL LUCK


GBPUSD LONGCurrently at a support level, I expect price to rally here to the next resistance level.
Do your analysis as well

GBPUSD ANALYSISOn Gbpusd, we're in on a bullish market. we're looking at for a pullback to fibonacci levels, from anywhere between 71% to 100% for a continuation to the upside

GBPUSD Elliott Wave AnalysisHello friends
We are witnessing the formation of a complete Elliott wave pattern on the GBP USD chart. These waves from 1 to 5 are quite clear (of course, you can count them so that they become an ABC zigzag, isn't it interesting!) and you can even count their subwaves. Now wave 5 is completing and we are witnessing multiple divergences in wave 5. With the breakdown of the trend line drawn below and a pullback to it, we can expect the price to fall to the specified support. The first support is 1.305 and then 1.2800.
Good luck and be profitable.

GBPUSD – Rejection From New Price High Questions UptrendThe escalation in geo-political risks overnight in the Middle East, marked by Israel's attack on Iranian nuclear sites which was followed by Iran's retaliatory drone strikes against Israel, have seen a rush to safe haven assets, which this time included buying dollars (a rarity of late!).
This has seen GBPUSD fall quickly from a fresh 2025 high hit early this morning at 1.3633, back down to lower levels around 1.3540 (at time of writing) and questions whether the highs for GBPUSD may now be in place in the short term, with traders possibly reluctant to add to fresh longs into the weekend, and ahead of next week's Bank of England (BoE) rate meeting on Thursday (June 19th).
Looking forward into the Friday close, traders may now be on headline watch, especially considering Iran's vow to respond to Israel's initial attack with harsh blows against both Israel and the US. Any attack by Iran against US targets, while potentially unlikely, could be viewed as a level up and President Trump has stated that the US are on high alert just in case.
On the data front, the US Preliminary Michigan Consumer Sentiment for June is released at 1500 BST today. This will provide the next update on US consumer inflation expectations as well as sentiment, which although important are possibly unlikely to shift the focus of traders from progress reports regarding geo-political developments in the Middle East.
Technical Update: Rejection From New Price High Questions Uptrend
Of late, it has been a positive phase of sentiment that has been evident for GBPUSD, as a price pattern of higher highs and higher lows has formed, as the chart below shows.
This has resulted in a new recovery price high being posted this morning at 1.3633, which represents the highest trade in GBPUSD since late February 2022. However, so far this new upside extreme in price has held and seen price weakness emerge.
This may now see some traders questioning the ability of GBPUSD to maintain its current upside momentum, even suggest the potential of a more extended phase of weakness.
What support and resistance levels might be worth watching to maybe help determine the next direction of price movement?
Potential Support Levels:
Having held price weakness seen earlier this week, the rising Bollinger mid-average may continue to be a support focus. This currently stands at 1.3504, and closing breaks below this level, if seen, might result in a more extended phase of weakness.
Such downside breaks in price, while not a guarantee of further price declines, could see focus then shift to potential support at 1.3444, which is equal to the 38.2% Fibonacci retracement level, and if this in turn gives way on a closing basis, towards 1.3385, the deeper 50% retracement level.
Potential Resistance Levels:
As the chart below shows, sellers have been found this morning at the 1.3633 level and may be again. This could prove to be the first resistance point to monitor if fresh attempts at price strength are seen over coming sessions.
Successful closing breaks above 1.3633 as a result, could point to an extension of the current uptrend pattern, with the next resistance level then potentially being 1.3749, which is the January 2022 high.
The material provided here has not been prepared
accordance with legal requirements designed to promote the independence of investment research and as such is considered to be a marketing communication. Whilst it is not subject to any prohibition on dealing ahead of the dissemination of investment research, we will not seek to take any advantage before providing it to our clients.
Pepperstone doesn’t represent that the material provided here is accurate, current or complete, and therefore shouldn’t be relied upon as such. The information, whether from a third party or not, isn’t to be considered as a recommendation; or an offer to buy or sell; or the solicitation of an offer to buy or sell any security, financial product or instrument; or to participate in any particular trading strategy. It does not take into account readers’ financial situation or investment objectives. We advise any readers of this content to seek their own advice. Without the approval of Pepperstone, reproduction or redistribution of this information isn’t permitted.

CHECK GBPUSD SIGNAL READ CAPTAINgbpusd sell now ✅
entry point (1.35370) (1.35300)
TAKE PROFIT 1: (1.35050)
TAKE PROFIT 2: (1.34650)
LAST TARGET 1.34350()
STOP LOSS (1.35600)

GBPUSD – Sterling Slips Amid Geopolitical Risk |GBPUSD – Sterling Slips Amid Geopolitical Risk | Will Support Hold for a Bounce?
🌍 Macro & Geopolitical Overview
The British Pound (GBP) is under pressure as risk sentiment deteriorates following a sharp escalation between Israel and Iran.
Israel launched a major military campaign, striking dozens of nuclear and military facilities in northeastern Tehran.
PM Netanyahu announced the start of "Operation Rising Lion", aimed at eliminating the Iranian nuclear threat.
US President Donald Trump voiced support, stating that Iran “must never have a nuclear bomb.”
Investors reacted by fleeing to safe-haven assets, pushing the US Dollar (DXY) from 97.60 to nearly 98.30.
Meanwhile, next week’s Bank of England (BoE) and Federal Reserve meetings are in focus. Both are expected to hold rates steady, but weak UK economic data may pressure the BoE to adopt a more cautious or dovish tone.
📉 Technical Analysis – H1 Chart
🔸 Trend Structure
GBPUSD broke down from its recent high at 1.36288 and is now approaching key support between 1.35350 and 1.34957.
As long as 1.3495 holds, the move appears to be a technical correction, not a reversal.
🔸 Fibonacci & Moving Averages
Current price sits near Fibonacci 0.236 retracement of the recent swing.
Price is trading below the EMA 13 & 34, but EMA 200 near 1.353x still acts as potential support.
🔸 Resistance to Watch
The next upside target sits at 1.3588, followed by the previous high at 1.3628.
🧠 Market Sentiment
Risk aversion is dominating due to geopolitical headlines.
GBP is vulnerable as a risk-sensitive currency.
However, if tensions ease and central bank decisions next week come in line with expectations, GBP could rebound from its currently discounted levels.
🎯 Trade Setup Suggestion
✅ BUY ZONE: 1.35350 – 1.34957
Stop-Loss: 1.3460
Take-Profit Targets: 1.3588 → 1.3628
Enter only on bullish price action confirmation around the support zone.
✅ Conclusion
GBPUSD is trading under geopolitical stress, but the technical setup around 1.3495 – 1.3535 offers a potential bounce zone. A short-term recovery could unfold if sentiment stabilizes and central banks maintain the expected policy stance.

GBPUSD Key Levels Structure Outlook & Price ZonesSharing a personal breakdown of the levels I’m watching on GBPUSD based on structure and price behavior.
This is not financial advice just how I approach the chart and prepare for possible scenarios.
Focusing on key zones, market structure shifts, and reaction areas.
Let the market confirm. I stay reactive, not predictive.

