GBPUSD BUY OPPORTUNITY An seeing a buy trade on GBPUSD now.
A continuous buy now
Entry: 1.36000
Stop loss: 1.35700
Take profit 📈: 1.37800
Comment your opinion pls
FOR FUND MANAGEMENT. CONTACT ME ON X @shajudeakinoba1
GBPUSD_SPT trade ideas

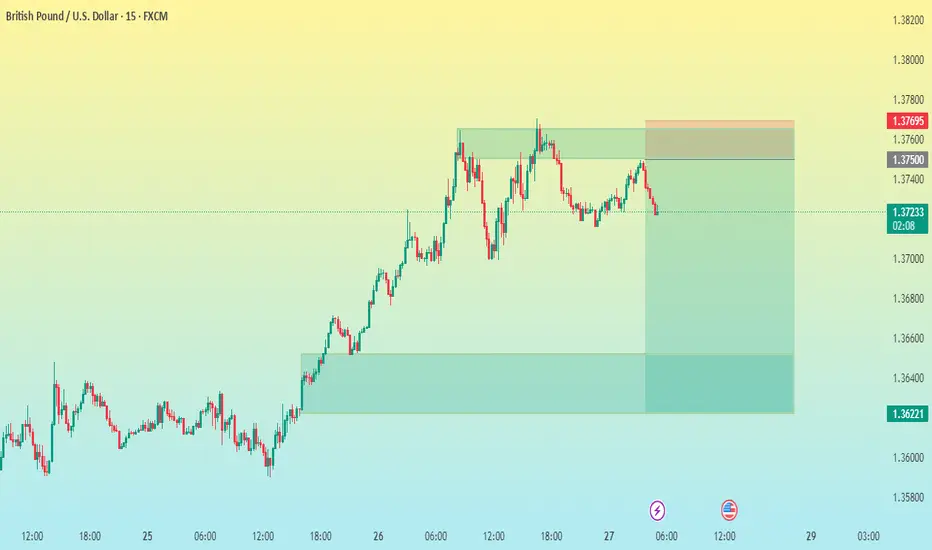
GBP/USD 15M CHART PATTERNHere's a structured breakdown of your GBP/USD sell trade setup:
---
🧾 Trade Type:
Sell (Short)
📍 Entry Point:
1.37260
🎯 Take Profit Targets:
TP1: 1.37000
TP2: 1.36600
TP3: 1.36221
🛑 Stop Loss:
1.37695
---
📊 Risk-to-Reward Ratio (approximate):
Target Reward (pips) Risk (pips) RR Ratio
TP1 26 43.5 ~0.60
TP2 66 43.5 ~1.52
TP3 103.9 43.5 ~2.39
> Note: The RR becomes more favorable at deeper targets.
---
⚠ Things to Consider:
SL is relatively wide, so size your position accordingly based on your risk percentage (e.g., 1-2% of account).
Watch major economic events (e.g., BOE or Fed speeches, CPI, NFP) that could spike volatility.
Use a trailing stop after TP1 if you want to secure profits and ride lower.
GBPUSD → Pre-breakout consolidation. One step away from a rallyFX:GBPUSD is trading in consolidation. Against the backdrop of the falling dollar index, the currency pair is testing resistance at 1.3632 but is not yet ready to bounce down.
Against the backdrop of the dollar's decline due to fundamental reasons, the GBPUSD currency pair is strengthening. Technically, this could lead to the price breaking out of consolidation upwards. A pre-breakout base is forming relative to the upper boundary of consolidation. The price is compressing towards the level, volatility is decreasing, which in general could lead to a breakout of resistance - trigger 1.3632. The exit from consolidation may be accompanied by distribution. The liquidity zone with W1 can be considered as a target.
Resistance levels: 1.3632, 1.3743
Support levels: 1.3593, 1.3508
The global and local trends are bullish. After growth, consolidation is forming. Against the backdrop of the falling dollar, GBPUSD is testing resistance. The reaction to the false breakout of resistance is weak. The chances of a breakout are quite high.
Best regards, R. Linda!

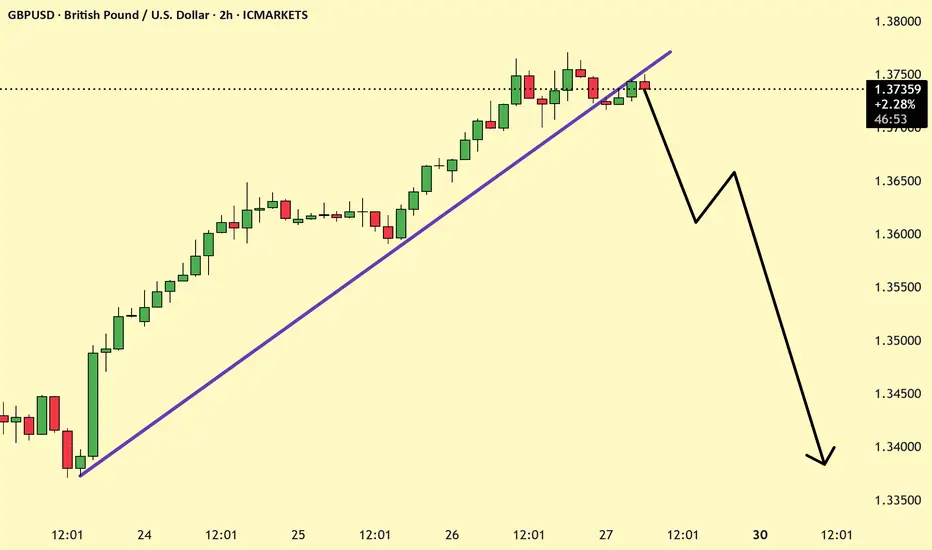
GBPUSD Boke trend line and retesting Recently GBPUSD is Trending upwards and now booke the trendline and is likely to go down now.
GBP/USD💰Symbol: { GBP/USD }
🟩Price: { 1.37252 & 1.37500 }
🟥Stop: { 1.37731 }
1️⃣profit: { 1.36844 }
2️⃣profit: { 1.36397 }
3️⃣profit: { 1.36072 }
📊Check your chart before entering.
🚨Check before use to make sure there is no important news.🚨

GBPUSD Analysis Today: Technical and Order Flow !In this video I will be sharing my GBPUSD analysis today, by providing my complete technical and order flow analysis, so you can watch it to possibly improve your forex trading skillset. The video is structured in 3 parts, first I will be performing my complete technical analysis, then I will be moving to the COT data analysis, so how the big payers in market are moving their orders, and to do this I will be using my customized proprietary software and then I will be putting together these two different types of analysis.


GBPUSD Potential DownsidesHey Traders, in the coming week we are monitoring GBPUSD for a selling opportunity around 1.37400 zone, GBPUSD is trading in a downtrend and currently is in a correction phase in which it is approaching the trend at 1.37400 support and resistance area.
Trade safe, Joe.

GBPUSD Selling from resistance at 1.37600📈 GBPUSD – Technical Analysis (4H Timeframe)
The pair is currently respecting an ascending channel, but price is reacting to a key resistance at 1.37600, indicating a potential short opportunity.
🔻 Sell Scenario:
If rejection holds, we could see a move toward the following technical targets:
📍 1st Target – 1.36000 (Demand Zone)
📍 2nd Target – 1.34000 (Demand Zone)
📍 3rd Target – 1.32500 (Bullish Order Block)
Stay sharp — structure remains bullish overall, but short-term corrections are in play!
---
📲 Like, Follow & Comment
💬 Drop your thoughts below & join us for more real-time trade setups and market insights!
#Forex #GBPUSD #PriceAction #TechnicalAnalysis #ForexSignals #LiviaTrades 😜

Political Uncertainty, Dollar Weakness & A Projected CorrectionDespite being a technical trader, there are some fundamental factors floating in the background of today's trading idea.
1) We saw weakness on the GBP today due to some political uncertainty & investors having concerns over the stability of the UK's leadership and economic direction.
2) We saw a drop in the ADP Non-Farm Employment Change for the US Dollar today which is starting to look like a trend rather than a one-off.
Why this is important is because, despite the very bearish day that the FX:GBPUSD had today, I don't think the GBP reaction is as relevant as it's shown and I do think the USD is weaker than it's shown on this particular chart, due to the reactions that we've seen on other crosses.
All in all, that this means is that I wouldn't be shocked to see today's move corrected and price is at the perfect technical level to do just that.
If you have any questions, comments or opinions, please don't hesitate to leave them below.
Akil

GBPUSD-SELL strategy 6 hourly chart Reg.ChannelThe pair is overbought considering the longer time frames. we are still positive on indicators short-term, so we seek a SELL level rather than rushing in.
Strategy SELL @ 1.3760-1.3790 and take profit near 1.3617.

What Is a Change of Character (CHoCH) and How Can You Trade It?What Is a Change of Character (CHoCH) and How Can You Trade It?
Navigating the nuances of Smart Money Concept (SMC) trading requires a keen understanding of market signals like the Change of Character (CHoCH). This concept can help traders detect and react to potential trend reversals. Today, we’ll delve into the mechanics of CHoCHs, explaining how they manifest in different market conditions and how they can be strategically leveraged for trading decisions.
Understanding Breaks of Structure
Understanding Breaks of Structure (BOS) is essential for traders before delving into concepts like Change of Character (CHoCH). A BOS in trading signifies a continuation within the current trend and is marked by a clear deviation from established swing points that indicate previous highs and lows.
In the context of an uptrend, a BOS is identified when the price exceeds a previous high without moving below the most recent higher low. This action confirms that the upward momentum is still strong and likely to continue as buyers push the market to new heights.
Similarly, in a downtrend, a BOS occurs when prices drop below a previous low without breaking the prior lower high, suggesting that sellers remain in control and the downward trend is set to persist.
By recognising these points where the market extends beyond its former bounds, traders can confirm that the current trend is robust and act accordingly. This foundational concept of BOS not only helps in assessing trend strength but also sets the stage for understanding more complex patterns like CHoCH, where the focus shifts from trend continuation to potential trend reversals.
CHoCH Trading Meaning
In trading, a Change of Character (CHoCH) signals a potential shift in market dynamics, often indicating a reversal from the prevailing trend. This concept is particularly valuable as it helps traders discern when the momentum is shifting, offering a strategic point to consider adjusting their positions.
A CHoCH occurs when there's a noticeable deviation in the market's price trend. For example, in a bullish trend characterised by a series of higher highs and higher lows, a CHoCH is indicated by the price failing to set a new high and subsequently falling below a recent higher low. This suggests that buyers are losing control, and a bearish trend could be emerging.
Similarly, during a bearish trend marked by lower highs and lower lows, a bullish CHoCH would occur if the price unexpectedly breaks above a recent lower high. This break indicates that sellers are losing their grip, and a bullish trend may be starting.
The Significance of CHoCHs Across Timeframes
The fractal nature of financial markets means that patterns and behaviours recur across various timeframes, each providing unique insights and implications for trading. Understanding CHoCHs in different timeframes is crucial for traders to effectively align their strategies with both short-term opportunities and long-term trend shifts.
In intraday trading, where decisions are made on lower timeframes (like minutes or hours), a CHoCH can signal a possible short-term trend reversal. For example, if a currency pair in a downtrend on a 15-minute chart suddenly posts a higher high, this could indicate a weakening of the bearish momentum, suggesting a potential bullish reversal.
Traders might use this information to close short positions or to consider a long position, capitalising on the emerging upward trend. These short-term CHoCHs allow traders to respond quickly to market changes, potentially securing returns before larger market shifts occur.
Conversely, CHoCHs observed on higher timeframes, such as daily or weekly charts, are particularly significant because they can indicate a shift in the broader market trend that might last days, weeks, or even months. Such changes can then be used by both long and short-term traders to adjust their positioning and directional bias.
How to Identify a CHoCH
The initial step to identify a CHoCH in trading involves clearly defining the existing trend on a specific timeframe. This is done by marking the significant swing highs and lows that delineate the trend's progress. These points should represent somewhat meaningful retracements in the price, providing clear markers of trend continuity or potential reversal points.
According to the Smart Money Concept (SMC) theory, the integrity of an uptrend is maintained as long as the price does not trade through the most recent significant higher low. Conversely, a downtrend is considered intact if the price does not surpass the most recent significant lower high. Therefore, traders focus their attention on these critical points.
To identify a CHoCH, traders watch for a break in these crucial high or low points. For instance, in an uptrend, a bearish CHoCH is indicated when the price achieves a higher high but then reverses to descend below the previous significant higher low.
Similarly, in a downtrend, a bullish CHoCH occurs when the price drops to a lower low before reversing to break above the previous significant lower high, setting a new high. Both types of breaks signal a potential reversal in the trend direction.
How to Trade a CHoCH
When trading a CHoCH, it’s essential to recognise that it should be integrated with other aspects of the SMC framework to get the best results. This includes the use of order blocks and imbalances, which are key components in identifying potential reversals.
Order Blocks and Imbalances
An order block is essentially a substantial consolidation area where significant buying or selling has occurred, and prices often revisit these zones before reversing. These blocks can be seen as levels where institutional orders were previously concentrated.
An imbalance, also known as a fair value gap, occurs when the price moves sharply up or down, leaving a zone that has not been traded extensively. Price often returns to these gaps to 'fill' them, establishing equilibrium before a potential reversal happens.
In practice, traders can look for a sequence where the price first approaches an order block and begins to fill any existing imbalances. This setup increases confidence in a potential reversal. As the price meets these criteria and a CHoCH occurs, this indicates that the influence of the order block is likely to initiate a price reversal.
Practical Example on GBP/USD
Consider the 4-hour chart of the GBP/USD pair above. We see the pair encounter an order block on the left, one that’s visible on the daily chart. As the price interacts with this block, it begins to retrace, attempting to fill the imbalance but moves away. Eventually, the price completes the fill of the imbalance and meets the previously established order block.
Switching to a 1-hour timeframe, this scenario unfolds similarly. After reaching the order block on the 4-hour chart, another CHoCH occurs, signalling the start of a new uptrend. This lower timeframe CHoCH, following the meeting of the order block, corroborates the potential for a reversal initiated by the higher timeframe dynamics.
This example illustrates how CHoCHs can be effectively utilised across different timeframes, tying back to the fractal nature of markets discussed earlier. By recognising these patterns and understanding their interaction with order blocks and imbalances, traders can strategically position themselves to capitalise on potential market reversals, aligning their trades with deeper market forces at play.
CHoCH vs Market Structure Shift
A Market Structure Shift (MSS) is a specific type of Change of Character that includes additional signals suggesting a potential trend reversal. Unlike a straightforward CHoCH that typically indicates a trend is shifting but may also be a false break, an MSS can be seen as a higher confluence CHoCH. An MSS occurs after the market first makes a key movement contrary to the established trend—forming a lower high in an uptrend or a higher low in a downtrend—without plotting a higher high or lower low.
Following these preliminary signals, an MSS is confirmed when there is a decisive break through a significant swing point accompanied by a strong displacement (i.e. impulse) move, creating a CHoCH in the process. This sequence not only reflects that the prevailing trend has paused but also that a new trend in the opposite direction is establishing itself.
Due to these additional confirmations, an MSS can offer added confirmation for traders, indicating a stronger likelihood that a new, sustainable trend has begun. This makes the MSS particularly valuable for traders looking for more substantiated signals in their trading strategy.
The Bottom Line
The concept of a CHoCH is instrumental in navigating the complexities of SMC trading. By identifying these crucial market signals, traders may align their strategies to capitalise on market movements efficiently.
FAQs
What Is CHoCH in Trading?
In trading, CHoCH is a technical observation that signifies a change in the trend's character, where the price movement breaks from its established pattern of highs and lows, suggesting a potential reversal or substantial shift in the market's direction.
What Is CHoCH in SMC Trading?
In Smart Money Concept (SMC) trading, a Change of Character (CHoCH) refers to a clear shift in market behaviour that indicates a potential reversal of the prevailing trend. This concept is used by traders to detect early signs of a momentum shift that might lead to significant changes in price direction, enabling strategic adjustments to their trading positions.
What Is a CHoCH in the Market Structure?
A CHoCH in market structure is identified when there is an observable deviation from established price patterns — specifically when new highs or lows contradict the current trend. It signifies that the previous market sentiment is weakening, and a new opposite trend may be starting, prompting traders to reassess their strategies.
How Do You Identify a CHoCH?
Identifying a CHoCH involves monitoring significant swing highs and lows for breaks that are contrary to the existing trend. For instance, in an uptrend, a CHoCH would be indicated by a failure to reach a new high followed by a drop below the recent higher low, suggesting a shift to a bearish outlook.
What Is ChoCH vs BOS in Trading?
While both CHoCH and Break of Structure (BOS) are critical in assessing market dynamics, they serve different purposes. CHoCH indicates a potential trend reversal by highlighting a significant change in the price pattern. In contrast, a BOS indicates a continuation of the current trend by showing the price surpassing previous significant highs or lows, reinforcing the ongoing direction.
This article represents the opinion of the Companies operating under the FXOpen brand only. It is not to be construed as an offer, solicitation, or recommendation with respect to products and services provided by the Companies operating under the FXOpen brand, nor is it to be considered financial advice.


Bearish reversal off 50% Fibonacci resistance?The Cable (GBP/USD) is rising towards the pivot and could drop to the 1st support.
Pivot: 1.3681
1st Support: 1.3595
1st Resistance: 1.3746
Risk Warning:
Trading Forex and CFDs carries a high level of risk to your capital and you should only trade with money you can afford to lose. Trading Forex and CFDs may not be suitable for all investors, so please ensure that you fully understand the risks involved and seek independent advice if necessary.
Disclaimer:
The above opinions given constitute general market commentary, and do not constitute the opinion or advice of IC Markets or any form of personal or investment advice.
Any opinions, news, research, analyses, prices, other information, or links to third-party sites contained on this website are provided on an "as-is" basis, are intended only to be informative, is not an advice nor a recommendation, nor research, or a record of our trading prices, or an offer of, or solicitation for a transaction in any financial instrument and thus should not be treated as such. The information provided does not involve any specific investment objectives, financial situation and needs of any specific person who may receive it. Please be aware, that past performance is not a reliable indicator of future performance and/or results. Past Performance or Forward-looking scenarios based upon the reasonable beliefs of the third-party provider are not a guarantee of future performance. Actual results may differ materially from those anticipated in forward-looking or past performance statements. IC Markets makes no representation or warranty and assumes no liability as to the accuracy or completeness of the information provided, nor any loss arising from any investment based on a recommendation, forecast or any information supplied by any third-party.

GBPUSD sideways consolidation support at 1.3550The GBPUSD currency pair continues to exhibit a bullish price action bias, supported by a sustained rising trend. Recent intraday movement reflects a sideways consolidation breakout, suggesting potential continuation of the broader uptrend.
Key Technical Level: 1.3600
This level marks the prior consolidation range and now acts as pivotal support. A corrective pullback toward 1.3600 followed by a bullish rejection would reinforce the bullish trend, targeting the next resistance levels at:
1.3825 – Near-term resistance
1.3865 – Minor swing high
1.3900 – Longer-term bullish objective
On the other hand, a decisive daily close below 1.3600 would invalidate the bullish setup, shifting the outlook to bearish in the short term. This could trigger a deeper retracement toward:
1.3550 – Initial support
1.3500 – Key downside target
Conclusion:
As long as 1.3600 holds as support, the technical outlook remains bullish, favoring long positions on dips. A confirmed break below this level would signal a shift in sentiment and open the door to a corrective pullback phase.
This communication is for informational purposes only and should not be viewed as any form of recommendation as to a particular course of action or as investment advice. It is not intended as an offer or solicitation for the purchase or sale of any financial instrument or as an official confirmation of any transaction. Opinions, estimates and assumptions expressed herein are made as of the date of this communication and are subject to change without notice. This communication has been prepared based upon information, including market prices, data and other information, believed to be reliable; however, Trade Nation does not warrant its completeness or accuracy. All market prices and market data contained in or attached to this communication are indicative and subject to change without notice.

Super Sell!Hello all. as you see market reaches to an LOZ and it needs a historical low. As DXY will increasing, it it will falling. Effect of tariff started. be happy and have a super great week(wink)

Could the price reverse from here?The Cable (GBP?USD) is reacting off the pivot and could reverse to the 1st support which acts as a pullback support.
Pivot: 1.3710
1st Support: 1.3620
1st Resistance: 1.3799
Risk Warning:
Trading Forex and CFDs carries a high level of risk to your capital and you should only trade with money you can afford to lose. Trading Forex and CFDs may not be suitable for all investors, so please ensure that you fully understand the risks involved and seek independent advice if necessary.
Disclaimer:
The above opinions given constitute general market commentary, and do not constitute the opinion or advice of IC Markets or any form of personal or investment advice.
Any opinions, news, research, analyses, prices, other information, or links to third-party sites contained on this website are provided on an "as-is" basis, are intended only to be informative, is not an advice nor a recommendation, nor research, or a record of our trading prices, or an offer of, or solicitation for a transaction in any financial instrument and thus should not be treated as such. The information provided does not involve any specific investment objectives, financial situation and needs of any specific person who may receive it. Please be aware, that past performance is not a reliable indicator of future performance and/or results. Past Performance or Forward-looking scenarios based upon the reasonable beliefs of the third-party provider are not a guarantee of future performance. Actual results may differ materially from those anticipated in forward-looking or past performance statements. IC Markets makes no representation or warranty and assumes no liability as to the accuracy or completeness of the information provided, nor any loss arising from any investment based on a recommendation, forecast or any information supplied by any third-party.

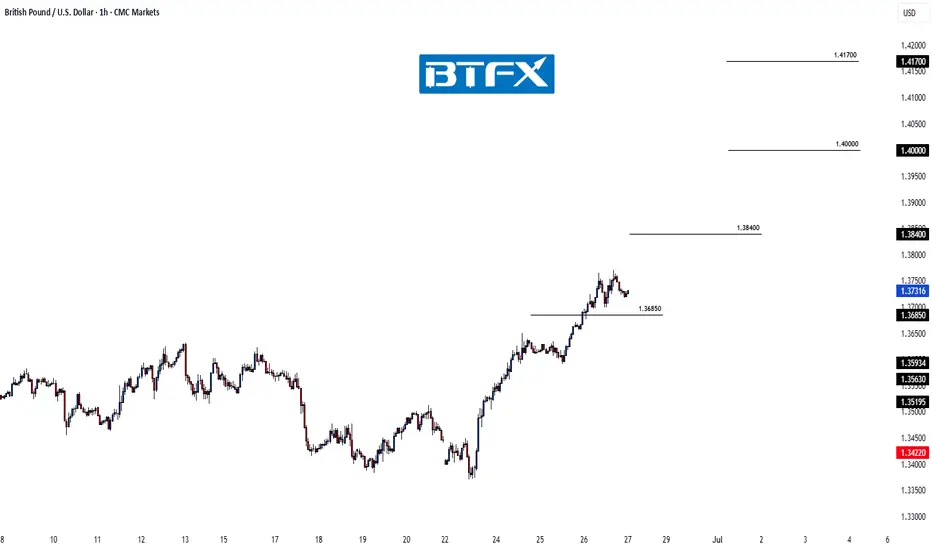
GBP/USD Rally in Full Swing – Bullish Targets AheadHi everyone,
Price achieved the 1.36850 having found support near the 1.33800 level.
As previously noted, the clearance of these levels strengthens our expectation for further upside, with the next key level of interest around 1.38400. We'll be watching to see how price action develops from here.
We’ll continue to provide updates on the projected path for GBP/USD as price approaches this target.
The longer-term outlook remains bullish, and we expect the rally to continue extending further from the 1.20991 January low towards 1.40000 and 1.417000.
We’ll be keeping you updated throughout the week with how we’re managing our active ideas. Thanks again for all the likes/boosts, comments and follows — we appreciate the support!
All the best for the week ahead. Trade safe.
BluetonaFX
GBPUSD - trade - Market Structure GBPUSD - trade - Market Structure , this is a short trade, very clean setup, use risk and trade managment for best result
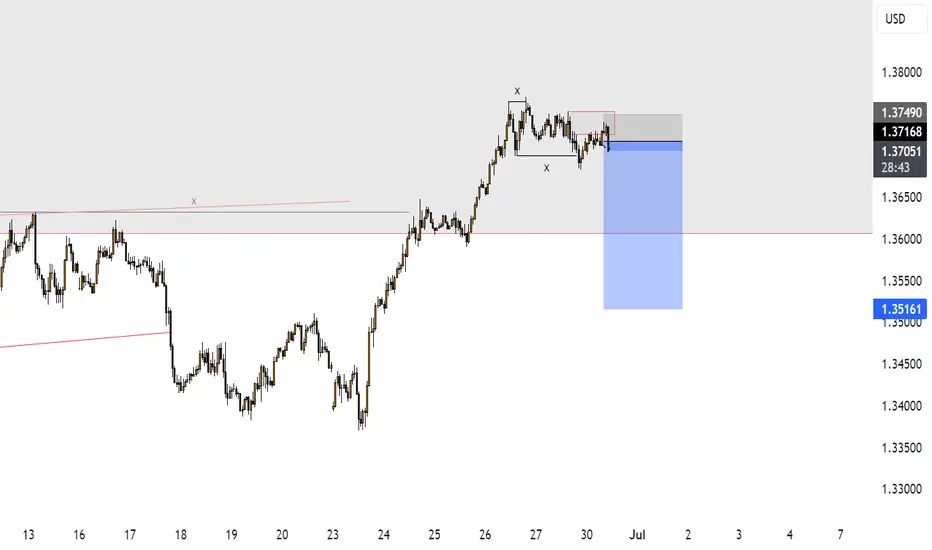
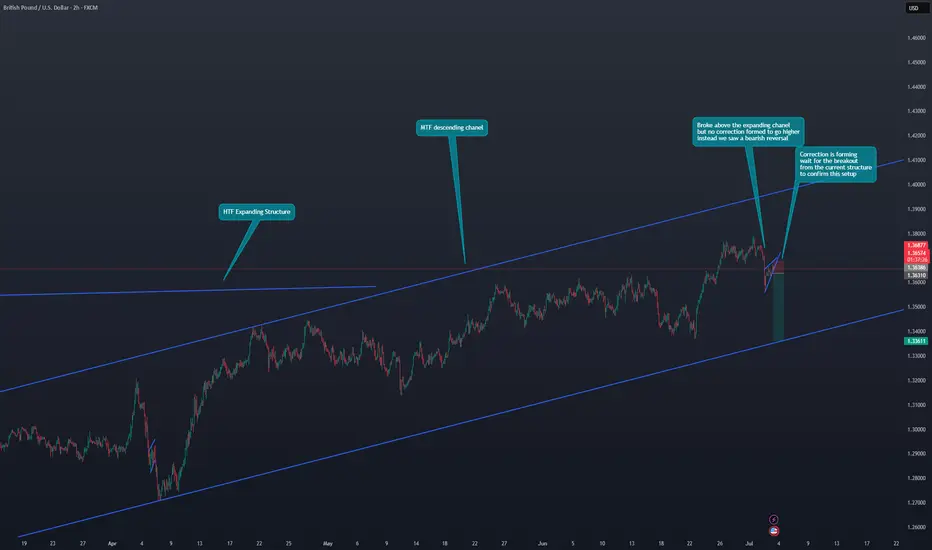
GBP/USD Sells incomingHi Traders!
1.HTF Expanding structure
2.MTF Asceding Chanel
3.False Breakout and LTF Reversal
4.LTF Continuation correction is forming
5.Wait for the breakout from the current structure to confirm this setup
skraaaaaa!!!check my previous post and you will see the before of this trade and a comprehensive explanation of my bias and analysis knowledge truly is power want learn SMC concept reach out to me and get a comprehensive understanding today
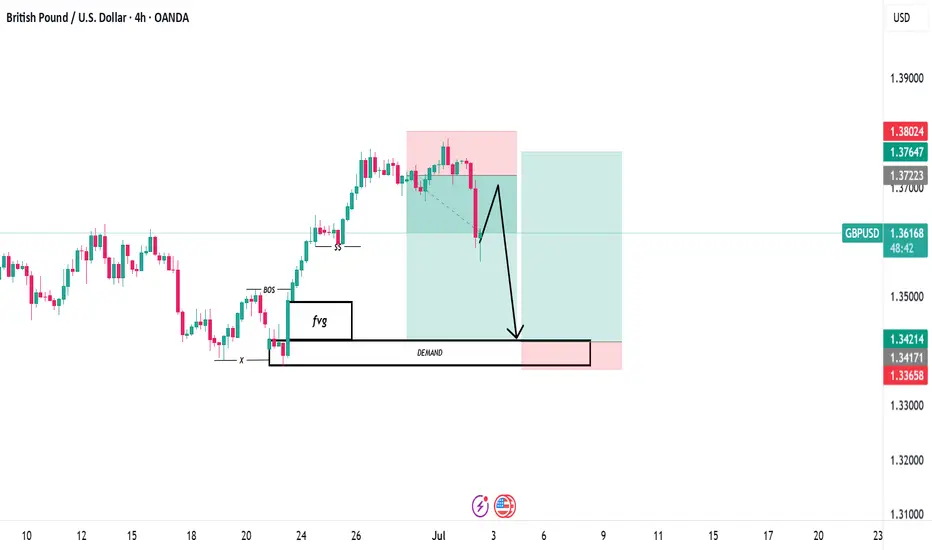
Bearish Reversal at Supply – GBP/USD🧠 Trade Breakdown:
Price broke structure cleanly to the downside, leaving behind a clear supply zone on the higher timeframes. Now we’re seeing a textbook pullback into that zone — slow, weak volume — signaling distribution before the next potential move down.
📍 Key Confluences:
• Higher timeframe supply zone respected
• Break of structure followed by clean pullback
• Consolidation + order buildup into the zone
• High reward-to-risk (estimated 7:1)
• Supply zone: 1.3718 – 1.3735
• Entry: 1.37206
• SL: Above 1.3735
• TP: 1.36275
📸 Trade Setup:
Waiting for a bearish reaction or engulfing confirmation from inside the purple supply zone. If rejection holds, I’m targeting the green demand zone below.
🧠 Mindset:
No chasing. No forcing. This is a sniper setup only. Full trust in my zone and risk management.
Trade Simple. Live Lavish.
— Quil Lavish

Four Ways to Improve Focus When Trading“Execution is everything.” It’s a phrase you’ll hear time and again in trading circles, and for good reason. Having a solid strategy is important, but it means very little if you can’t stay focused enough to follow through. One moment of hesitation, one distracted click, and the edge you worked so hard to find can vanish in an instant.
Focus is the gateway to execution. Without it, even the best setups fall apart. Yet in a world of constant noise with live charts, endless alerts, social media and background distractions it’s never been harder to stay present and in control. Here are four ways to improve your focus while trading. Two are grounded and practical. Two are a bit more unconventional. All of them can help you sharpen your focus where it really counts in the moment of decision.
1. Start with a Written Game Plan
This is the foundation. Before you even open your trading platform, write down your trade ideas, key levels, and any news or events that could impact your market. It doesn’t have to be elaborate. A simple list of “if this, then that” scenarios is enough.
By putting your plan on paper, you free up mental space and reduce emotional interference. You’re no longer reacting to every tick or candle. You’re tracking a few clear ideas and waiting for price to confirm your bias. That alone can dramatically improve focus. When your brain knows the plan, it doesn’t need to make it up on the fly.
More importantly, a written plan acts as an anchor when the session heats up. If you get shaken by a false breakout or tempted by something that wasn’t in your prep, it’s easy to refer back and reset. The best traders are those who execute simple ideas with discipline, not those who chase every signal that flashes across the screen.
2. Silence the Noise Around You
Multitasking is the enemy of trading. One browser tab for news, another for Twitter, five charts open, notifications popping up on your phone it all adds up to mental chaos.
Clean up your digital workspace before you start trading. Close all tabs that aren’t directly relevant to your session. Mute group chats. Set your phone to silent and put it face down, or better yet, in a drawer. Keep your trading screen as clean as possible. Use one or two key charts. Turn off indicators you don’t need.
If you trade in a noisy household or shared office space, noise-cancelling headphones can be a game changer. Some traders even use ambient sound apps like brain.fm or simple white noise to drown out distractions and stay locked in. A quiet mind is a focused mind.
3. Stand Up Before You Enter a Trade
Here’s something a little unorthodox, but surprisingly effective. Before you click the buy or sell button, physically stand up.
This small physical action creates a moment of separation between your thinking and your doing. It forces you to pause, breathe, and check in with yourself. Am I acting on plan or emotion? Is this trade aligned with my prep, or am I forcing it out of boredom?
We’ve all taken impulsive trades, only to regret them seconds later. Standing up adds a layer of intentionality. It breaks the rhythm of screen-staring and puts your brain back in the driver’s seat.
Think of it as your personal circuit breaker. It gives you a chance to double-check your logic and stops you from slipping into autopilot mode. Some traders even take it a step further and stretch or roll their shoulders before re-engaging with the screen. It might sound silly, but the effect on your mindset is real.
4. Use a ‘Focus Trigger’ to Prime Your Brain
Our brains love routines. You can use that to your advantage by building a simple ritual that tells your mind, “It’s time to trade.”
This doesn’t have to be anything elaborate. It might be playing a song you only use when trading or doing a brief breathing exercise. Some traders even use the act of cleaning their desk or making a fresh cup of coffee as a cue to shift into a focused state.
Over time, these small rituals become associated with mental readiness. They condition your brain to transition from passive scrolling or chatting into active concentration. That’s powerful, especially on days when you’re feeling a bit foggy or distracted.
The goal isn’t to create a superstition. It’s to build a reliable on-ramp into a focused headspace something that centres you and sets the tone for your session.
Disclaimer: This is for information and learning purposes only. The information provided does not constitute investment advice nor take into account the individual financial circumstances or objectives of any investor. Any information that may be provided relating to past performance is not a reliable indicator of future results or performance. Social media channels are not relevant for UK residents.
Spread bets and CFDs are complex instruments and come with a high risk of losing money rapidly due to leverage. 85.24% of retail investor accounts lose money when trading spread bets and CFDs with this provider. You should consider whether you understand how spread bets and CFDs work and whether you can afford to take the high risk of losing your money.
