GBPUSD_SPT trade ideas

GBP/USDPrice action trading is a methodology in financial markets where traders make decisions based on the actual price movements of an asset over time, rather than relying heavily on technical indicators or fundamental analysis. It involves observing and interpreting patterns and trends in price charts to predict future price movements.

GBPUSDHello Traders! 👋
What are your thoughts on GBPUSD?
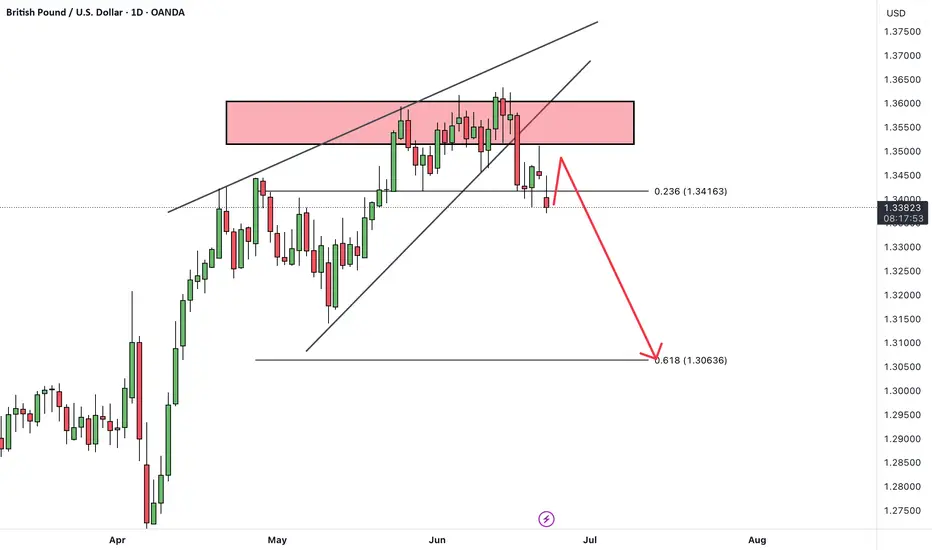
On the GBPUSD chart, we can see that the price has repeatedly tested a key resistance zone but failed to break above it, resulting in multiple rejections.
After forming a rising wedge pattern, the pair has broken down below the wedge, and is now completing a pullback toward the broken trendline.
We expect that after some consolidation in this area and completion of the pullback, the price will likely resume its decline toward lower targets.
As long as price remains below the resistance zone and broken trendline, the bearish scenario remains valid.
Is the pullback complete and ready for the next leg down? Share your view below! 🤔👇
Don’t forget to like and share your thoughts in the comments! ❤️
GBP/USD KILLEDGBP/USD milked using smart money concepts. us as displined traders we are patient we follow the rules of our trade setups harlemz fx

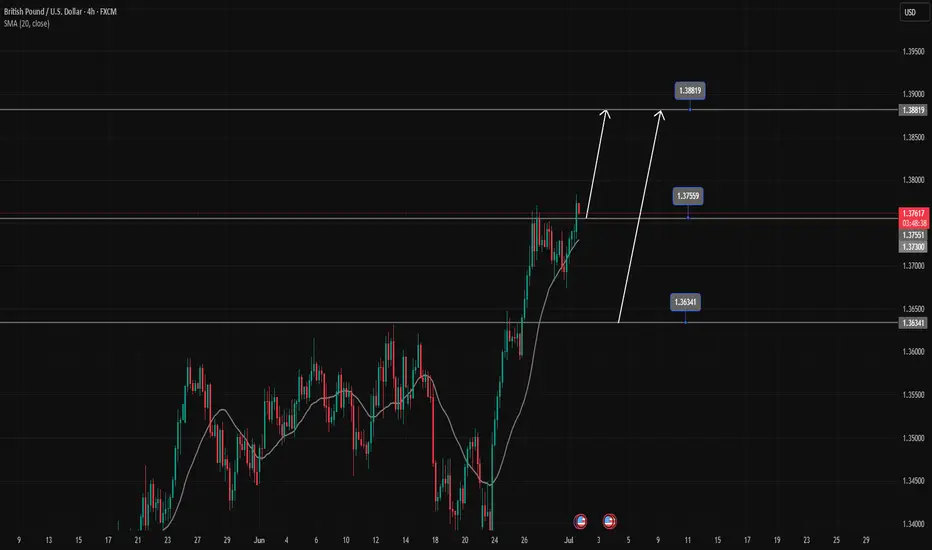
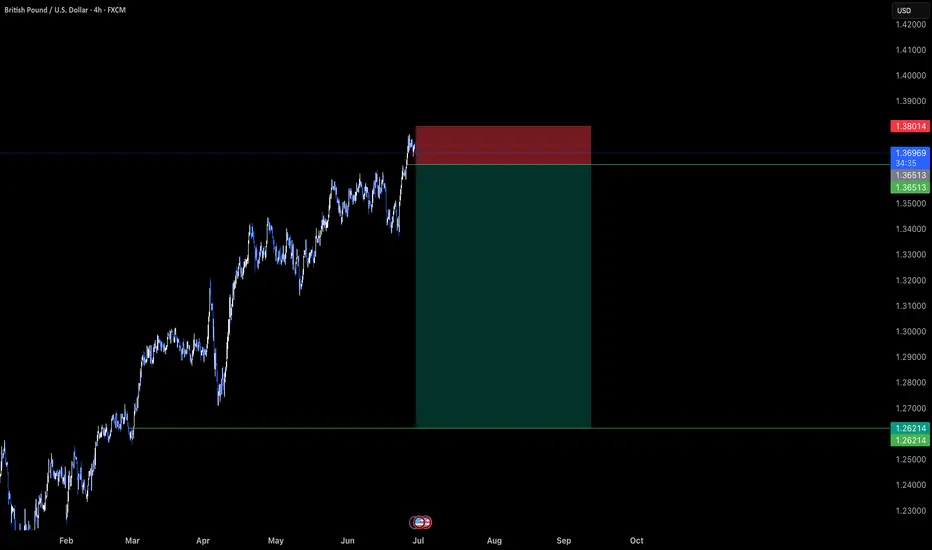
GBPUSD's strong uptrend continuesGBPUSD is in a strong uptrend, Price has just broken the resistance zone of 1.37500.
All the bullish momentum is heading towards the resistance zone of 1.388.
If there is a close of the h4 candle below the resistance zone of 1.375, there will likely be a Pullback to 1.363 to find more buying momentum towards the target at the resistance zone of 1.388
📈 Key Levels
Support: 1.375-1.363
Resistance: 1.388
📊 Recommended Trade Setups
BUY GBPUSD 1.375-1.373 Stoploss 1.37000
BUY GBPUSD 1.363-1.361 Stoploss 1.35800
SELL GBPUSD 1.388-1.390 Stoploss 1.39300
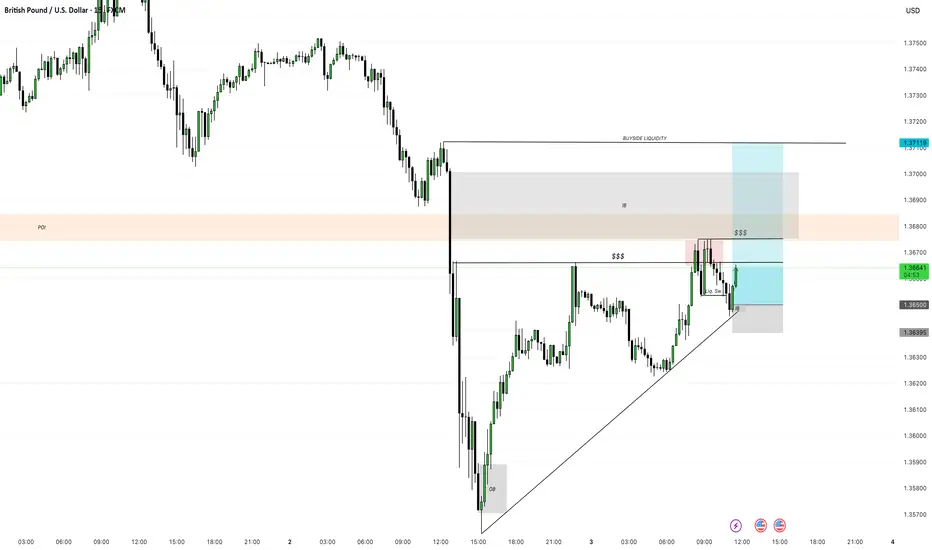
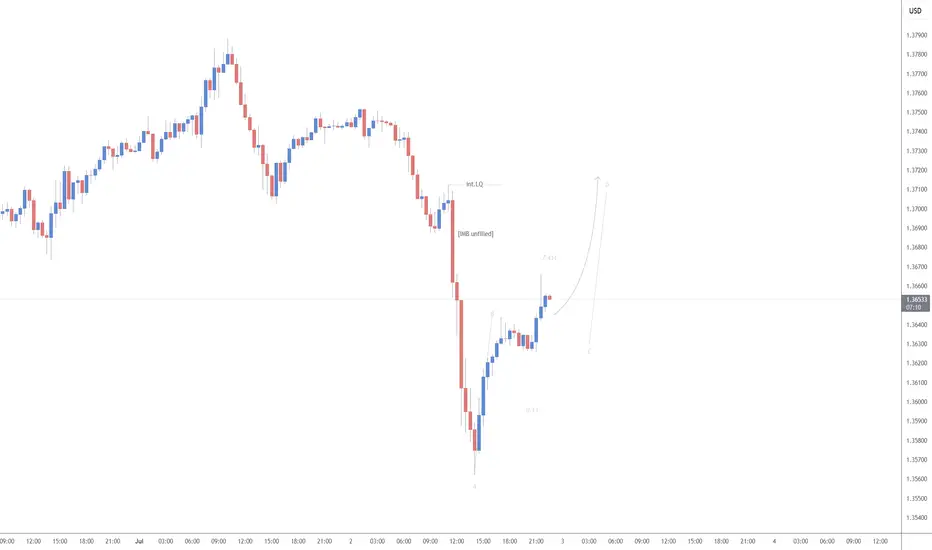
GBPUSD BullishWe are expecting a long continuation on GU after a clear BOS and liquidity sweep on the 1H candle. We patiently wait for a bullish rejection or strong bullish momentum candle as confirmation for entries. Apply proper risk management.

Falling towards pullback support?GBP?USD is falling towards the support level which is a pullback support that lines up with the 38.2% Fibonacci retracement and could drop from this level to our take profit.
Entry: 1.3609
Why we like it:
There is a pullback support level that lines up with the 38.2% Fibonacci retracement.
Stop loss: 1.3534
Why we like it:
There is a pullback support.
Take profit: 1.3746
Why we like it:
There is a pullback resistance.
Enjoying your TradingView experience? Review us!
Please be advised that the information presented on TradingView is provided to Vantage (‘Vantage Global Limited’, ‘we’) by a third-party provider (‘Everest Fortune Group’). Please be reminded that you are solely responsible for the trading decisions on your account. There is a very high degree of risk involved in trading. Any information and/or content is intended entirely for research, educational and informational purposes only and does not constitute investment or consultation advice or investment strategy. The information is not tailored to the investment needs of any specific person and therefore does not involve a consideration of any of the investment objectives, financial situation or needs of any viewer that may receive it. Kindly also note that past performance is not a reliable indicator of future results. Actual results may differ materially from those anticipated in forward-looking or past performance statements. We assume no liability as to the accuracy or completeness of any of the information and/or content provided herein and the Company cannot be held responsible for any omission, mistake nor for any loss or damage including without limitation to any loss of profit which may arise from reliance on any information supplied by Everest Fortune Group.


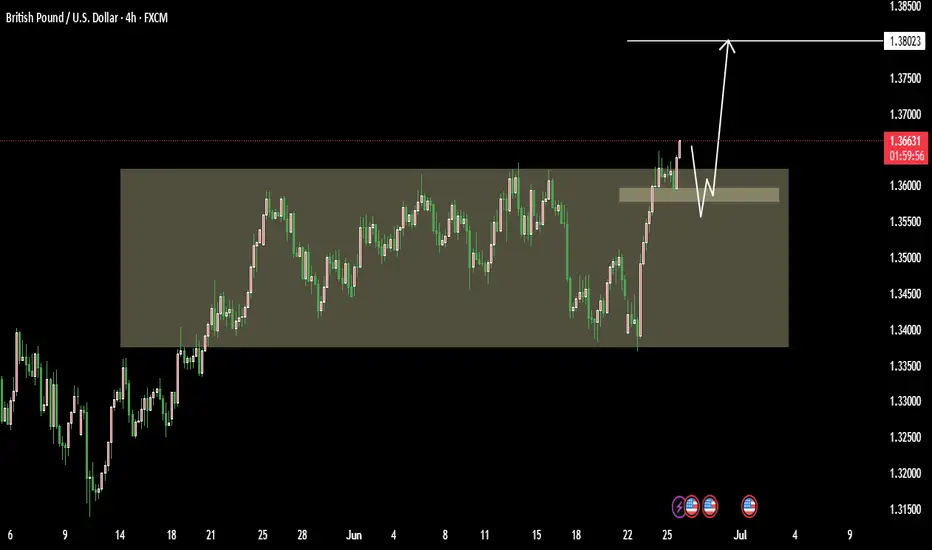
GBPUSD Could Highly Step to MoonGBPUSD is showing strong potential for a bullish breakout, supported by the ongoing decline in the US Dollar Index. If current momentum holds, the pair could test the 1.3820 resistance level in the coming sessions.
📉 Dollar Weakness as Key Driver
The fundamental backdrop favours the British pound as the US dollar continues to weaken, influenced by: Trade wisely best of luck Buddies.
Ps Support with like and comments for more analysis Thanks.
DOLLAR DIPS AHEAD OF JOB REPORT, GBP/USD TECHNICAL OUTLOOK.Global markets rose on Wednesday, with the dollar hovering near a three-year low of 96, as investors considered the increasing likelihood of US interest rate reduction and the push for trade agreements ahead of President Donald Trump's July 9 tariff deadline.
Meanwhile on the radar, the U.S. official Job report would be on the wire later this week and as always, market participants would keenly pay attention to the reading which would give critical gauge of the labor market strength vis a vis the health of the economy. In view of the upcoming report, a strong report could reinforce confidence in the economy while a mixed print may reignite concerns over the slowing growth.
GBP/USD TECHNICAL OUTLOOK
GBP/USD tested 1.3788 on Tuesday, its highest level since 1st of November 2021(approximately 44 months). However, the bears struggled to push prices before the close of the day.
Looking at the daily chart, the broader market structure remains bullish with price bouncing off the trendline multiple times hence acting as a dynamic support.
The pair is currently retracing, with potential target towards 50 level of the Fib. at 1.3588 which would likely act as a minor support, whereas a break below the 50 level would likely usher sellers to the next potential target around 78.6 level of 1.3469. Meanwhile, a break below 1.3380 would mean absolute BOS and then would signal that bearish momentum has prevailed hence sellers would potentially target 1.3176.
On the flip side, if bulls regain control near the trendline or within the Fibonacci zones, the key upside target remains the previous high at 1.3788, followed by a push toward the psychological 1.3800 barrier according to analysts. Breakouts in either direction remain possible in the coming weeks, especially amid heightened volatility and key macroeconomic drivers.

GBPUSD H4 I A short-term Bearish DropBased on the H4 chart analysis, we can see that the price is currently at our sell entry at 1.3723 which is an overlap resistance.
Our take profit will be at 1.3631 a pullback support that aligns closely with the 38.2% Fib retracement.
The stop loss will be placed at 1.3787, above a swing high resistance level.
High Risk Investment Warning
Trading Forex/CFDs on margin carries a high level of risk and may not be suitable for all investors. Leverage can work against you.
Stratos Markets Limited (tradu.com ):
CFDs are complex instruments and come with a high risk of losing money rapidly due to leverage. 63% of retail investor accounts lose money when trading CFDs with this provider. You should consider whether you understand how CFDs work and whether you can afford to take the high risk of losing your money.
Stratos Europe Ltd (tradu.com ):
CFDs are complex instruments and come with a high risk of losing money rapidly due to leverage. 63% of retail investor accounts lose money when trading CFDs with this provider. You should consider whether you understand how CFDs work and whether you can afford to take the high risk of losing your money.
Stratos Global LLC (tradu.com ):
Losses can exceed deposits.
Please be advised that the information presented on TradingView is provided to Tradu (‘Company’, ‘we’) by a third-party provider (‘TFA Global Pte Ltd’). Please be reminded that you are solely responsible for the trading decisions on your account. There is a very high degree of risk involved in trading. Any information and/or content is intended entirely for research, educational and informational purposes only and does not constitute investment or consultation advice or investment strategy. The information is not tailored to the investment needs of any specific person and therefore does not involve a consideration of any of the investment objectives, financial situation or needs of any viewer that may receive it. Kindly also note that past performance is not a reliable indicator of future results. Actual results may differ materially from those anticipated in forward-looking or past performance statements. We assume no liability as to the accuracy or completeness of any of the information and/or content provided herein and the Company cannot be held responsible for any omission, mistake nor for any loss or damage including without limitation to any loss of profit which may arise from reliance on any information supplied by TFA Global Pte Ltd.
The speaker(s) is neither an employee, agent nor representative of Tradu and is therefore acting independently. The opinions given are their own, constitute general market commentary, and do not constitute the opinion or advice of Tradu or any form of personal or investment advice. Tradu neither endorses nor guarantees offerings of third-party speakers, nor is Tradu responsible for the content, veracity or opinions of third-party speakers, presenters or participants.

Bullish continuation?The Cable (GBP/USD) is falling towards the pivot, which acts as a pullback support and could bounce to the 1st resistance.
Pivot: 1.3617
1st Support: 1.3442
1st Resistance: 1.3795
Risk Warning:
Trading Forex and CFDs carries a high level of risk to your capital and you should only trade with money you can afford to lose. Trading Forex and CFDs may not be suitable for all investors, so please ensure that you fully understand the risks involved and seek independent advice if necessary.
Disclaimer:
The above opinions given constitute general market commentary, and do not constitute the opinion or advice of IC Markets or any form of personal or investment advice.
Any opinions, news, research, analyses, prices, other information, or links to third-party sites contained on this website are provided on an "as-is" basis, are intended only to be informative, is not an advice nor a recommendation, nor research, or a record of our trading prices, or an offer of, or solicitation for a transaction in any financial instrument and thus should not be treated as such. The information provided does not involve any specific investment objectives, financial situation and needs of any specific person who may receive it. Please be aware, that past performance is not a reliable indicator of future performance and/or results. Past Performance or Forward-looking scenarios based upon the reasonable beliefs of the third-party provider are not a guarantee of future performance. Actual results may differ materially from those anticipated in forward-looking or past performance statements. IC Markets makes no representation or warranty and assumes no liability as to the accuracy or completeness of the information provided, nor any loss arising from any investment based on a recommendation, forecast or any information supplied by any third-party.

Current Execution on GBPUSD Long Position. 15m TFGBPUSD Long Analysis and Current Market Execution. 15m TF
I will post an update later on upon how this analysis plays out, also explaining my analysis, bias and reasoning behind the position.
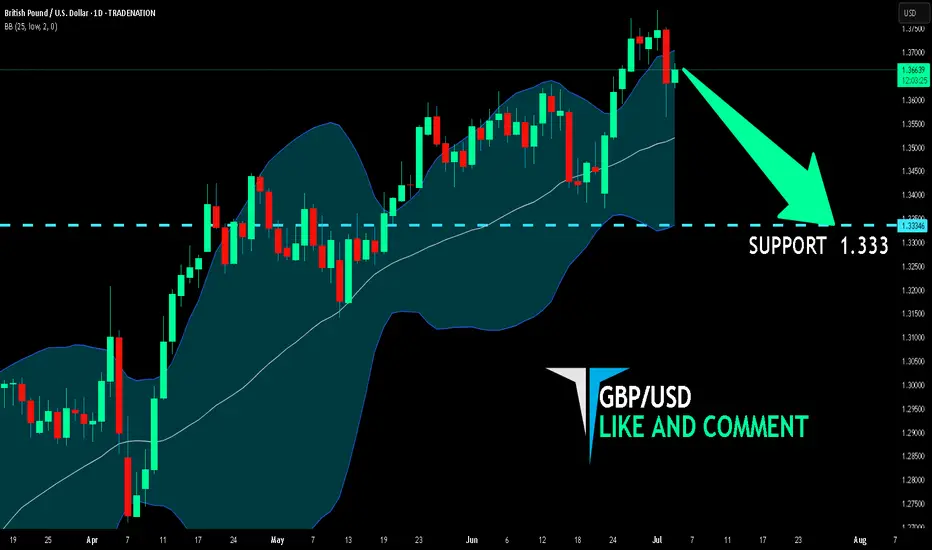
GBP/USD BEARISH BIAS RIGHT NOW| SHORT
Hello, Friends!
GBP/USD pair is in the downtrend because previous week’s candle is red, while the price is obviously rising on the 1D timeframe. And after the retest of the resistance line above I believe we will see a move down towards the target below at 1.333 because the pair is overbought due to its proximity to the upper BB band and a bearish correction is likely.
Disclosure: I am part of Trade Nation's Influencer program and receive a monthly fee for using their TradingView charts in my analysis.
✅LIKE AND COMMENT MY IDEAS✅
GBPUSD SHORT POSITION I think the price could go down from this range because I think this is a key point.

GBPUSD - OUTLOOK This is my technical perspective on GBPUSD.
Fundamentally expecting the Dollar to strengthen in the coming weeks
"May fortune attend thee, and thy trade prosper." .......L2Earned
GBP/USD Daily AnalysisPrice is bullish on the daily time frame.
After 4 consecutive bullish days, price printed a bearish inside candle on Friday.
This could potentially be the start of a correction back towards the moving averages and possibly towards the first Fibonacci retracement levels (38.2% and 50%).
If you agree with this analysis, look for a trade that meets your strategy rules.

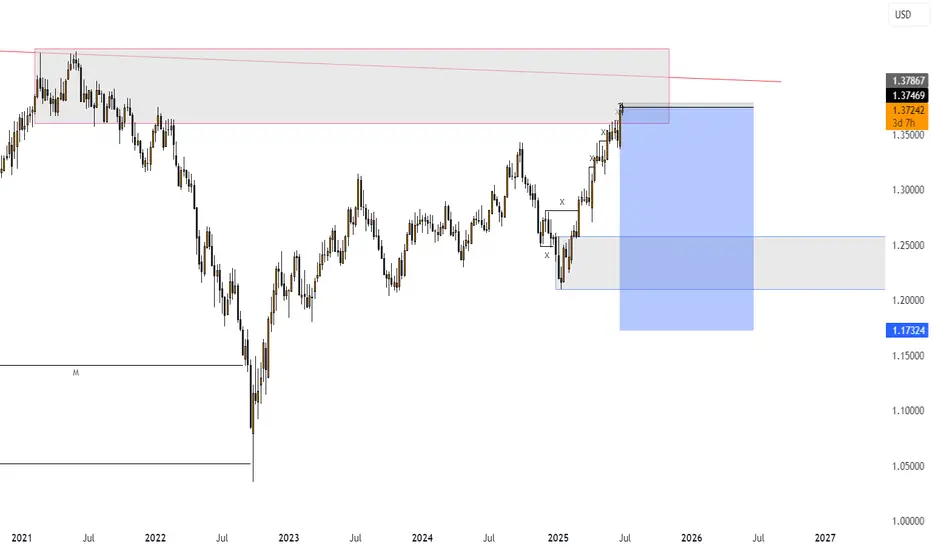
GBPUSD - Over-Bought!Hello TradingView Family / Fellow Traders. This is Richard, also known as theSignalyst.
📈GBPUSD has been hovering within a big range marked in red and blue.
This week, GBPUSD is retesting the upper bound of the range acting as a resistance.
As long as the resistance holds, we will be looking for shorts on lower timeframes, targeting the lower bound of the range.
📚 Always follow your trading plan regarding entry, risk management, and trade management.
Good luck!
All Strategies Are Good; If Managed Properly!
~Rich
Disclosure: I am part of Trade Nation's Influencer program and receive a monthly fee for using their TradingView charts in my analysis.

GBPUSD - trade - market structureGBPUSD - trade - market structure , easy setup, clean setup , good probability, if this happen is a big win, use risk and trade managment
GBPUSD TRADE SETUPWait for Retest the entry level and Bullish momentum candle then take a trade for Buy otherwise skip this setup

GBPUSD: Short Signal with Entry/SL/TP
GBPUSD
- Classic bearish pattern
- Our team expects retracement
SUGGESTED TRADE:
Swing Trade
Sell GBPUSD
Entry - 1.3710
Stop - 1.3765
Take - 1.3604
Our Risk - 1%
Start protection of your profits from lower levels
Disclosure: I am part of Trade Nation's Influencer program and receive a monthly fee for using their TradingView charts in my analysis.
❤️ Please, support our work with like & comment! ❤️

GBPUSD M30 IdeaPotential for a bullish pullback on the GBPUSD M30 which could lead to a price movement towards the resistance level at 1.37200. BUY levels from 1.36400
GBPUSD Will Go Up! Buy!
Take a look at our analysis for GBPUSD.
Time Frame: 8h
Current Trend: Bullish
Sentiment: Oversold (based on 7-period RSI)
Forecast: Bullish
The market is on a crucial zone of demand 1.370.
The oversold market condition in a combination with key structure gives us a relatively strong bullish signal with goal 1.378 level.
P.S
Please, note that an oversold/overbought condition can last for a long time, and therefore being oversold/overbought doesn't mean a price rally will come soon, or at all.
Disclosure: I am part of Trade Nation's Influencer program and receive a monthly fee for using their TradingView charts in my analysis.
Like and subscribe and comment my ideas if you enjoy them!
